Figure shows x-t graph of a particle. Find the Time T such that the average velocity of the particle during the period 0 to T is Zero.

The correct Answer is:A, B
Consider the point B1 at =12 sec
At t=0
S=20 m
and at t=12 sec
S=20 m<br>Sofortime∫erval0→12secchan≥∈displacementiszer⊙<br>:. Average velocity = displacement/time = 0.
Hence the time is 12 sec.
Topper's Solved these Questions
- REST AND MOTION : KINEMATICSBOOK - HC VERMA ENGLISHCHAPTER - REST AND MOTION : KINEMATICSEXERCISE - Question for short Answer
13 Videos
- REST AND MOTION : KINEMATICSBOOK - HC VERMA ENGLISHCHAPTER - REST AND MOTION : KINEMATICSEXERCISE - Objective -2
9 Videos
- PHYSICS AND MATHEMATICSBOOK - HC VERMA ENGLISHCHAPTER - PHYSICS AND MATHEMATICSEXERCISE - Question for short Answer
14 Videos
- ROTATIONAL MECHANICSBOOK - HC VERMA ENGLISHCHAPTER - ROTATIONAL MECHANICSEXERCISE - Questions for short Answer
21 Videos
Similar Questions
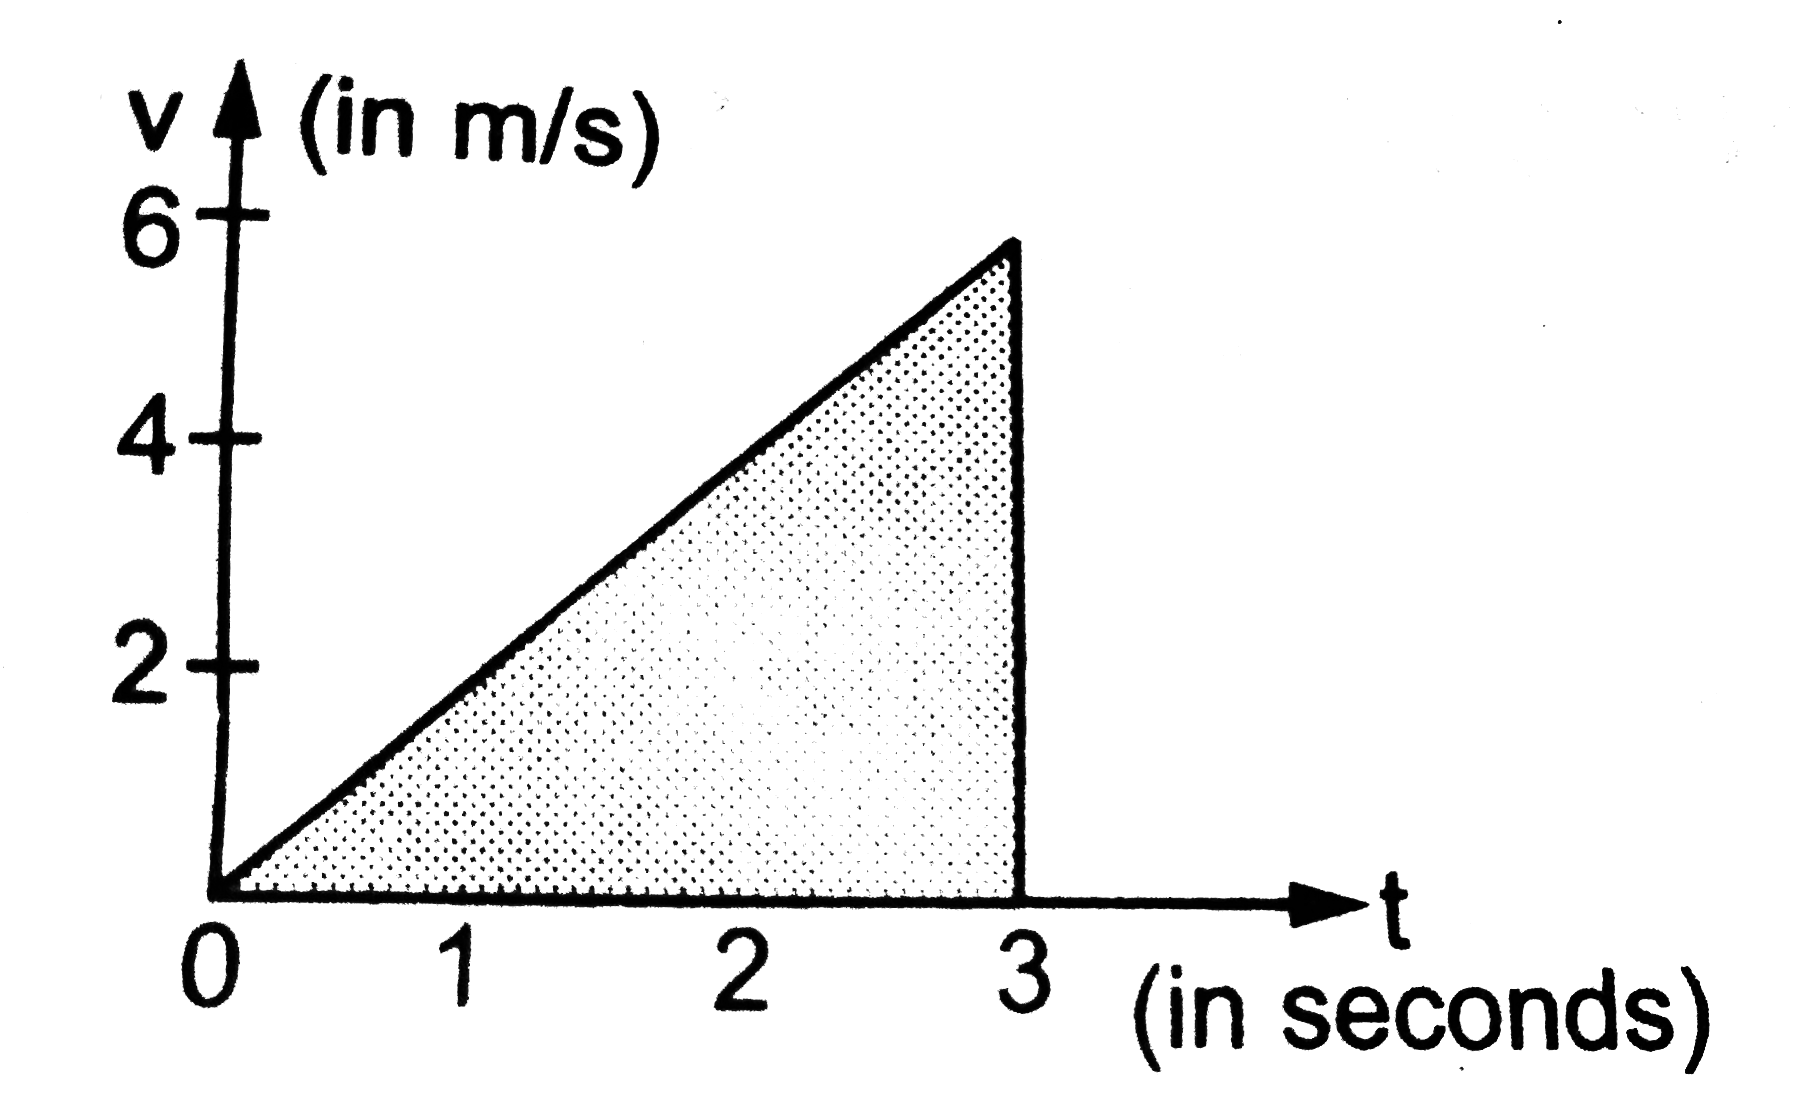
Figure shows the speed versus time graph for a particle. Find the distance travelled by the particle during the time t=0 to t=3s.
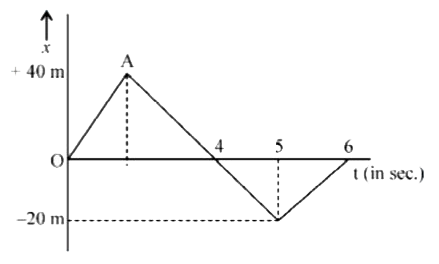
View Solutions-t graph of a particle in motion is shown in Fig. Calculate Average velocity
View SolutionThe velocity of a particle is zero at t=0
View SolutionThe velocity of a particle is zero at time t = 2s, then
View Solutionx−t graph of a particle in SHM is
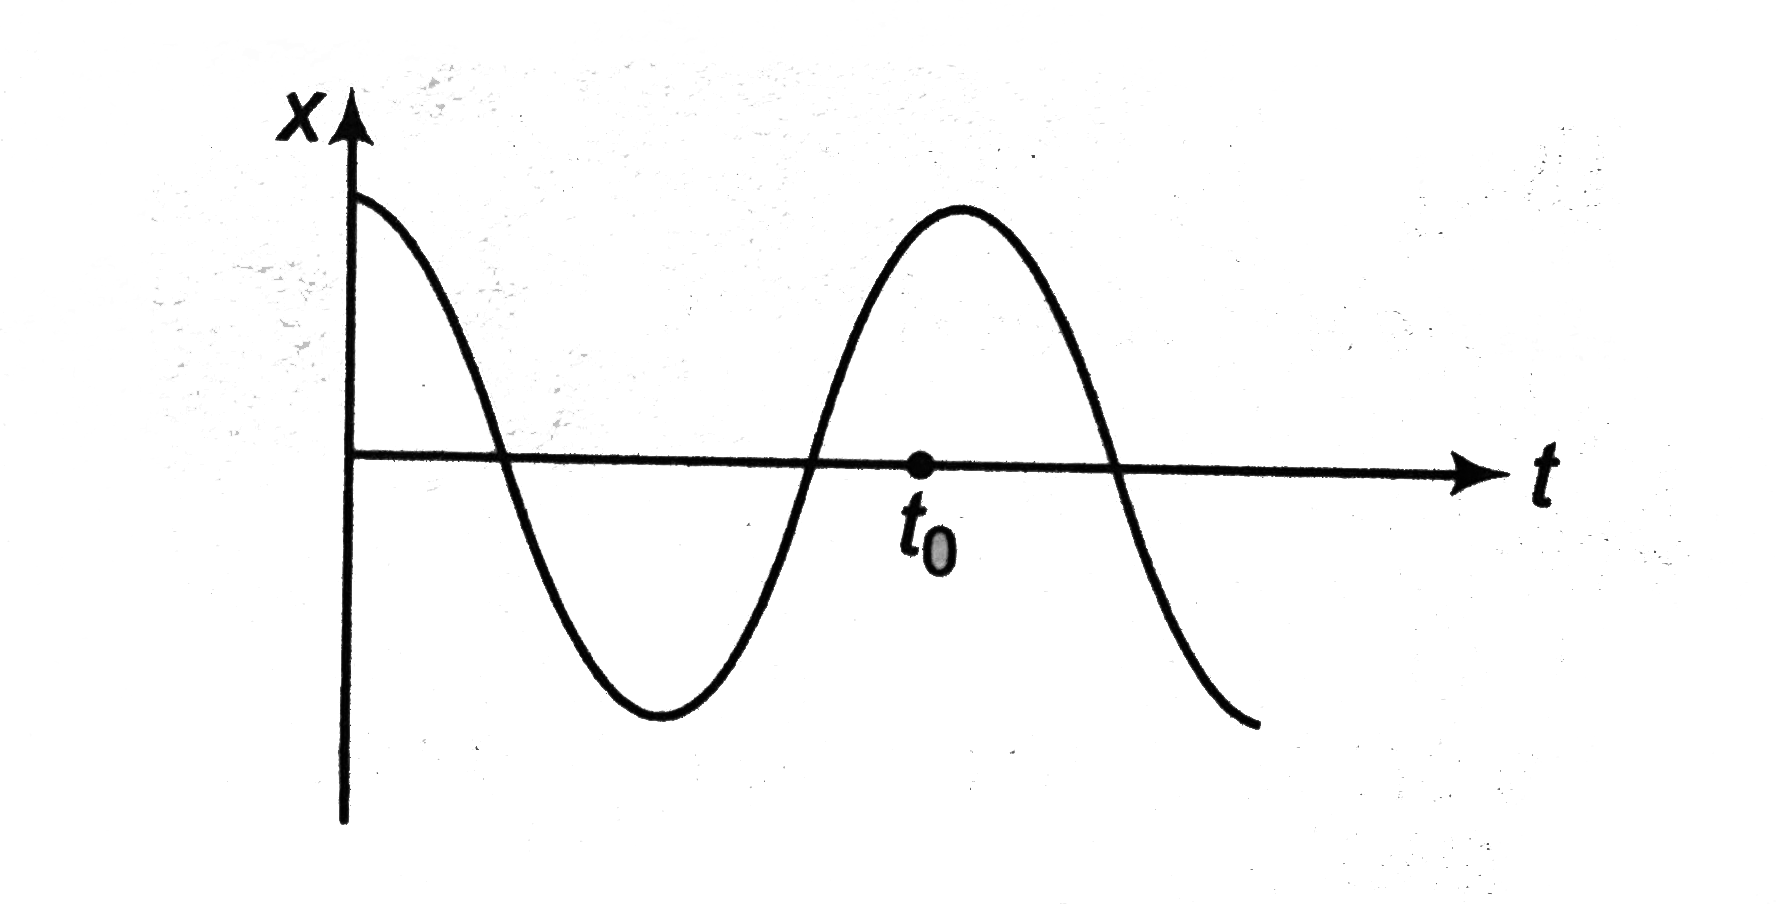
At time t=t0, what are the signs of v and a of the particle?
View SolutionFigure shows the graph of x-coordinate of a particle moving along x-axis as a function of time. Average velocity during t = 0 to 4 s and instantaneous velocity at t = 4.113 s respectively will be
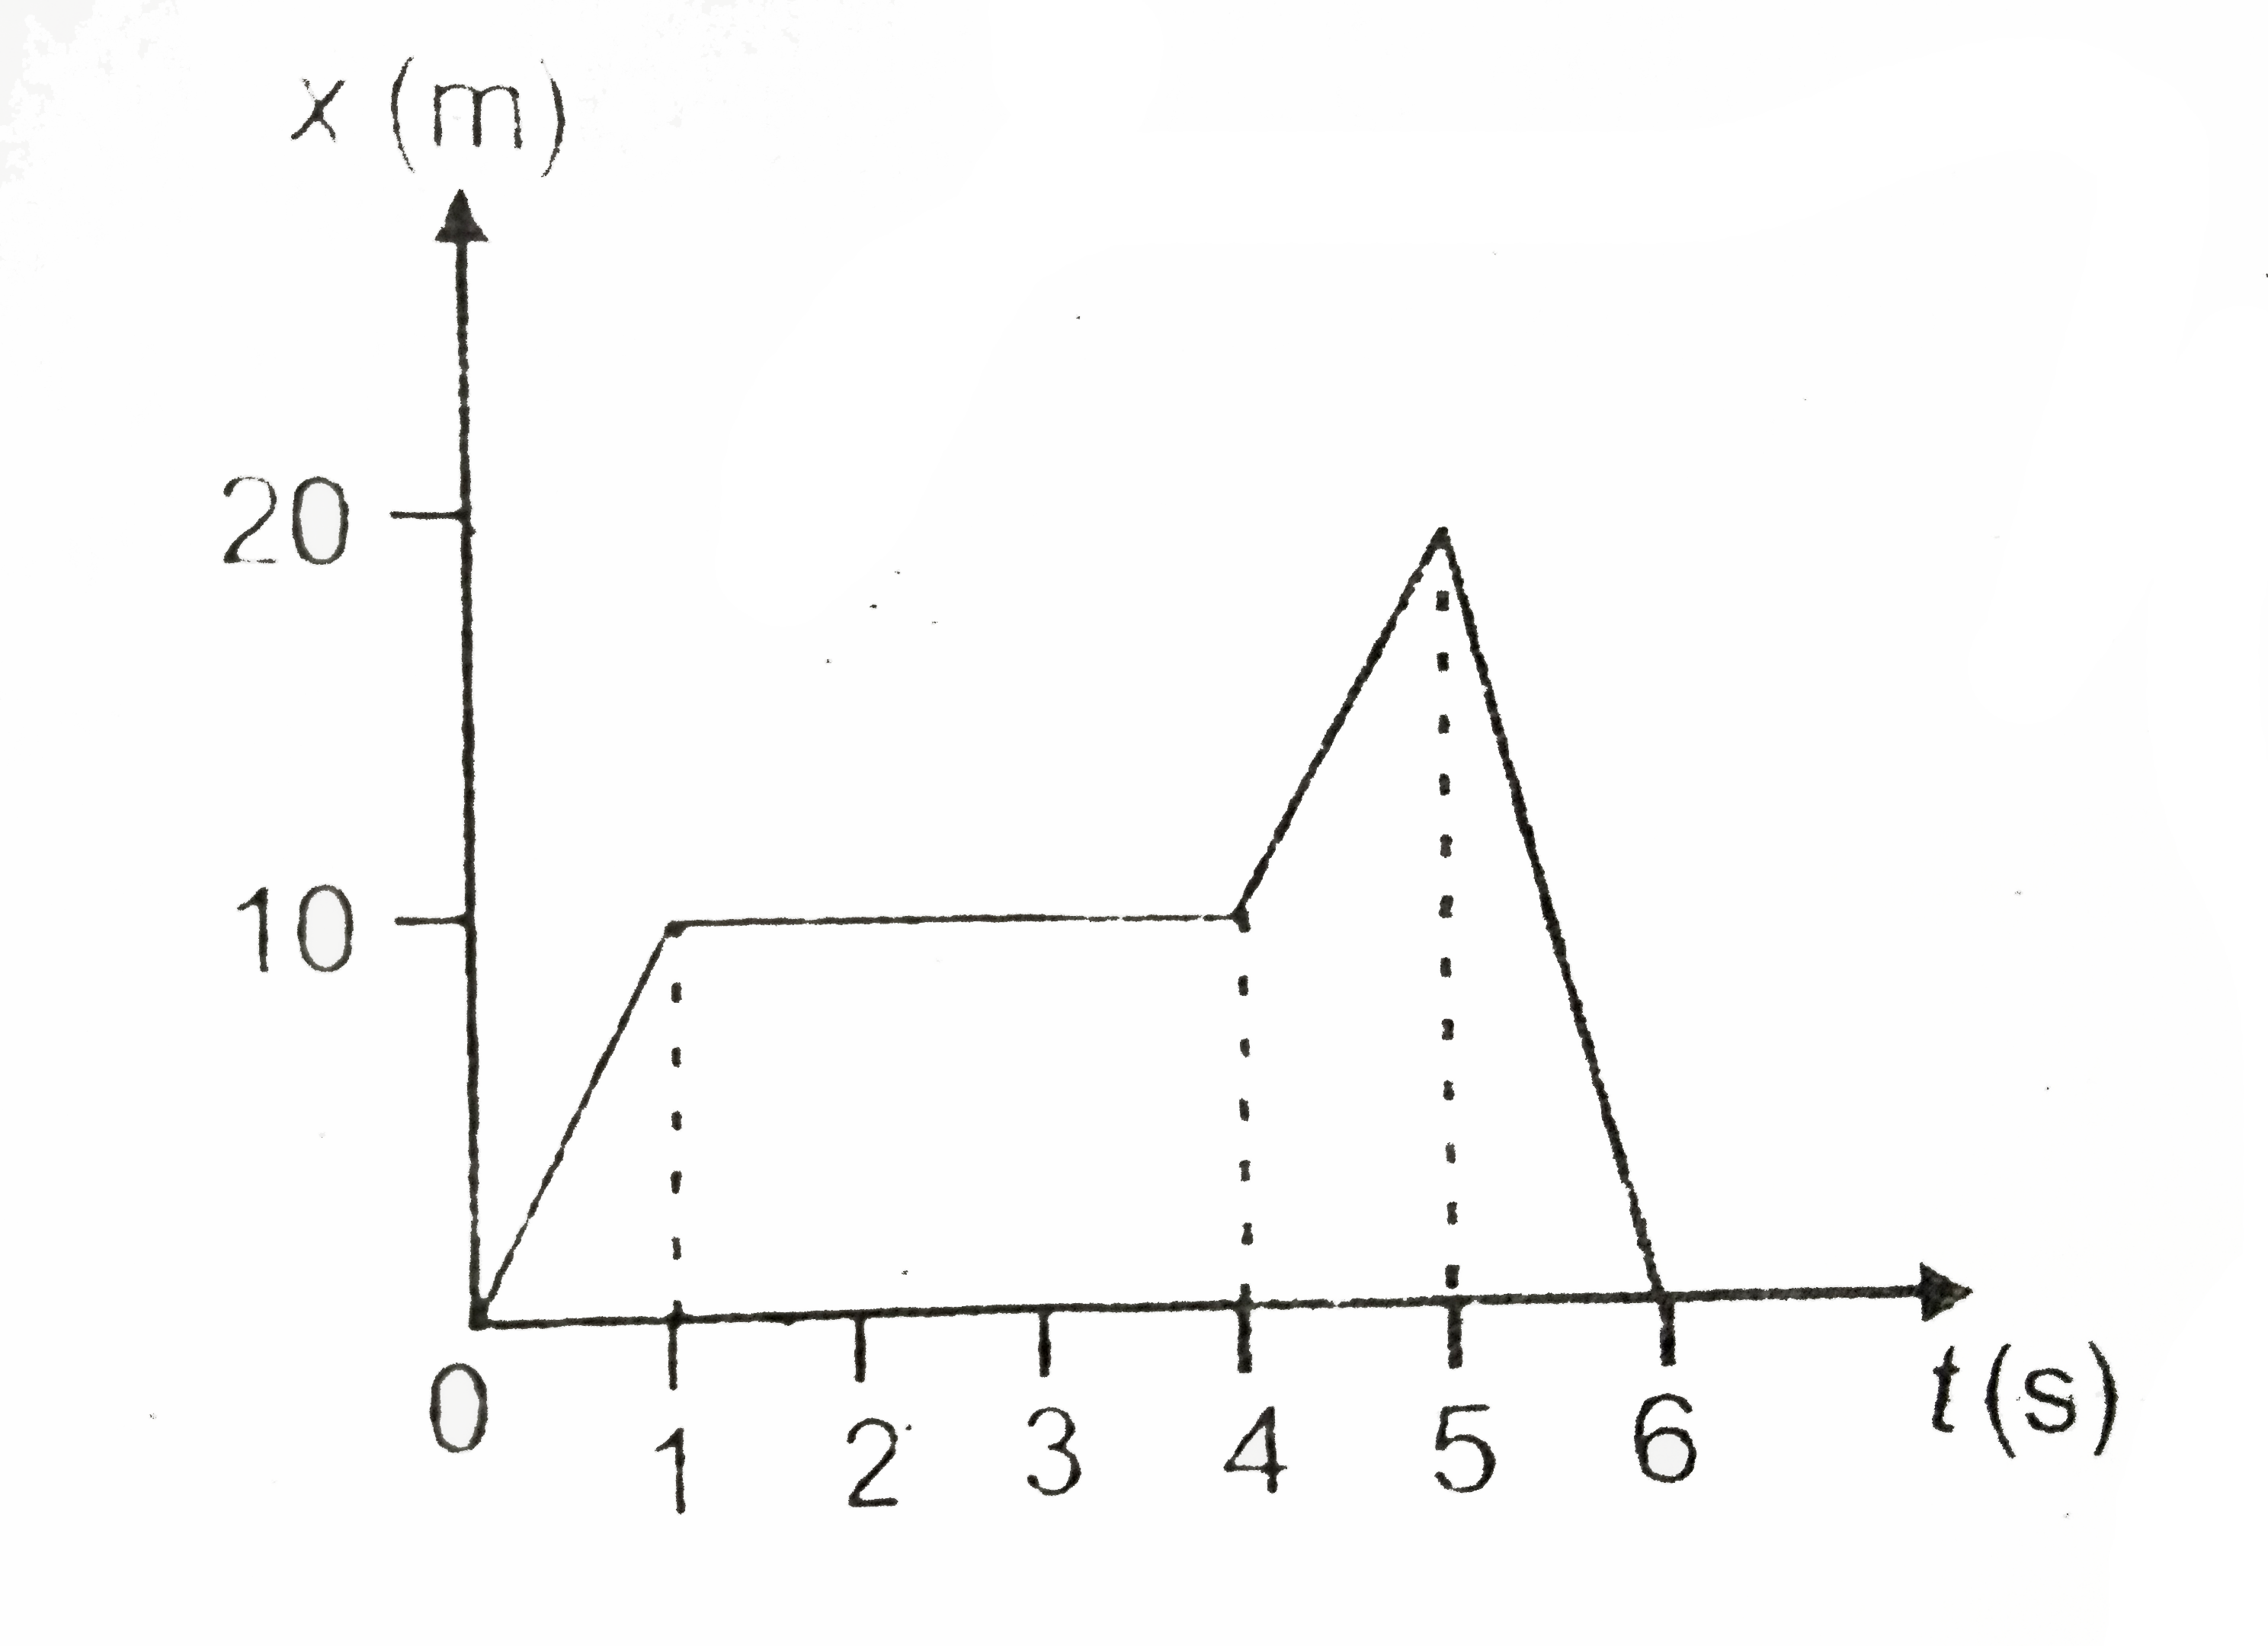
View SolutionFigure shows the velocity time graph for a particle travelling along a straight line. The magnitude of average velocity (in m/s) of particle during the time interval from t=0 to t=6s is 10α. Find the value of α.
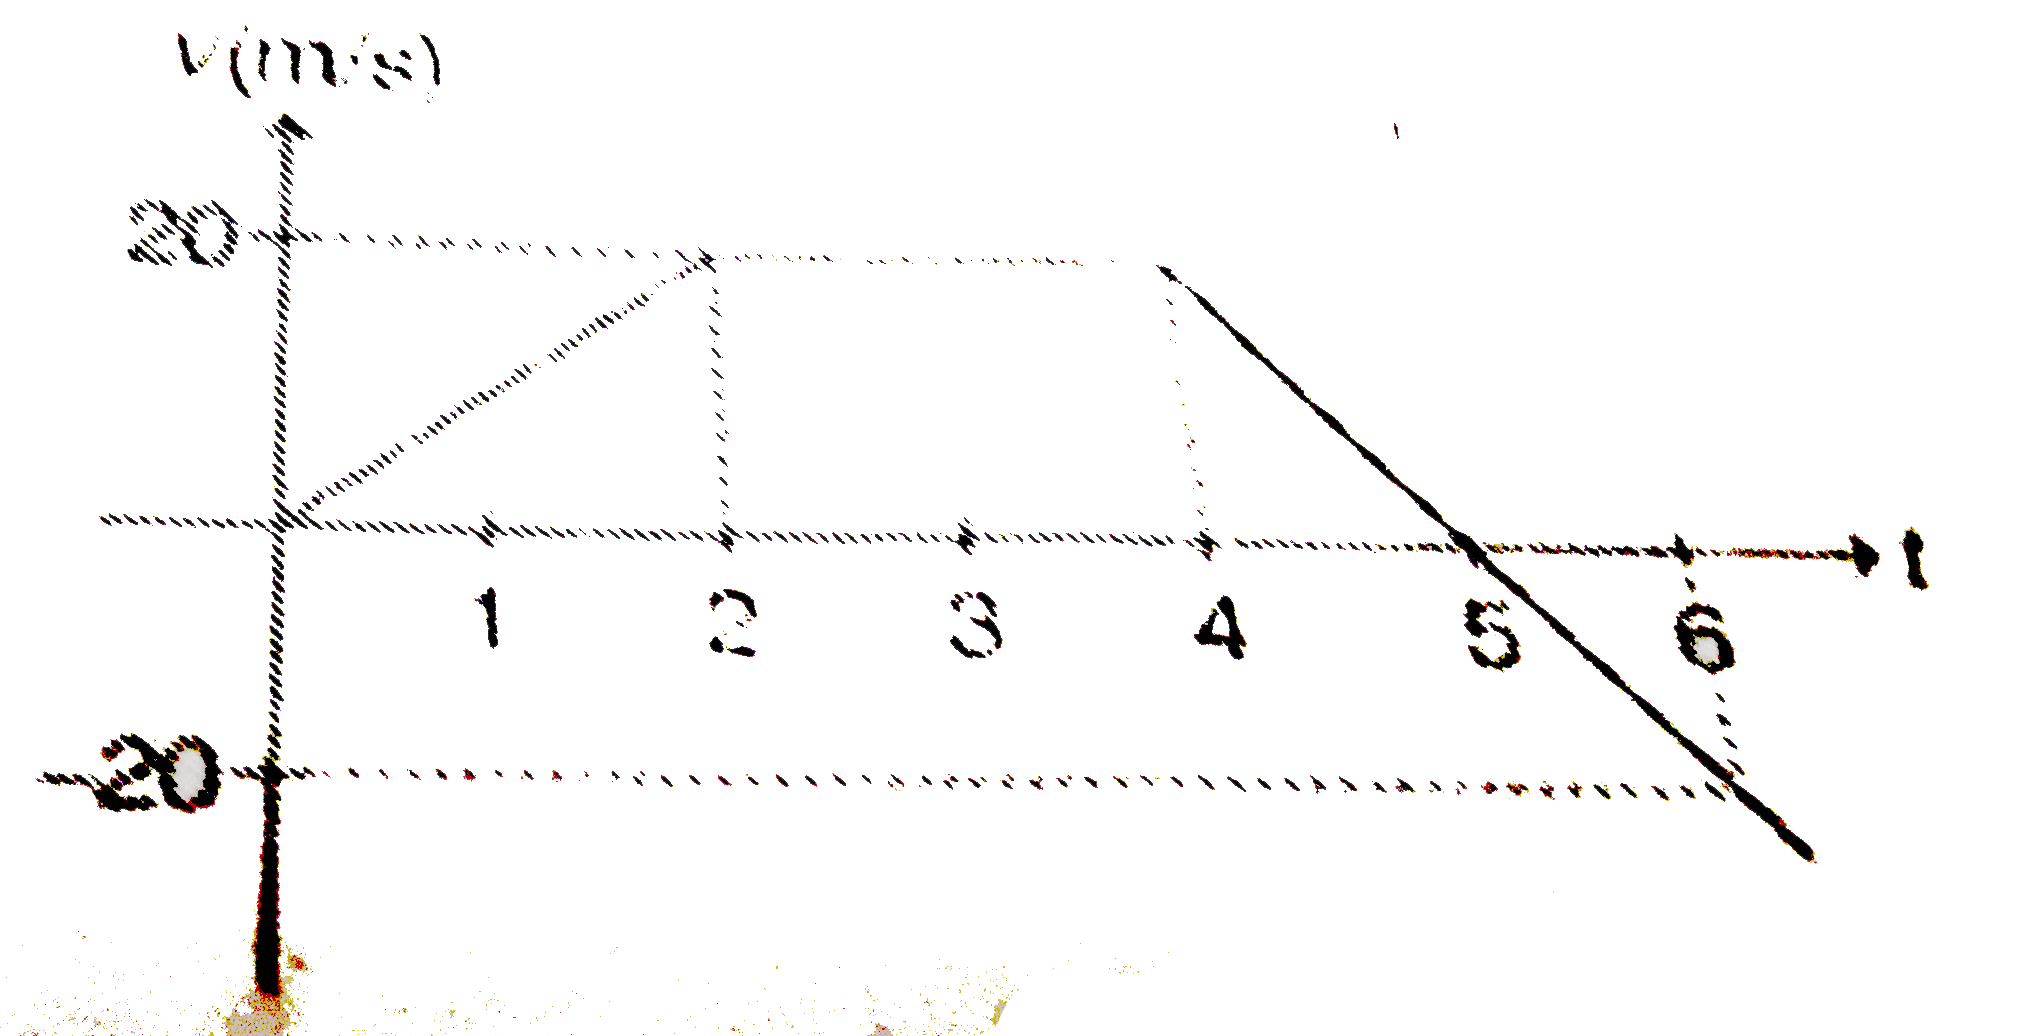
View SolutionThe speed verses time graph for a particle is shown in the figure. The distance travelled (in m) by the particle during the time interval t = 0 to t = 5 s will be __________
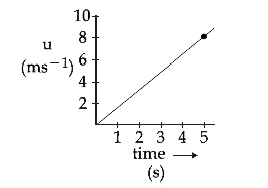
View SolutionThe velocity (v)-time (t) graph of a partide moving along a straight line is as shown in the figure. The displacement of the particle from t = 0 to t = 4 is
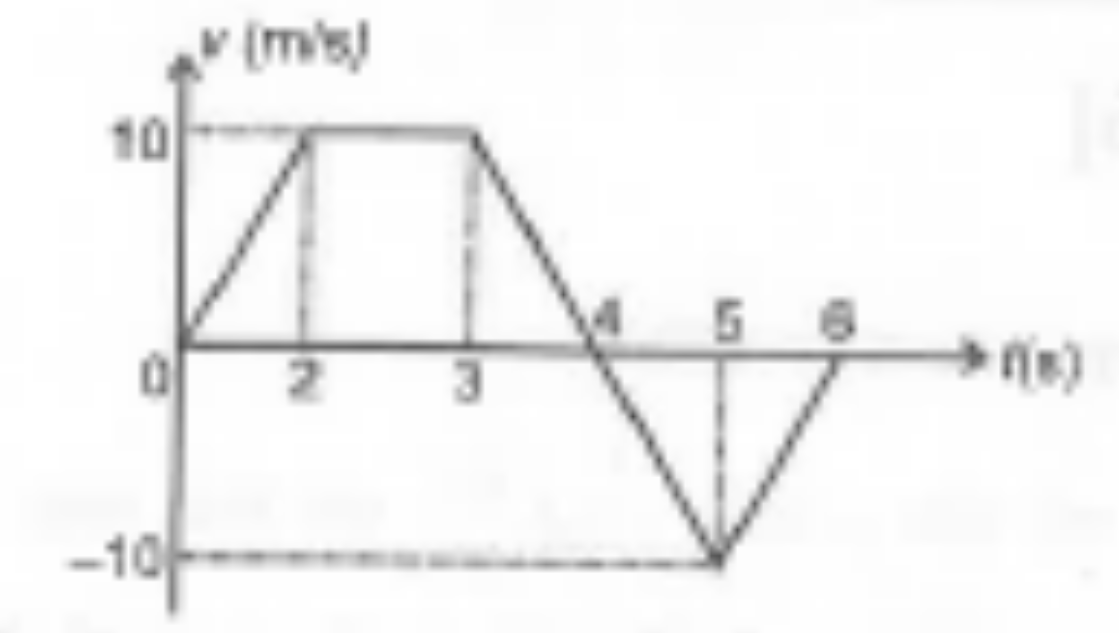
View SolutionThe velocity (v) - time (t) graph for a particle moving along x -axis is shown in the figure.The average velocity in the time interval t=0 to t=8s is
1)4.5ms
2) 2.5ms
3) 5ms
4)2ms
View Solution