A block is placed on a rough floor and a horizontal force F is applied on it. The force of friction f by the floor on the block is measured for different values of F and a graph is plotted between them.
The graph is a straight line of slope450
The graph is a straight line parallel to the F-axis
The graph is a straigtline of slope 450 for small F anda straight line parallel to the F-axis for large F.
There is a small kink on the graph
The correct Answer is:C, D
To solve the problem, we need to analyze the relationship between the applied force F and the frictional force f acting on a block placed on a rough surface. Here’s a step-by-step breakdown of the solution:
Step 1: Understanding the Forces
When a horizontal force F is applied to a block on a rough surface, the frictional force f acts in the opposite direction to resist the motion. Initially, when F is small, f will increase as F increases, up to a certain limit.
Hint: Consider the nature of static friction and how it responds to applied forces.
Step 2: Static Friction
As the applied force F increases from zero, the static friction f also increases. The maximum static friction is known as the limiting friction, denoted as fmax. This occurs just before the block starts to move.
Hint: Remember that static friction can vary up to a maximum value before motion occurs.
Step 3: Graphing the Relationship
We can plot a graph of the applied force F on the x-axis and the frictional force f on the y-axis. Initially, from the origin (0,0) to the point where the static friction reaches its maximum (point A), the graph will be a straight line with a slope of 1 (or 45 degrees), indicating that f=F.
Hint: Think about the slope of the line in relation to the forces involved.
Step 4: Transition to Kinetic Friction
Once the applied force exceeds the maximum static friction (point A), the block will start to move. At this point, the friction acting on the block changes from static to kinetic friction, which is typically less than the maximum static friction. The graph will then become a horizontal line parallel to the x-axis, indicating that the frictional force remains constant despite increases in the applied force.
Hint: Consider how the nature of friction changes once the object is in motion.
Step 5: Analyzing the Graph
The graph will have two distinct regions:
1. A line with a slope of 1 (45 degrees) from (0,0) to point A (where f=fmax).
2. A horizontal line parallel to the x-axis beyond point A, indicating constant kinetic friction.
Hint: Visualize the graph and identify the key points where the nature of friction changes.
Step 6: Conclusion
From the analysis, we can conclude:
- The graph is a straight line of slope 45 degrees for small f (when the block is stationary).
- There is a kink at point A where the static friction reaches its maximum.
- Beyond point A, the graph becomes a straight line parallel to the x-axis, indicating kinetic friction.
Final Answer
- The correct options are:
- Option 3: The graph is a straight line of slope 45 degrees for small f and a straight line parallel to the F-axis for large f.
- Option 4: There is a small kink on the graph.
When a horizontal force F is applied to a block on a rough surface, the frictional force f acts in the opposite direction to resist the motion. Initially, when F is small, f will increase as F increases, up to a certain limit.
As the applied force F increases from zero, the static friction f also increases. The maximum static friction is known as the limiting friction, denoted as fmax. This occurs just before the block starts to move.
We can plot a graph of the applied force F on the x-axis and the frictional force f on the y-axis. Initially, from the origin (0,0) to the point where the static friction reaches its maximum (point A), the graph will be a straight line with a slope of 1 (or 45 degrees), indicating that f=F.
Once the applied force exceeds the maximum static friction (point A), the block will start to move. At this point, the friction acting on the block changes from static to kinetic friction, which is typically less than the maximum static friction. The graph will then become a horizontal line parallel to the x-axis, indicating that the frictional force remains constant despite increases in the applied force.
The graph will have two distinct regions:
1. A line with a slope of 1 (45 degrees) from (0,0) to point A (where f=fmax).
2. A horizontal line parallel to the x-axis beyond point A, indicating constant kinetic friction.
From the analysis, we can conclude:
- The graph is a straight line of slope 45 degrees for small f (when the block is stationary).
- There is a kink at point A where the static friction reaches its maximum.
- Beyond point A, the graph becomes a straight line parallel to the x-axis, indicating kinetic friction.
- The correct options are:
- Option 3: The graph is a straight line of slope 45 degrees for small f and a straight line parallel to the F-axis for large f.
- Option 4: There is a small kink on the graph.
Topper's Solved these Questions
- FRICTIONBOOK - HC VERMA ENGLISHCHAPTER - FRICTIONEXERCISE - Exercises
31 Videos
- FRICTIONBOOK - HC VERMA ENGLISHCHAPTER - FRICTIONEXERCISE - Questions for short Answer
11 Videos
- FRICTIONBOOK - HC VERMA ENGLISHCHAPTER - FRICTIONEXERCISE - Objective -1
10 Videos
- FLUID MECHANICSBOOK - HC VERMA ENGLISHCHAPTER - FLUID MECHANICSEXERCISE - All Questions
90 Videos
- GRAVITATIONBOOK - HC VERMA ENGLISHCHAPTER - GRAVITATIONEXERCISE - Question for short Answers
18 Videos
Similar Questions
A block placed on a rough horizontal surface is pulled by a horizontal force F Let f be the force applied by the rough surface on the block . Plot a graph of f versus F .
View SolutionA block of mass m is stationary on a rough inclined plane making an angle θ with the horizontal. Find the contact force between block and the plane
View SolutionA block of mass 20kg is placed on a rough horizontal plane and a horizontal force of 12N is applied. If coefficient of friction is 0.1 the frictional force acting on it is,
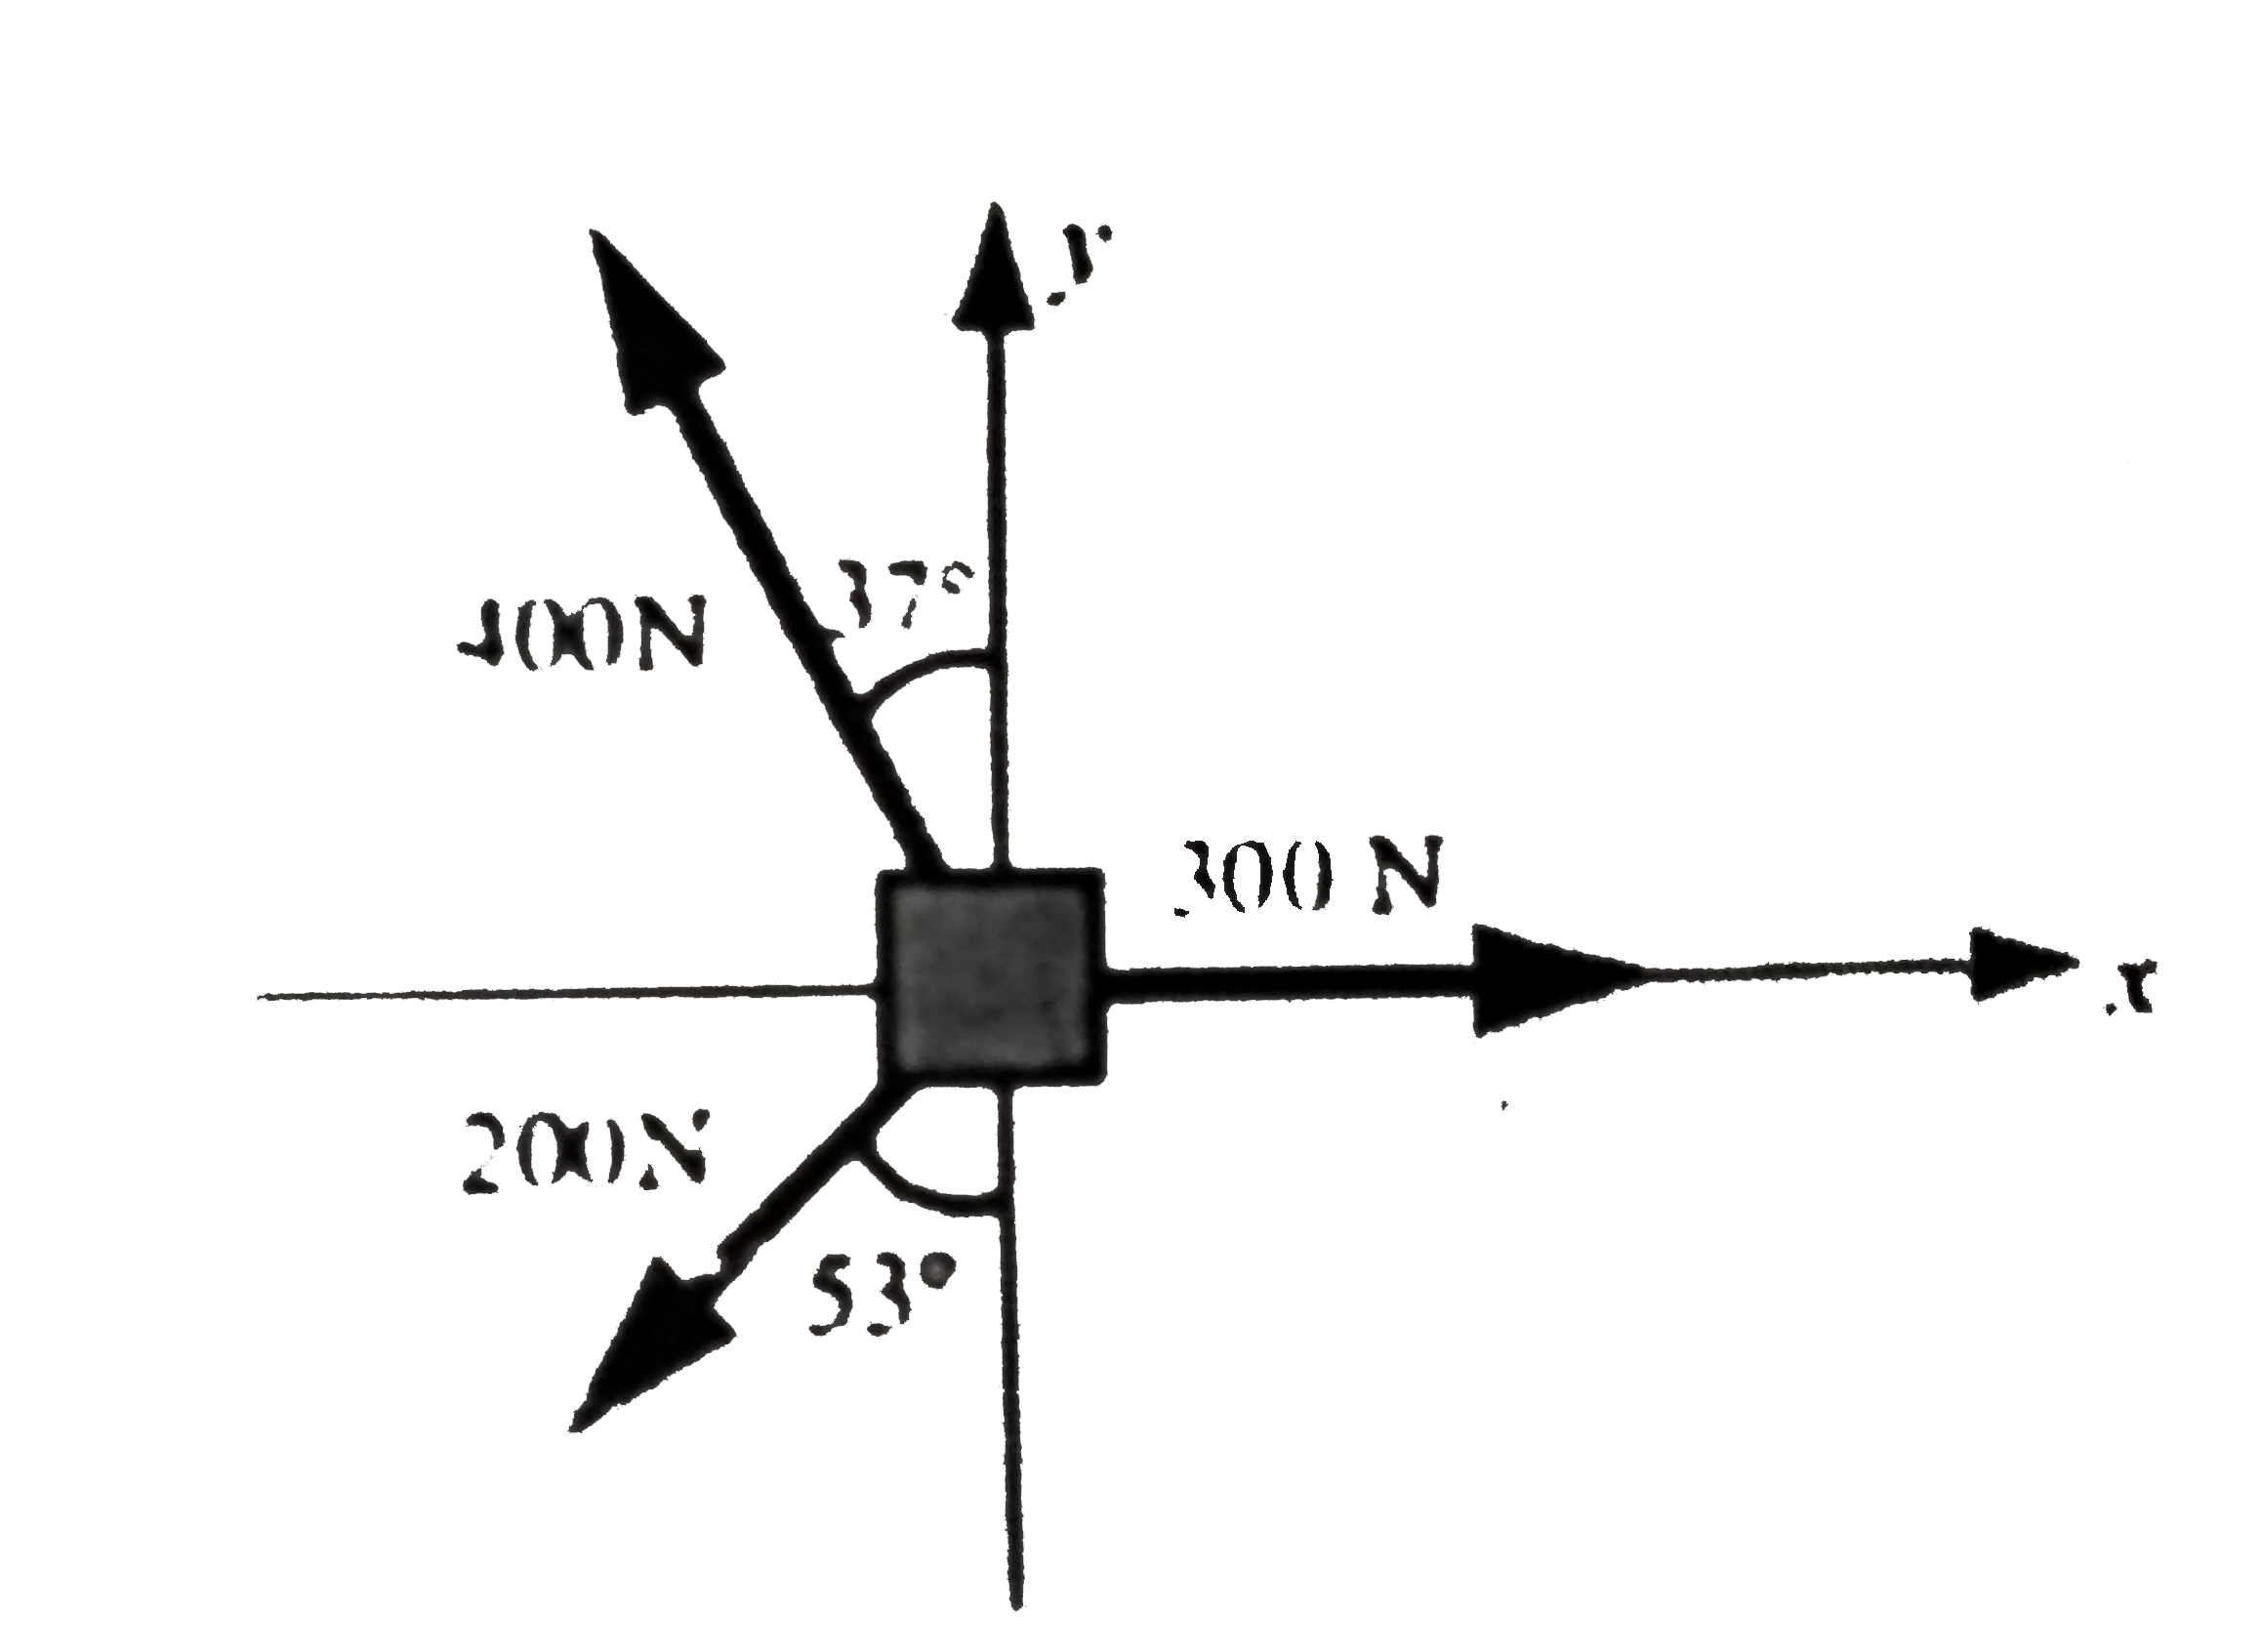
View SolutionA block is placed on a rough horizontal plane. Three horizontalforces are applied on the block as shown in the figure. If the block is in equilibrium, find the friction force acting on the block.

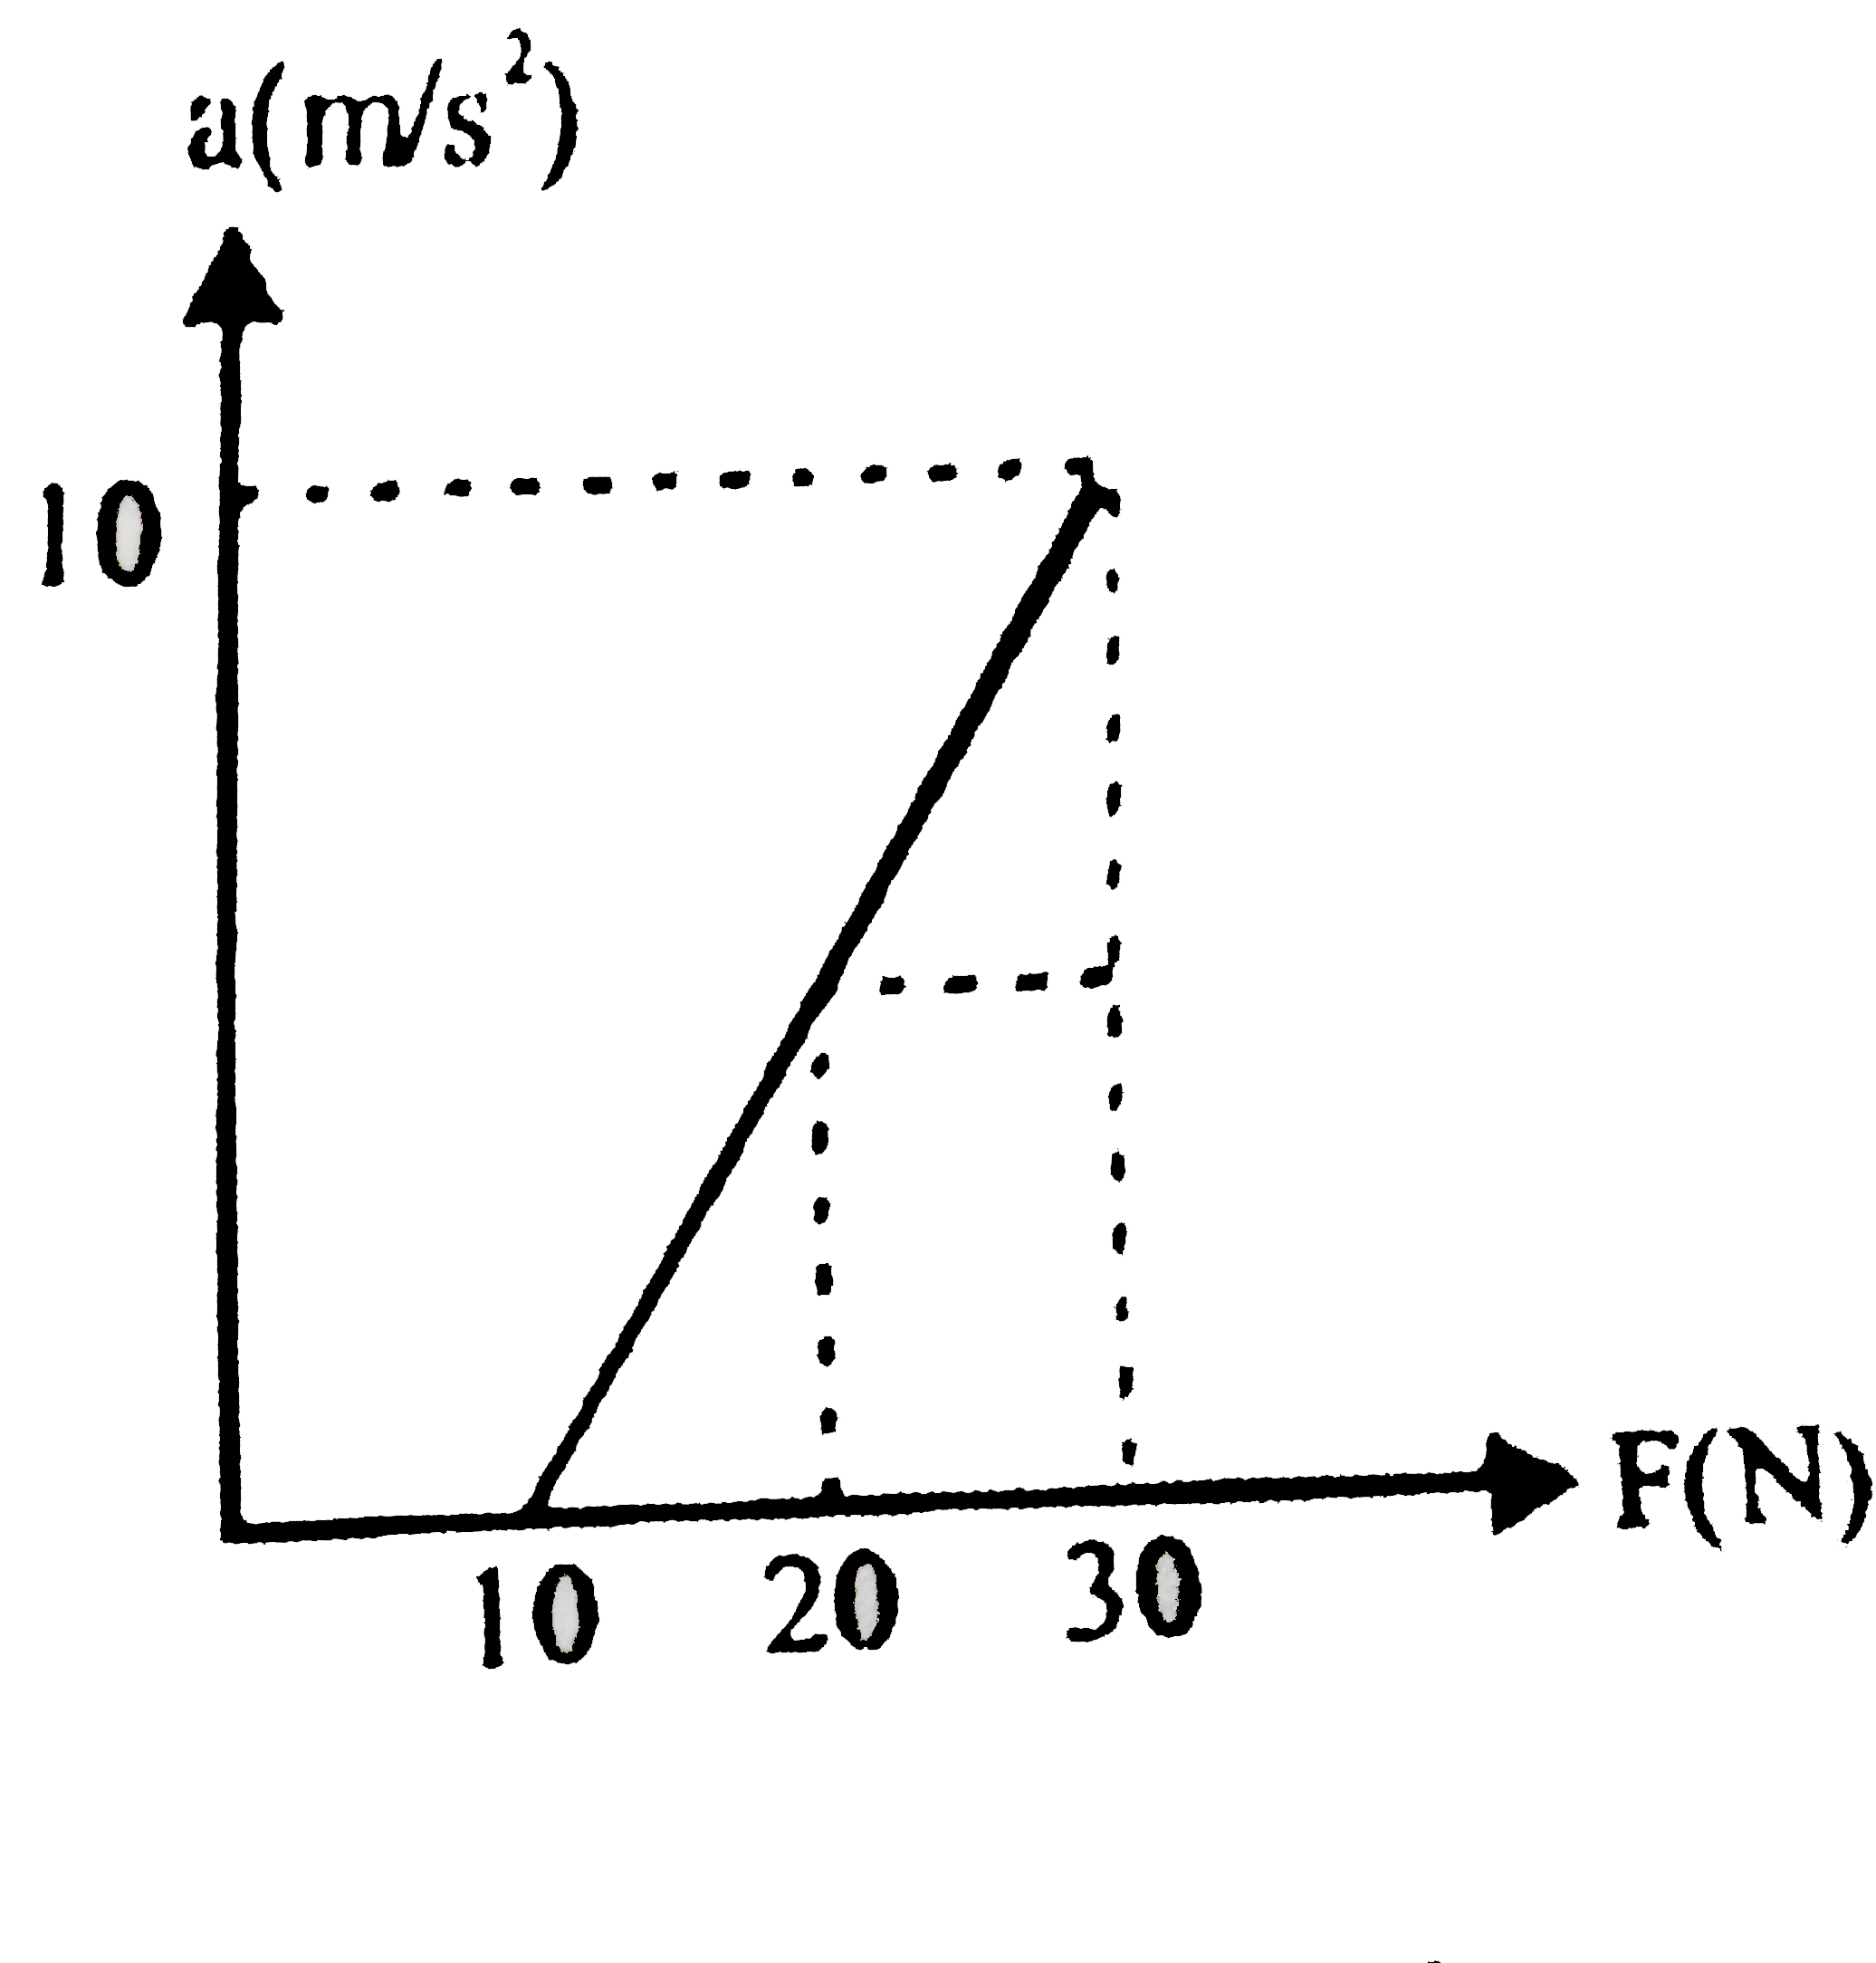
View SolutionA block placed on a rough horizontal surface is pushed with a force F acting horizontally on the block. The magnitude of F is increased and acceleration produced is plotted in the graph shown.

View SolutionA block of mass 10 kg is kept over a rough surface and a force F=4t is applied on it. At what value of t the block will start moving :-
View SolutionA block is placed on a rough horizontal plane. A time dependent horizontal force F=K t acts on the block K is a postive constant. Accelration-time graph of the block is
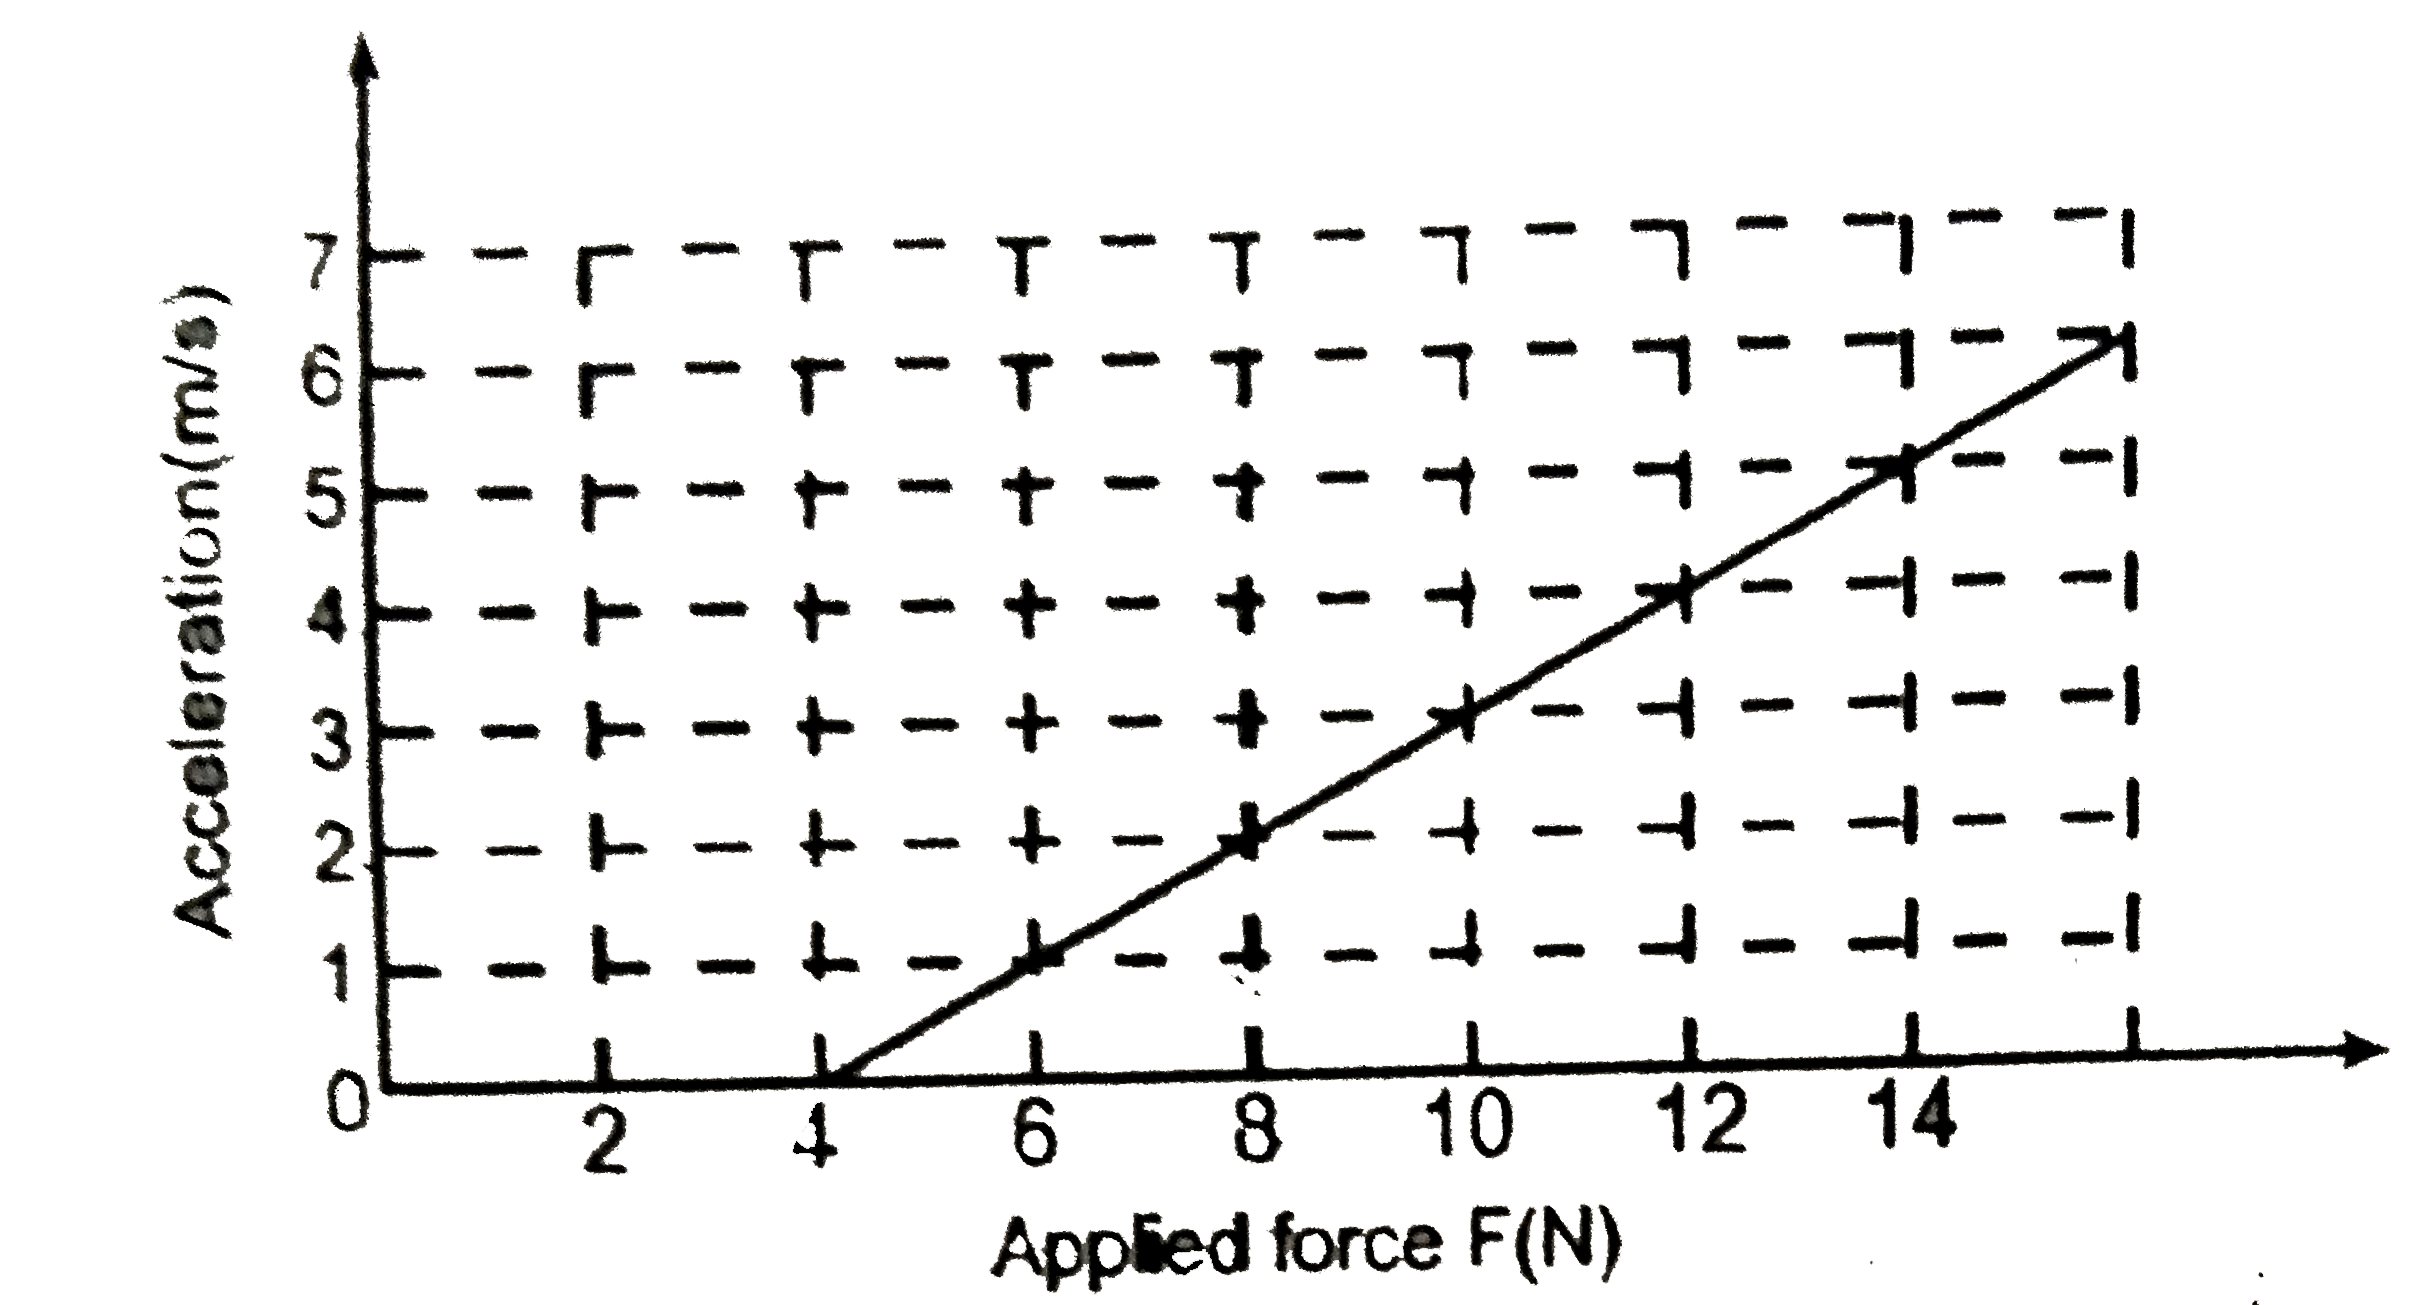
View SolutionA block of unknown mass is at rest on a rough, horizontal surface. A horizontal force F is applied to the block. The graph in the figure shows the acceleration of the block with respect to the applied force. The mass of the block is

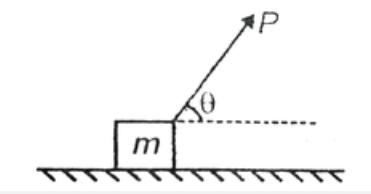
View SolutionA force P acts on a smooth block of mass m placed on a horizontal floor at an angle θ with with horizontal on the block

View SolutionA block weighs W is held against a vertical wall by applying a horizontal force F. The minimum value of F needed to hold the block is
View Solution
