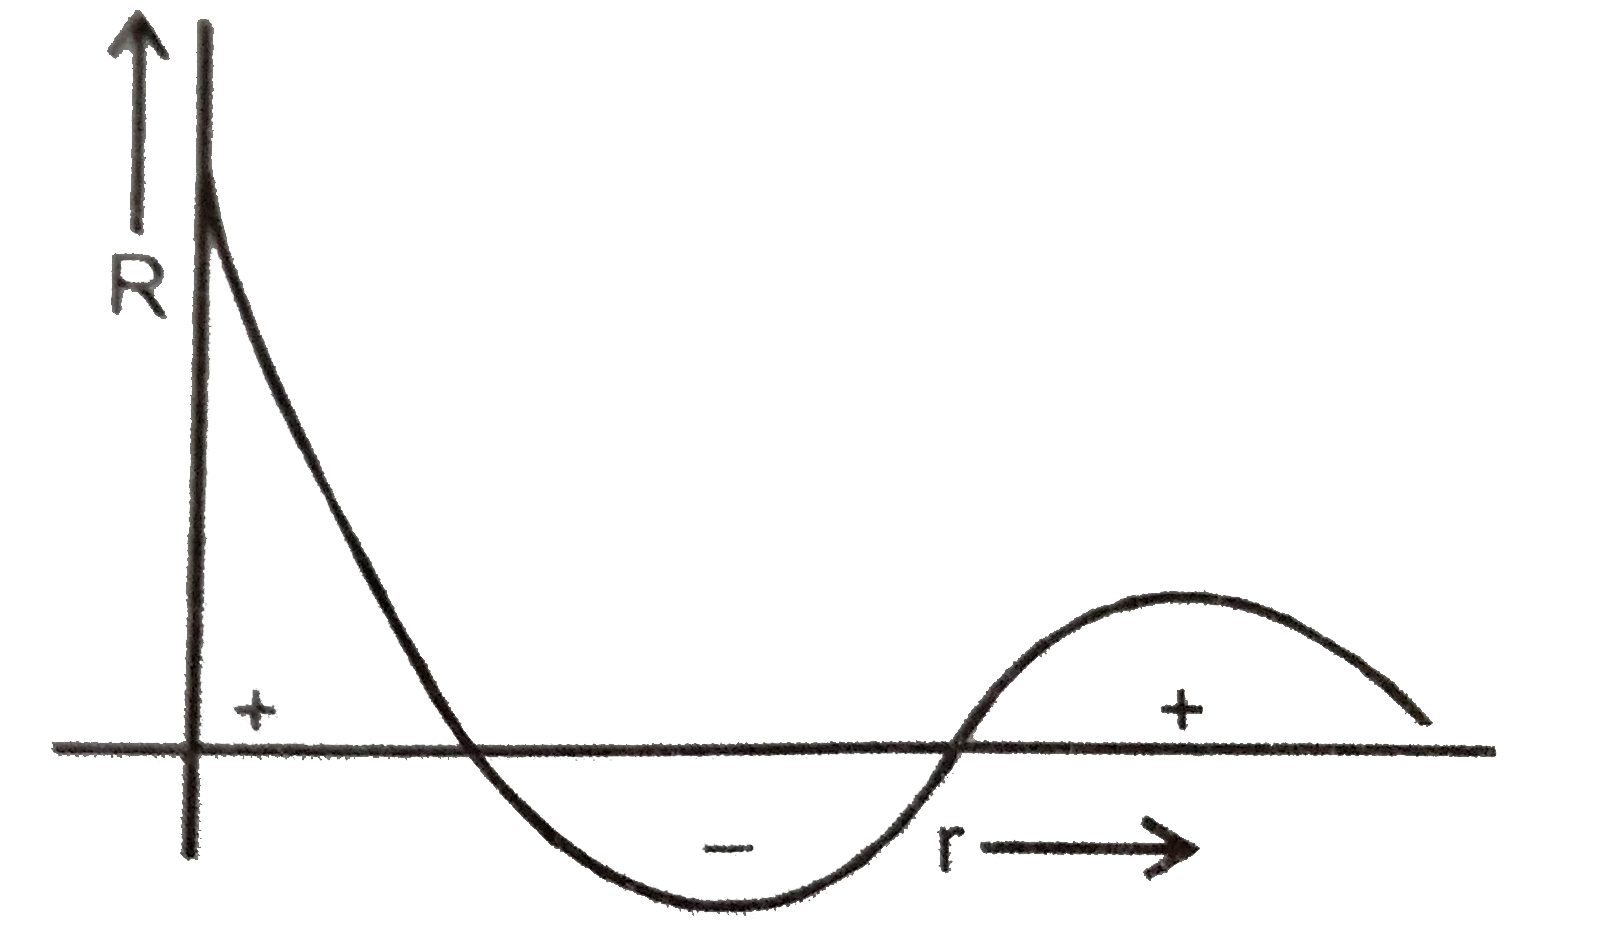
Wave function of an orbital is plotted against the distance from nucleus. The graphical representation is of :

1s
2s
3s
2p
The correct Answer is:C
Step by step video & image solution for Wave function of an orbital is plotted against the distance from nucleus. The graphical representation is of : by Chemistry experts to help you in doubts & scoring excellent marks in Class 11 exams.
Updated on:21/07/2023Topper's Solved these Questions
- ATOMIC STUCTUREBOOK - NARENDRA AWASTHI ENGLISHCHAPTER - ATOMIC STUCTUREEXERCISE - level 2
30 Videos
- ATOMIC STUCTUREBOOK - NARENDRA AWASTHI ENGLISHCHAPTER - ATOMIC STUCTUREEXERCISE - Level 3 (Passage 1)
3 Videos
- CHEMICAL EQUILIBRIUMBOOK - NARENDRA AWASTHI ENGLISHCHAPTER - CHEMICAL EQUILIBRIUMEXERCISE - Match the column
1 Videos
Similar Questions
The energy density u is plotted against the distance r from the centre of a spherical charge distribution on a log-log scale. Find the magnitude of slope of obtained straight line.
View SolutionAn object is gradually moving away from the focal point of a converging lens along the axis of the lens. The graphical representation of the magnitude of linear magnification (m) versus distance of the object from the lens (x) is correctly given by : (Graphs are drawn schematically and are not to scale)
View SolutionIn a uniformly charged sphere of total charge Q and radius R, the electric field E is plotted as function of distance from the centre, The graph which would correspond to the above will be:
View SolutionA particle is projected at t=0 from a point on the ground with certain velocity at an angle with the horizontal. The power of gravitation force is plotted against time. Which of the following is the best representation?
View Solution_S01_027_Q01.png)
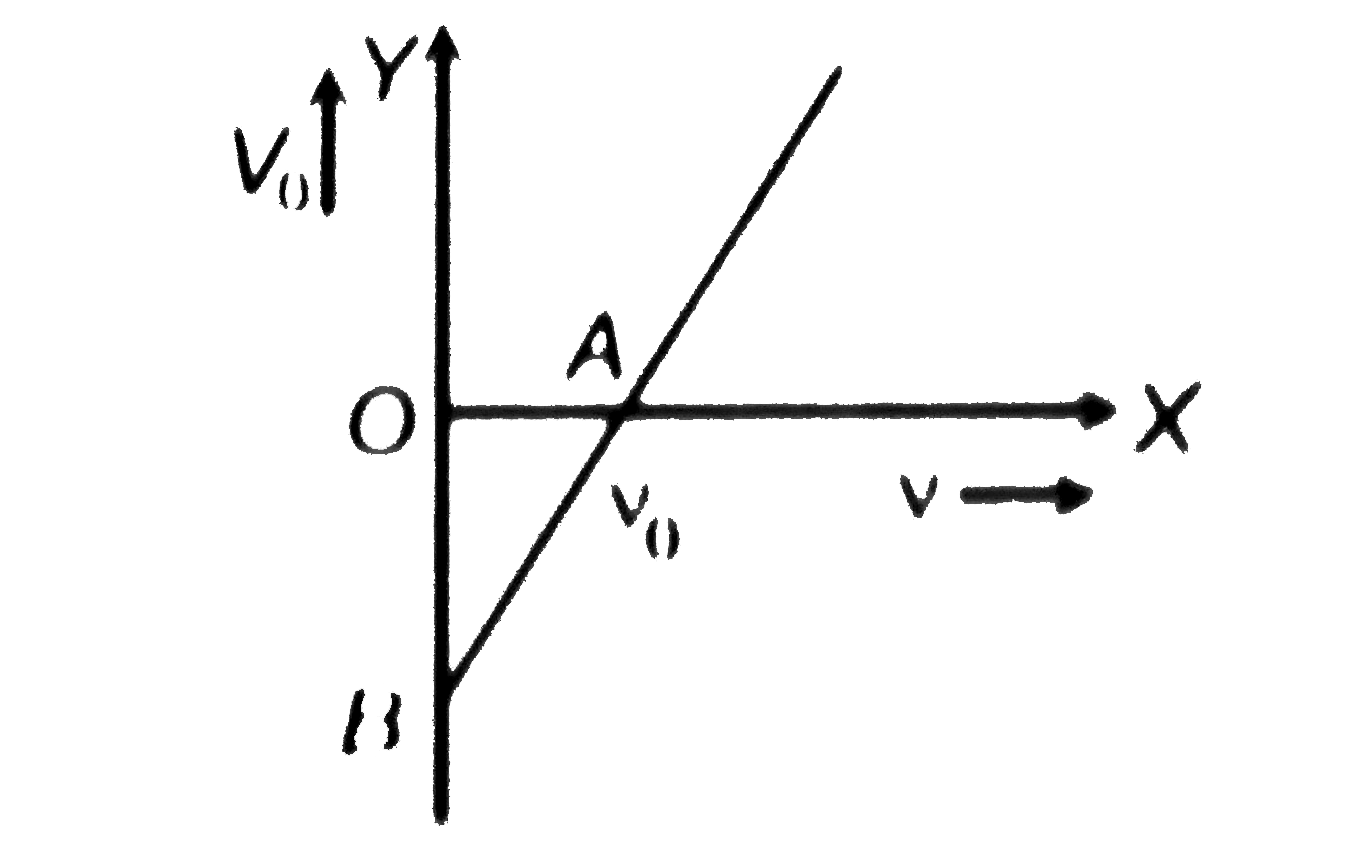
If the law of gravitation be such that the force of attraction between two particles vary inversely as the 5/2th powr of their separation then the graph of orbital velocity v0 plotted against the distance r of a satellite from the earth's centre on a log-log scale is shown alongside the slope oline will be
View SolutionA wave function for an atomic orbital is given as Ψ2,1,0 Recogine the orbital
View SolutionWhen the atomic electron is at infinite distance from the nucleus, its energy is
View SolutionIn an experiment on photoelectric effect the frequency f of the incident light is plotted against the stopping potential V0. The work function of the photoelectric surface is given by ( e is the electronic charge)

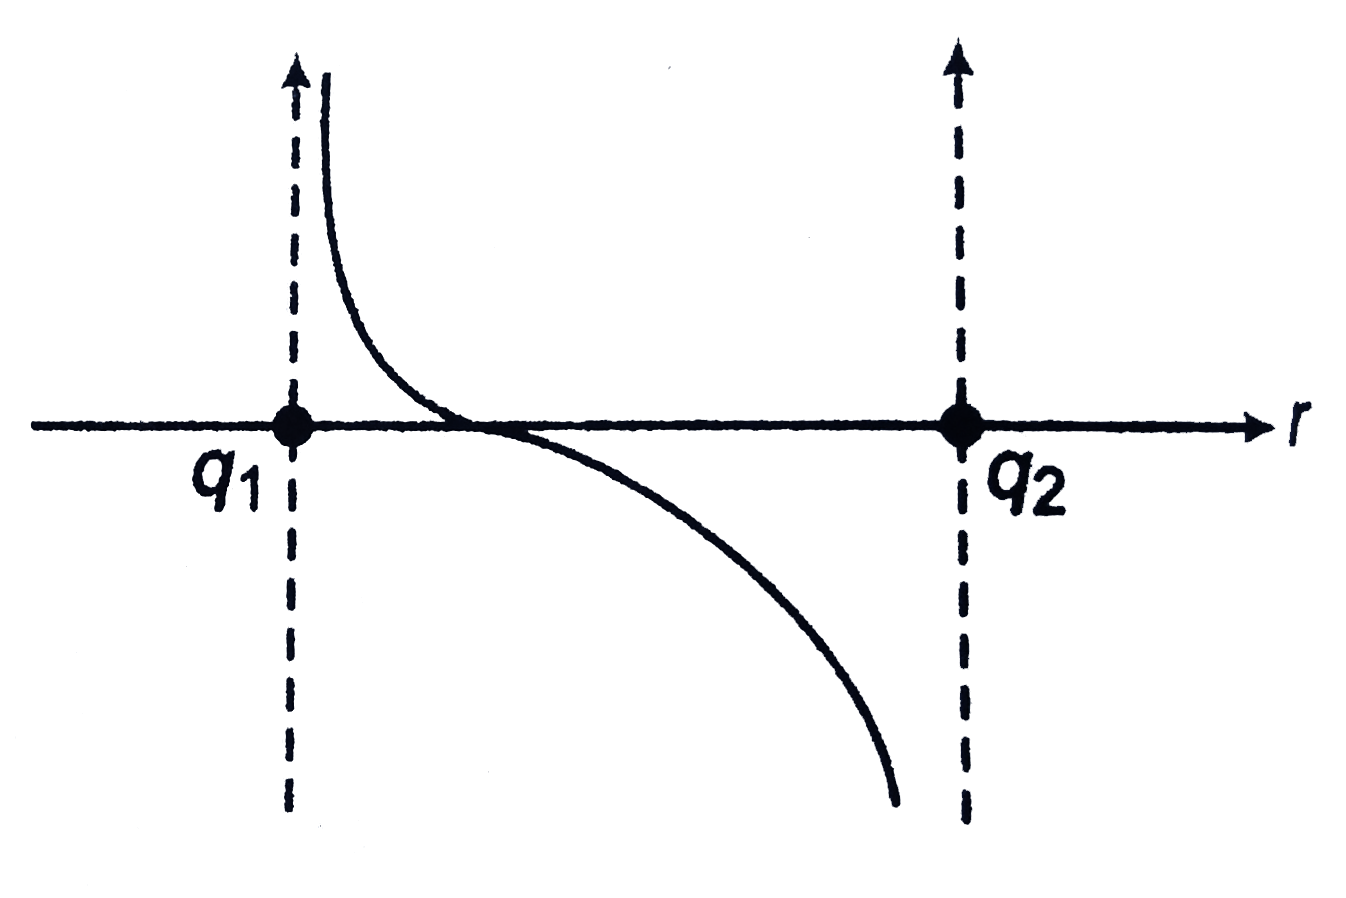
View SolutionThe variation of electric field between two charge q1 and q2 along the line joining the charges is plotted against distance from q1 (taking rightward direction of electric field as positive) as shown in the figure. Then the correct statement is

View SolutionRate of reaction (r ) is plotted against temperature (T) for an enzyme catalysed reaction. Which of the following is correct representation ?
View Solution
