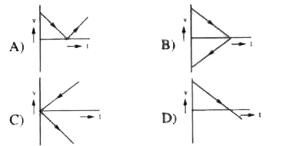
A body is thrown vertically upwards which graph represents variation of velocity w.r.t time
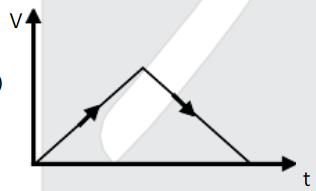
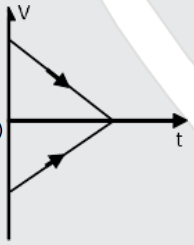
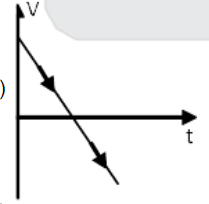
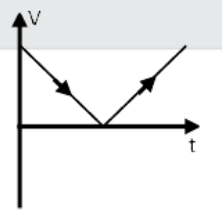
The correct Answer is:C
To solve the problem of determining the graph that represents the variation of velocity with respect to time for a body thrown vertically upwards, we can follow these steps:
Step 1: Understanding the Motion
When a body is thrown vertically upwards, it initially moves upward with a certain velocity u. As it ascends, it experiences a downward acceleration due to gravity, denoted as g. This acceleration acts in the opposite direction to the motion of the body.
Step 2: Analyzing Upward Motion
At the highest point of its trajectory, the velocity of the body becomes zero. We can use the equation of motion:
v=u+at
where:
- v is the final velocity (0 at the highest point),
- u is the initial velocity,
- a is the acceleration (which is −g during upward motion),
- t is the time taken to reach the highest point.
Setting v=0:
0=u−gt
Rearranging gives:
gt=u⇒t=ug
This means that the time taken to reach the highest point is ug.
Step 3: Sketching the Velocity-Time Graph for Upward Motion
- At t=0, the velocity is u.
- As time progresses towards t=ug, the velocity decreases linearly to 0.
This indicates that the graph will start at the point (0,u) and decrease linearly to the point (ug,0).
Step 4: Analyzing Downward Motion
Once the body reaches the highest point, it starts descending. At the highest point, the initial velocity for the downward motion is 0. As it falls, it accelerates downwards due to gravity.
Using the same equation of motion:
v=u+at
For the downward motion:
- The initial velocity u=0,
- The acceleration a=g.
Thus, the velocity increases as:
v=0+gt=gt
This means that as time progresses after reaching the highest point, the velocity becomes positive and increases linearly.
Step 5: Sketching the Velocity-Time Graph for Downward Motion
- At t=ug, the velocity is 0.
- As time increases, the velocity becomes positive and increases linearly.
Step 6: Combining Both Motions
The complete graph will consist of:
1. A line segment from (0,u) to (ug,0) for the upward motion.
2. A line segment starting from (ug,0) and increasing positively for the downward motion.
Conclusion
The graph representing the variation of velocity with respect to time for a body thrown vertically upwards will be a straight line decreasing to zero at the highest point and then a straight line increasing positively as it falls back down.
When a body is thrown vertically upwards, it initially moves upward with a certain velocity u. As it ascends, it experiences a downward acceleration due to gravity, denoted as g. This acceleration acts in the opposite direction to the motion of the body.
At the highest point of its trajectory, the velocity of the body becomes zero. We can use the equation of motion:
v=u+at
where:
- v is the final velocity (0 at the highest point),
- u is the initial velocity,
- a is the acceleration (which is −g during upward motion),
- t is the time taken to reach the highest point.
0=u−gt
Rearranging gives:
gt=u⇒t=ug
This means that the time taken to reach the highest point is ug.
- At t=0, the velocity is u.
- As time progresses towards t=ug, the velocity decreases linearly to 0.
Once the body reaches the highest point, it starts descending. At the highest point, the initial velocity for the downward motion is 0. As it falls, it accelerates downwards due to gravity.
v=u+at
For the downward motion:
- The initial velocity u=0,
- The acceleration a=g.
v=0+gt=gt
This means that as time progresses after reaching the highest point, the velocity becomes positive and increases linearly.
- At t=ug, the velocity is 0.
- As time increases, the velocity becomes positive and increases linearly.
The complete graph will consist of:
1. A line segment from (0,u) to (ug,0) for the upward motion.
2. A line segment starting from (ug,0) and increasing positively for the downward motion.
The graph representing the variation of velocity with respect to time for a body thrown vertically upwards will be a straight line decreasing to zero at the highest point and then a straight line increasing positively as it falls back down.
Topper's Solved these Questions
Similar Questions
A ball is thrown vertically upwards. Which of the following graph/graphs represent velocity-time graph of the ball during its flight (air resistance is neglected)
View SolutionA body is thrown vertically upwards with an initial velocity u. Write an expression for the maximum height attained by the body.
View SolutionA stone is allowed to fall freely from a certain Height. Neglecting air resistance, which graph represents the variation of velocity v with time t ?
View SolutionA body A is thrown vertically upwards with such a velocity that it reaches a maximum height of h. Simultaneously, another body B is dropped from height h. It strikes the ground and does not rebound. The velocity of A relative to B versus time graph is best represented by (upward direction is positive).
View SolutionA ball is thrown vertically upwards. Which of the following plots represents the speed-time graph of the ball during its height if the air resistance is ignored ?
View SolutionTwo bodies are thrown vertically upwards with their initial velocity in the ratio 2:3. Then the ratio of the maximum height attained by them is
View SolutionA ball is thrown vertically upward. What is the magnitude of velocity at the highest point ?
View SolutionA body is thrown vertically upwards with initial velocity 'u' reaches maximum height in 6 seconds. The ratio of distances travelled by the body in the first second and seventh second is
View SolutionA body is thrown vertically upward with velocity u, the greatest height h to which it will rise is,
View SolutionA body is thrown vertically upwards. Which one of the following graphs correctly represent the velocity vs time?
View Solution
