A stone is allowed to fall freely from a certain Height. Neglecting air resistance, which graph represents the variation of velocity v with time t ?
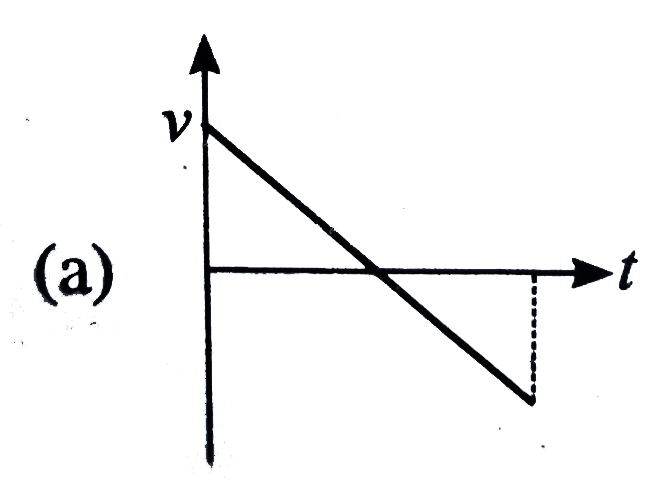
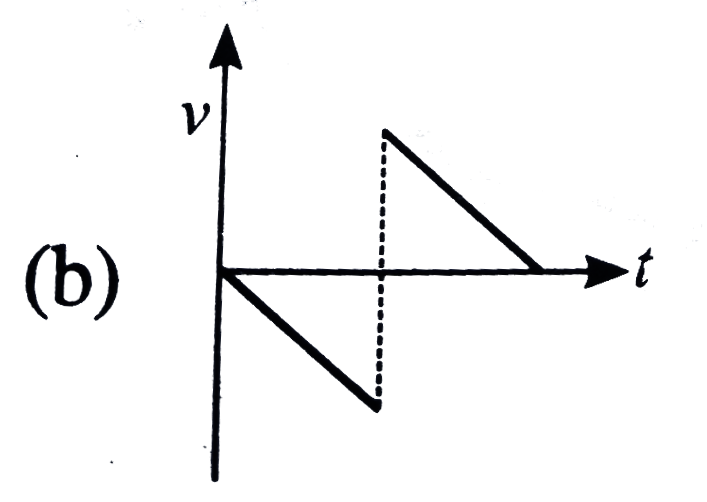
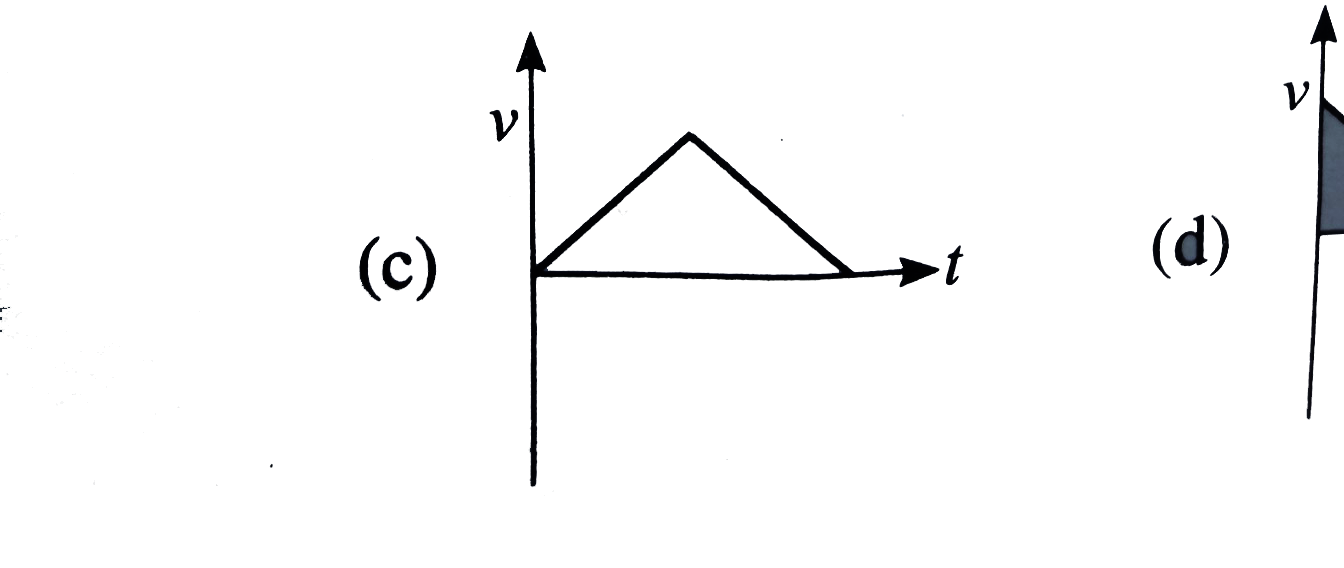
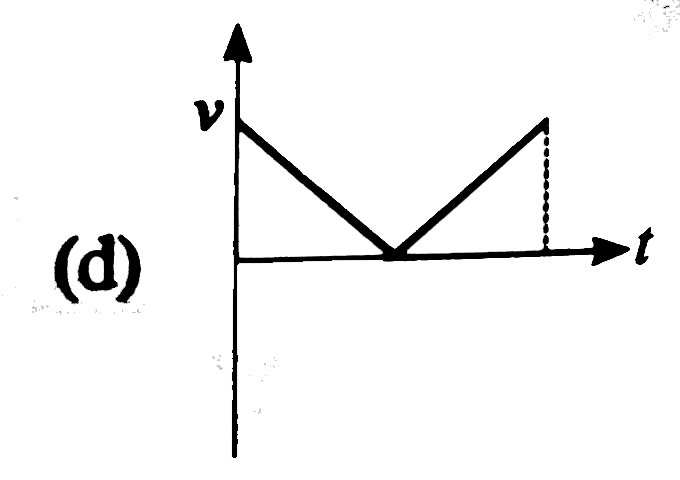
The correct Answer is:C
To solve the problem of determining the graph that represents the variation of velocity v with time t for a stone falling freely from a height, we can follow these steps:
1. Understand the Motion: The stone is falling freely under the influence of gravity. We neglect air resistance, which means the only force acting on the stone is gravity.
2. Identify Initial Conditions: When the stone is released from rest, its initial velocity u=0.
3. Use the Equation of Motion: We can use the first equation of motion, which is given by:
v=u+at
where:
- v is the final velocity,
- u is the initial velocity,
- a is the acceleration,
- t is the time.
4. Substitute Known Values: Since the initial velocity u=0 and the acceleration a is equal to the acceleration due to gravity g, we can rewrite the equation as:
v=0+gt
or simply:
v=gt
5. Analyze the Equation: The equation v=gt indicates that the velocity v increases linearly with time t. The slope of the graph will be equal to g, which is a positive constant.
6. Graph Characteristics:
- The graph starts from the origin (0,0) because the initial velocity is zero.
- As time increases, the velocity also increases, resulting in a straight line with a positive slope.
7. Select the Correct Graph: Based on the characteristics derived from the equation v=gt, the correct graph will be a straight line starting from the origin and sloping upwards, indicating that velocity increases with time.
Conclusion:
The graph that represents the variation of velocity v with time t for a stone falling freely from a height, neglecting air resistance, is a straight line passing through the origin with a positive slope.
v=u+at
where:
- v is the final velocity,
- u is the initial velocity,
- a is the acceleration,
- t is the time.
v=0+gt
or simply:
v=gt
- The graph starts from the origin (0,0) because the initial velocity is zero.
- As time increases, the velocity also increases, resulting in a straight line with a positive slope.
The graph that represents the variation of velocity v with time t for a stone falling freely from a height, neglecting air resistance, is a straight line passing through the origin with a positive slope.
Topper's Solved these Questions
- CENGAGE PHYSICS DPPBOOK - CENGAGE PHYSICS ENGLISHCHAPTER - CENGAGE PHYSICS DPPEXERCISE - subjective type
51 Videos
- CENGAGE PHYSICS DPPBOOK - CENGAGE PHYSICS ENGLISHCHAPTER - CENGAGE PHYSICS DPPEXERCISE - Multiple correct Answer Type
54 Videos
- CAPACITOR AND CAPACITANCEBOOK - CENGAGE PHYSICS ENGLISHCHAPTER - CAPACITOR AND CAPACITANCEEXERCISE - Integer
5 Videos
- COULOMB LAW AND ELECTRIC FIELDBOOK - CENGAGE PHYSICS ENGLISHCHAPTER - COULOMB LAW AND ELECTRIC FIELDEXERCISE - Single Answer Correct Type
22 Videos
Similar Questions
A body is thrown vertically upwards which graph represents variation of velocity w.r.t time
View SolutionWhich of the following graph represents the variation of resistivity (ρ) with temperature (T) for copper?
View SolutionThe velocity v of a particle moving along x - axis varies with ist position (x) as v=α√x, where α is a constant. Which of the following graph represents the variation of its acceleration (a) with time (t)?
View SolutionThe graph shown the variation with times t of the velocity v of an object . Which one of the following graphs best represents the variation of acceleration a of the object with time t?

View SolutionWhich of the following graph(s) represent retardation ? [v : velocity, t : time, x : position]
View SolutionA constant potential difference is applied across a resistance. Consider variation of resistance with temperature. Which graph represents best the variation of power produced in resistance versus resistance?
View SolutionA ball falls freely from rest. The ratio of the distance travelled in first, second, third and fourth second is
View SolutionA ball is dropped from the top of a tower of height (h). It covers a distance of h/2 in the last second of its motion. How long does the ball remain in air?
View SolutionThe acceleration (a)-time(t) graph for a particle moving along a straight from rest is shown in figure. Which of the following graph is the best representation of its velocity (v) with time (t) ?
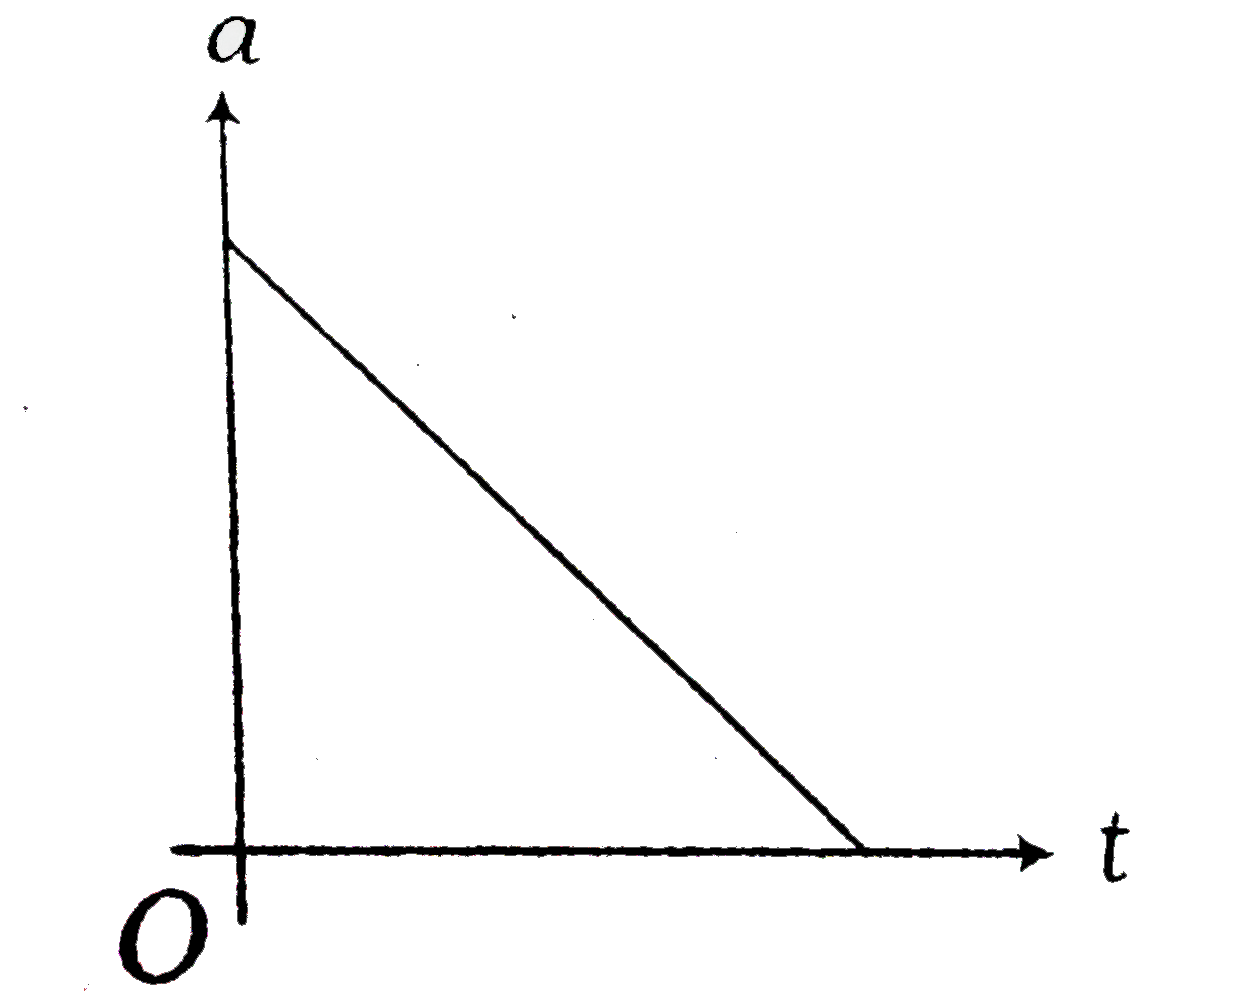
View SolutionThe acceleration (a)-time(t) graph for a particle moving along a straight from rest is shown in figur. Which of the following graph is the best representation of its velocity (v) with time (t) ?

View Solution
