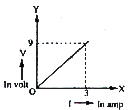
The variation of current and voltage in a conductor has been shown in figure. The resistance of the conductor is
4Ω
2Ω
3Ω
1Ω
The correct Answer is:C
Topper's Solved these Questions
- CURRENT ELECTRICITYBOOK - AAKASH SERIESCHAPTER - CURRENT ELECTRICITYEXERCISE - LECTURE SHEET (EXERCISE- II LEVEL- II (ADVANCED) (Straight Objective Type Questions))
11 Videos
- CURRENT ELECTRICITYBOOK - AAKASH SERIESCHAPTER - CURRENT ELECTRICITYEXERCISE - LECTURE SHEET (EXERCISE- II LEVEL- II (ADVANCED) (Linked Comprehension Type Questions))
2 Videos
- CURRENT ELECTRICITYBOOK - AAKASH SERIESCHAPTER - CURRENT ELECTRICITYEXERCISE - LECTURE SHEET (EXERCISE-I LEVEL- II (ADVANCED) (More than one correct answer type Questions))
3 Videos
- CURRENT ELECTRICITYBOOK - AAKASH SERIESCHAPTER - CURRENT ELECTRICITYEXERCISE - PROBLEMS (LEVEL-II)
26 Videos
- DUAL NATURE OF RADIATION AND MATTERBOOK - AAKASH SERIESCHAPTER - DUAL NATURE OF RADIATION AND MATTEREXERCISE - PRACTICE EXERCISEX
44 Videos
Similar Questions
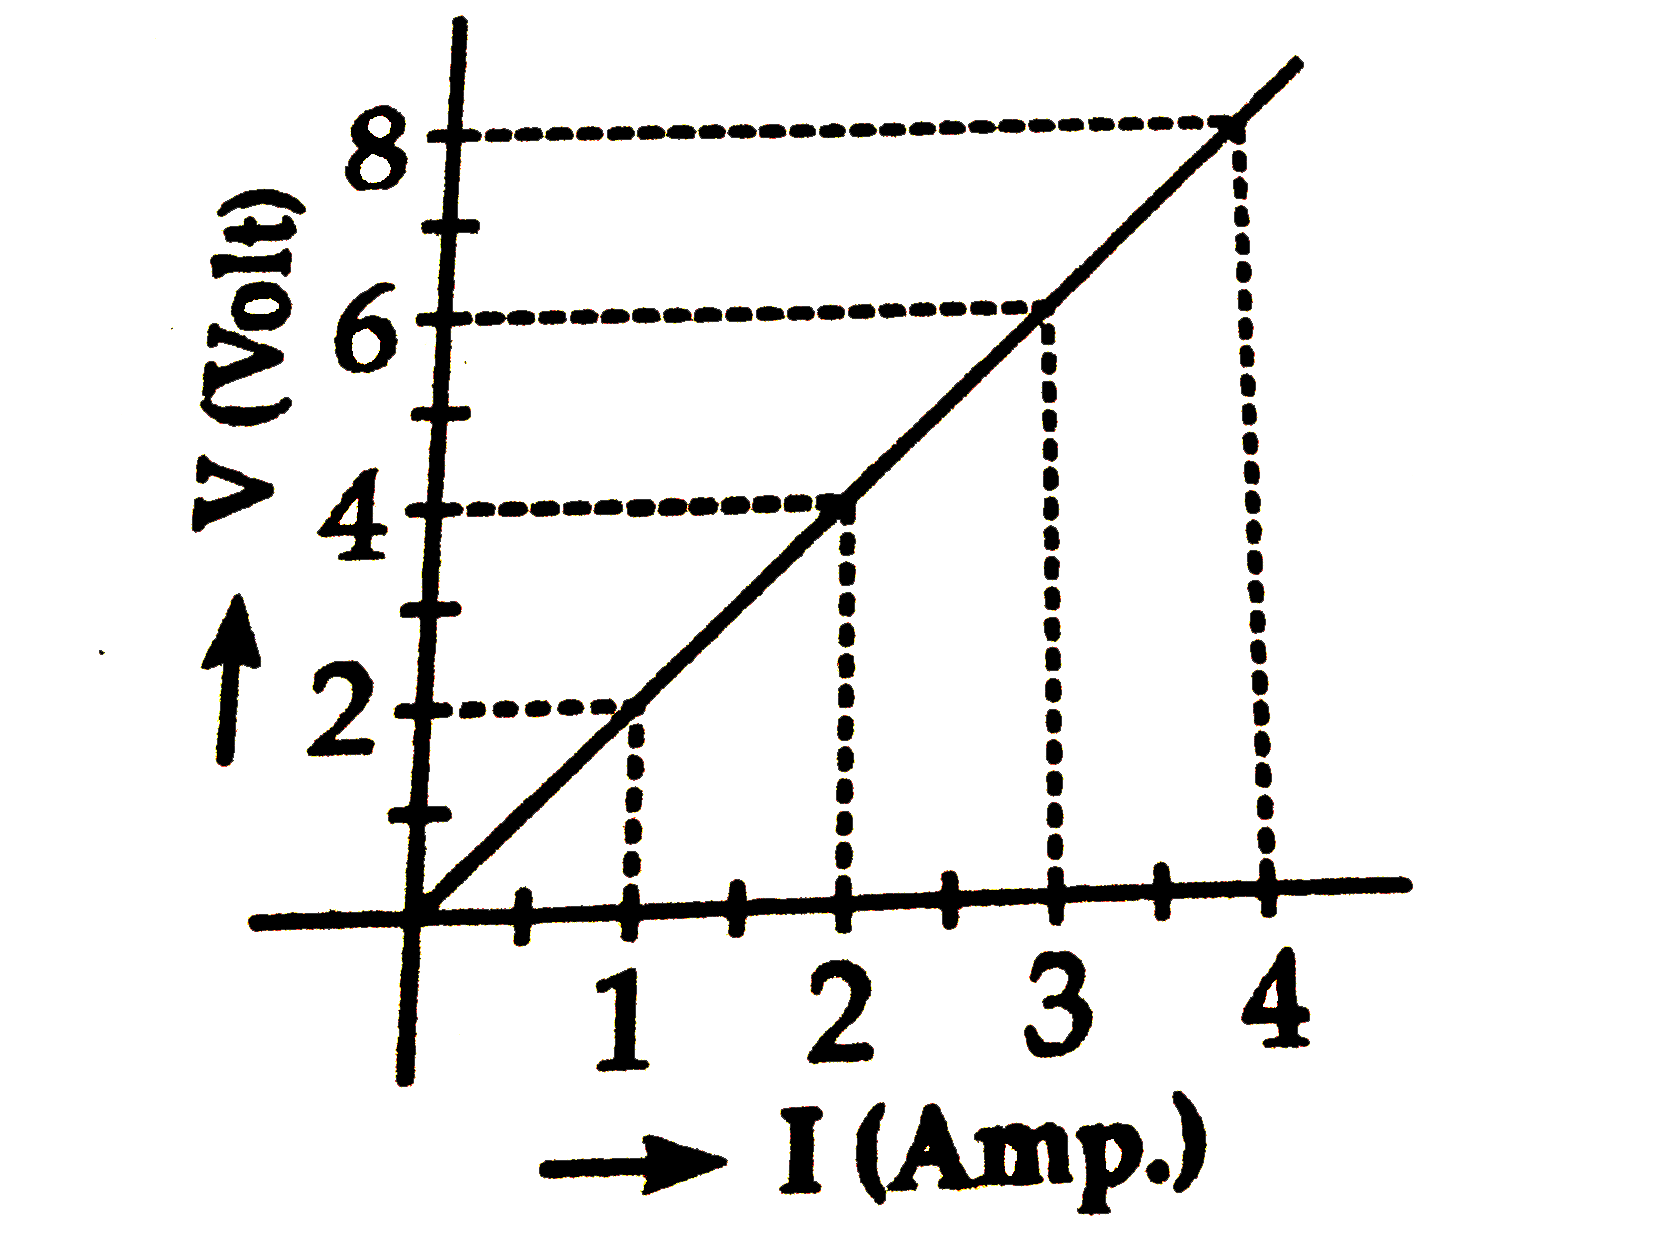
Variation of current and voltage in a conductor is shown in the adjoining figure. The resistance of the conductor is
View SolutionRelation between current in a conductor and time is shown in fig.

If the resistance of the conductor is R, then the total heat disspipated across resistance R is
View Solution
Knowledge Check
Variation of current and voltage in a conductor has been shown in the diagram below. The resistance of the conductor is.
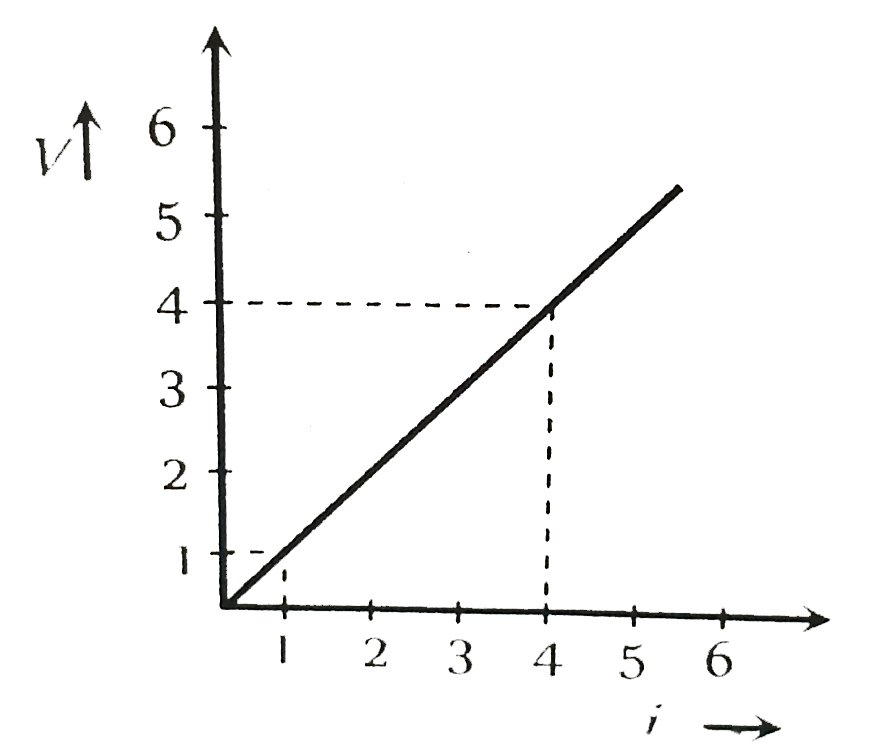 A4 ohmB2 ohmC3 ohmD1 ohm
Relation between current in a conductor and time is shown in fig.

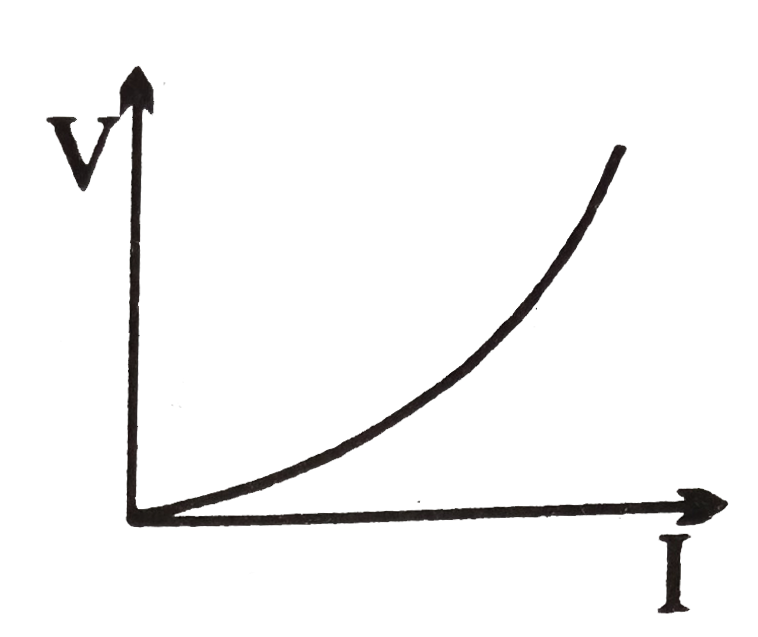
If the resistance of the conductor is R, then the total heat disspipated across resistance R isAi20Rt02Bi20Rt04Ci20Rt03Di20Rt0The variation of current (I) and voltage (V) is as shown in figure A. The variation of power P with current I is best shown by which of the following graph
 A
A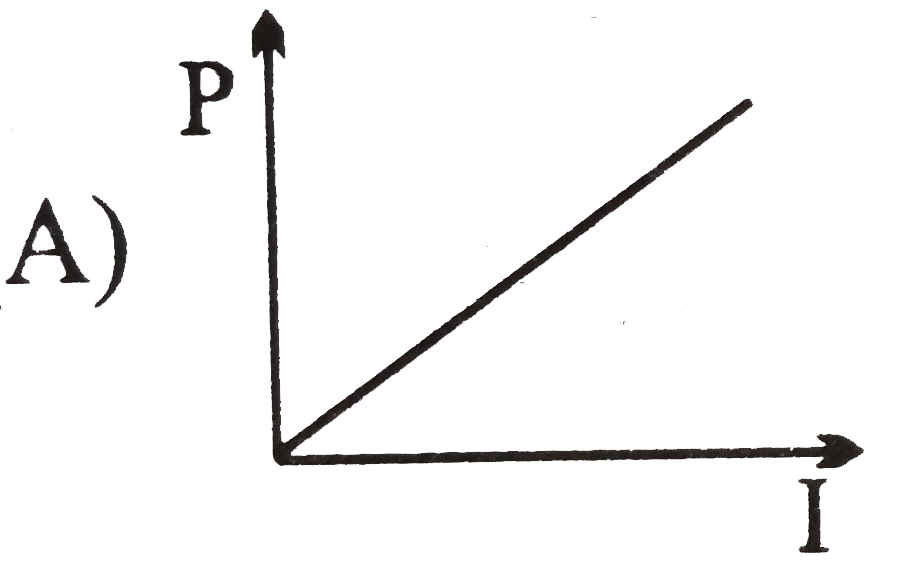 B
B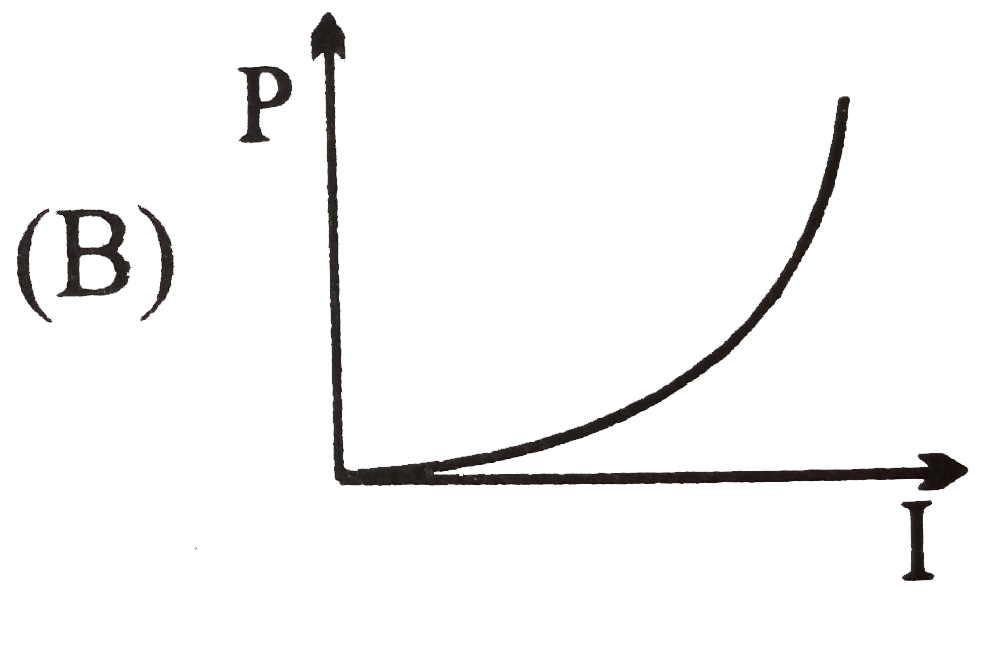 C
C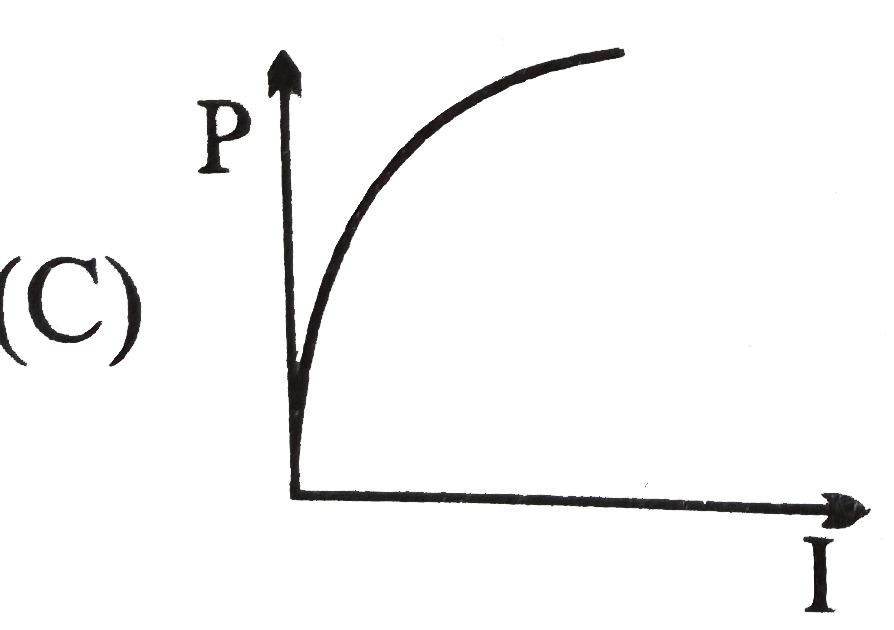 D
D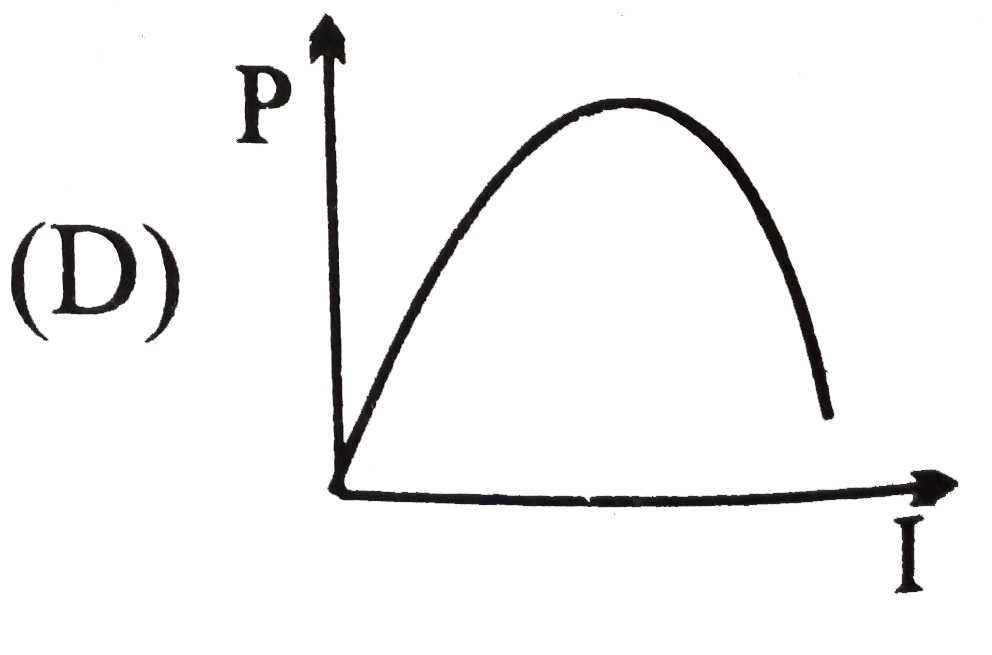
The variation of current (I) and voltage (V) is as shown in figure A. The variation of power P with current I is best shown by which of the following graph

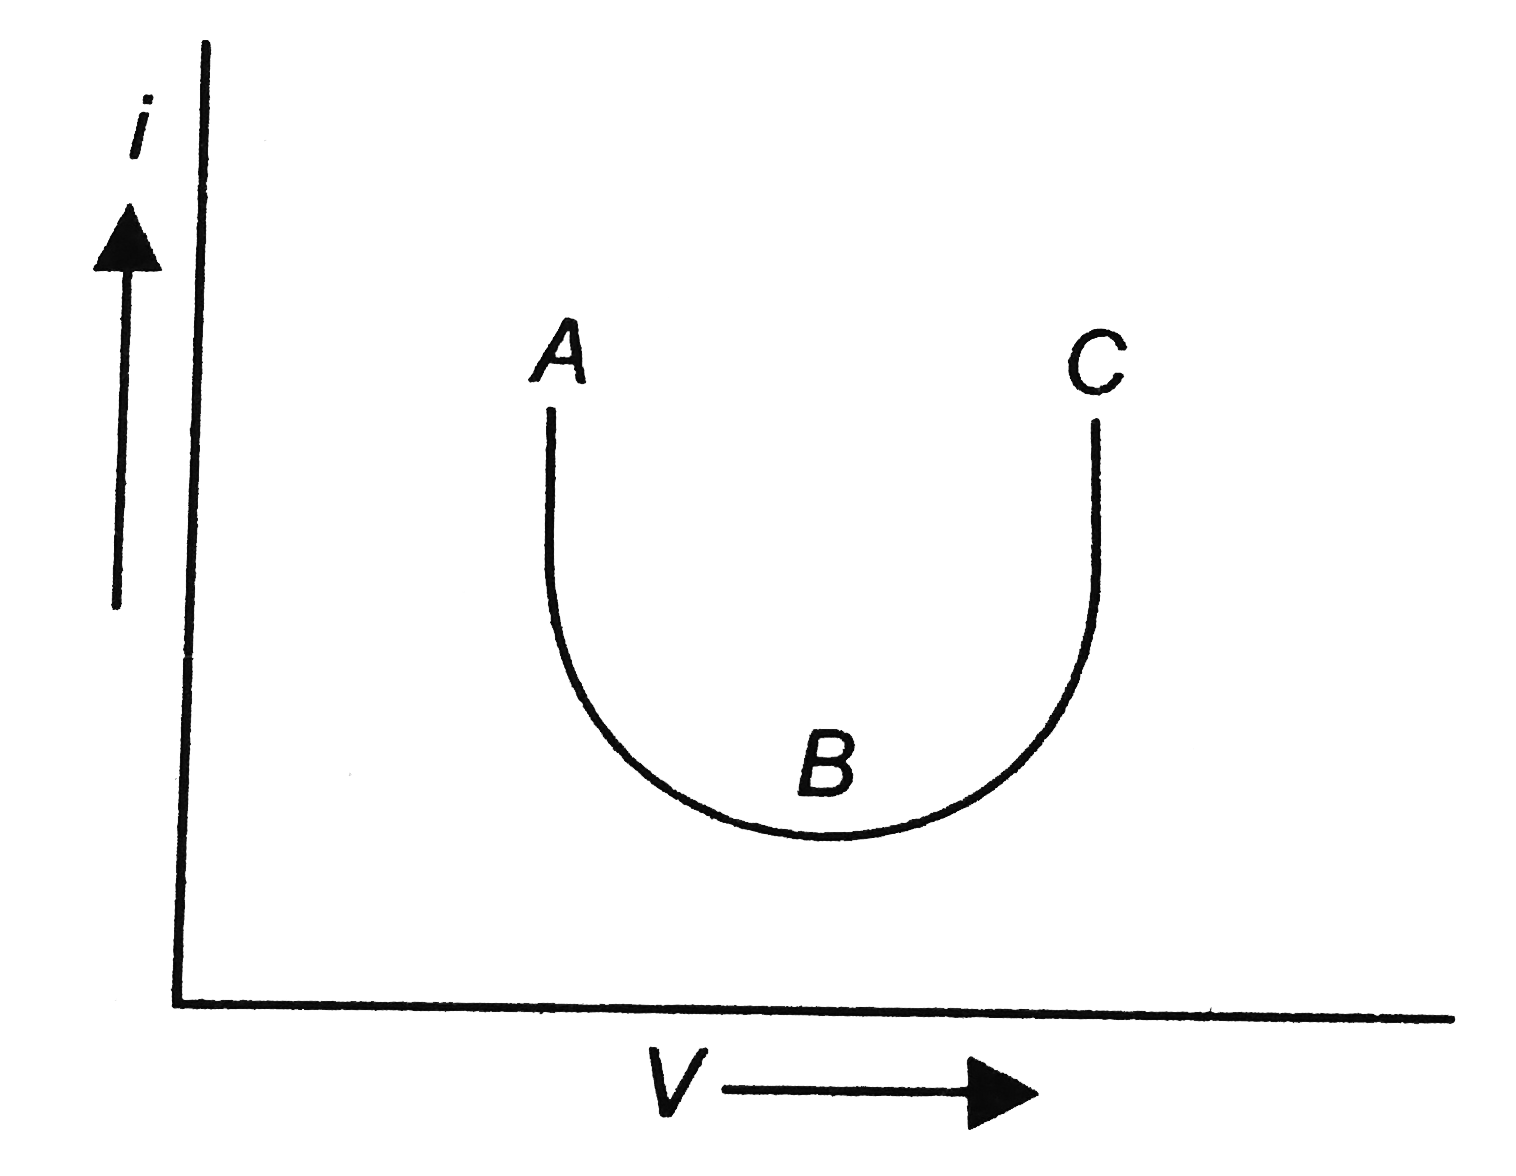
View SolutionThe current-voltage graph of a device is shown in figure. The resistance is negative in region.
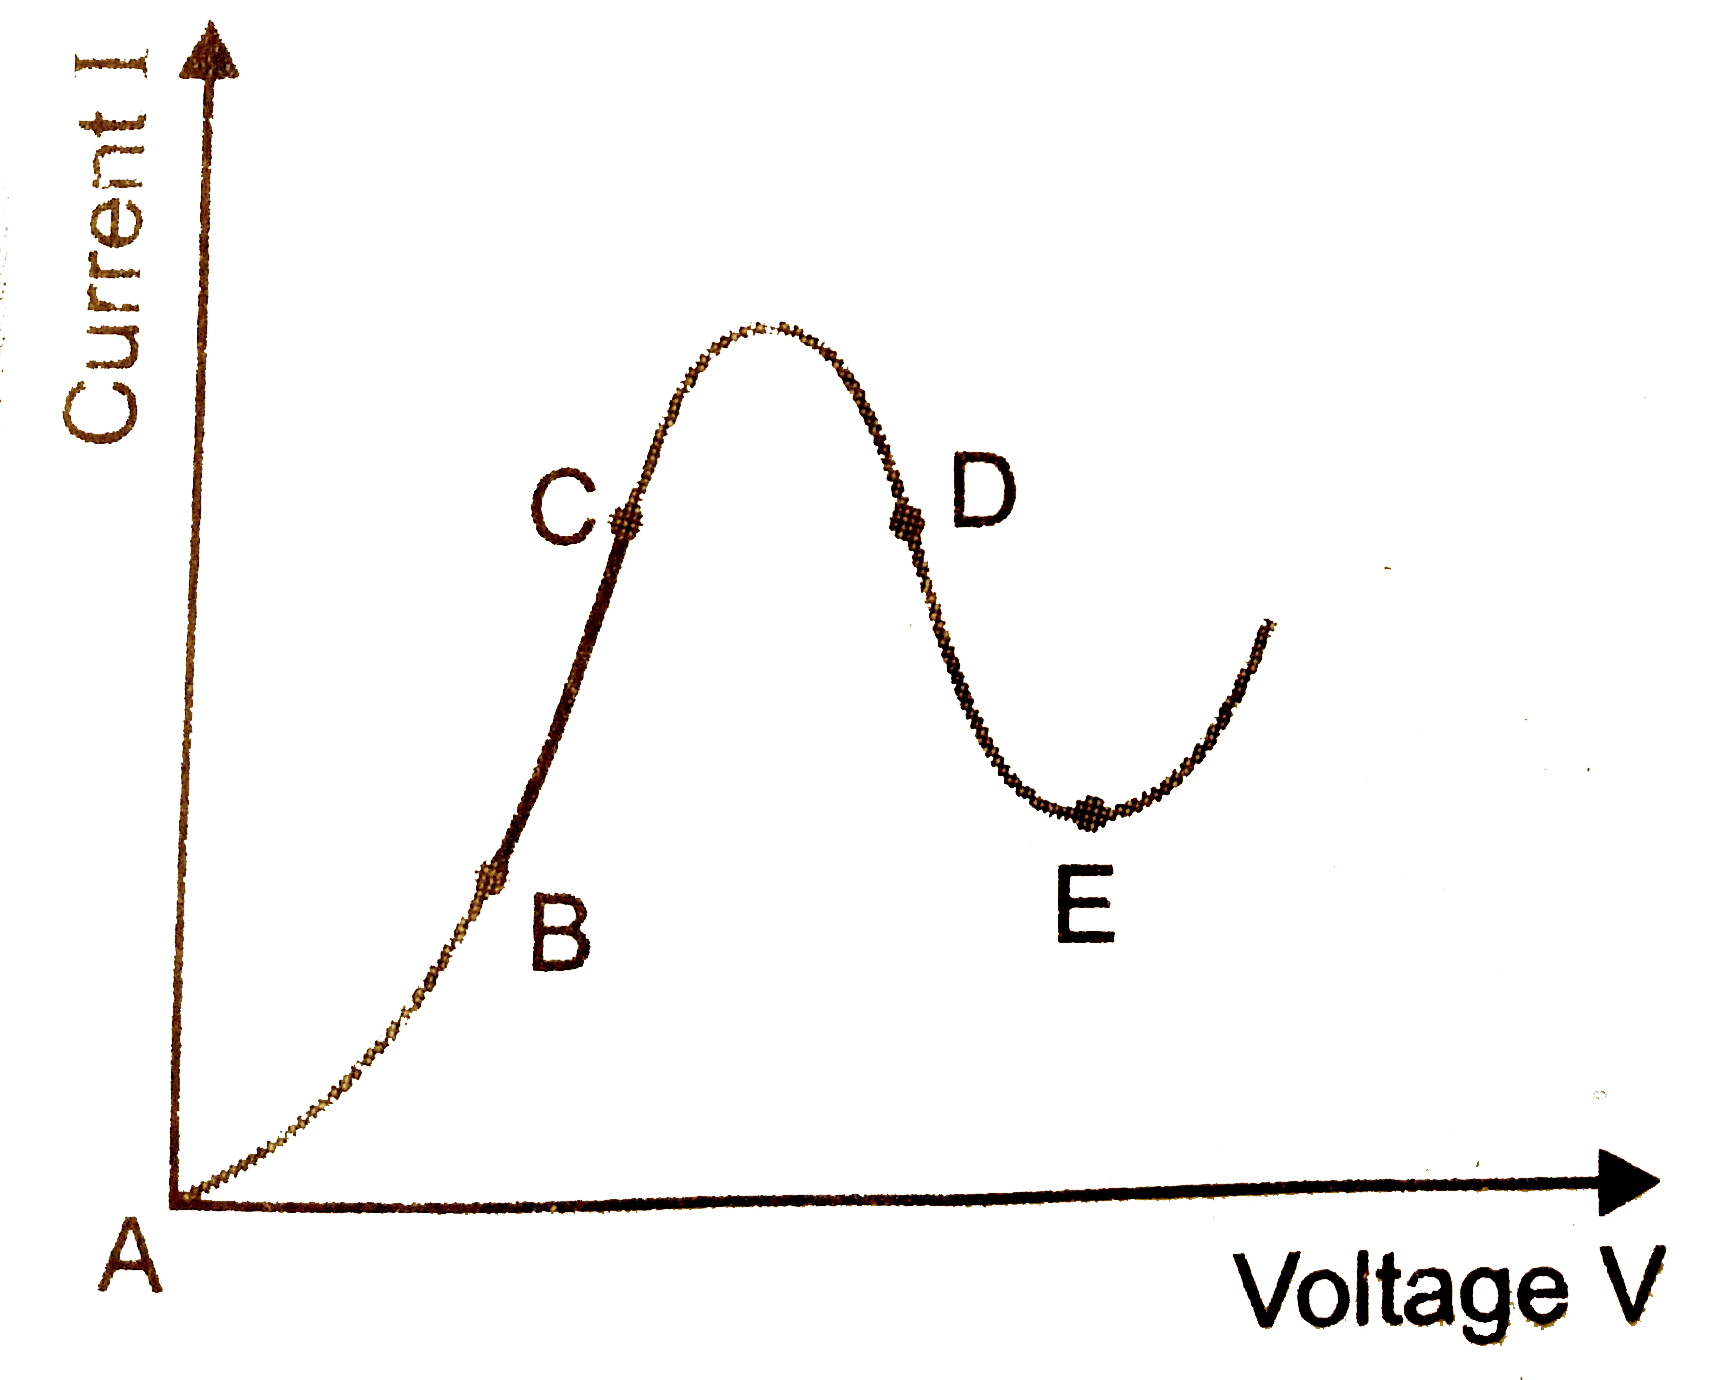
View SolutionGraph showing the variation of current versus voltage for a material GaAs is shown in figure. Identify the region of (i) negative resistance (ii) where Ohm's law is obeyed.
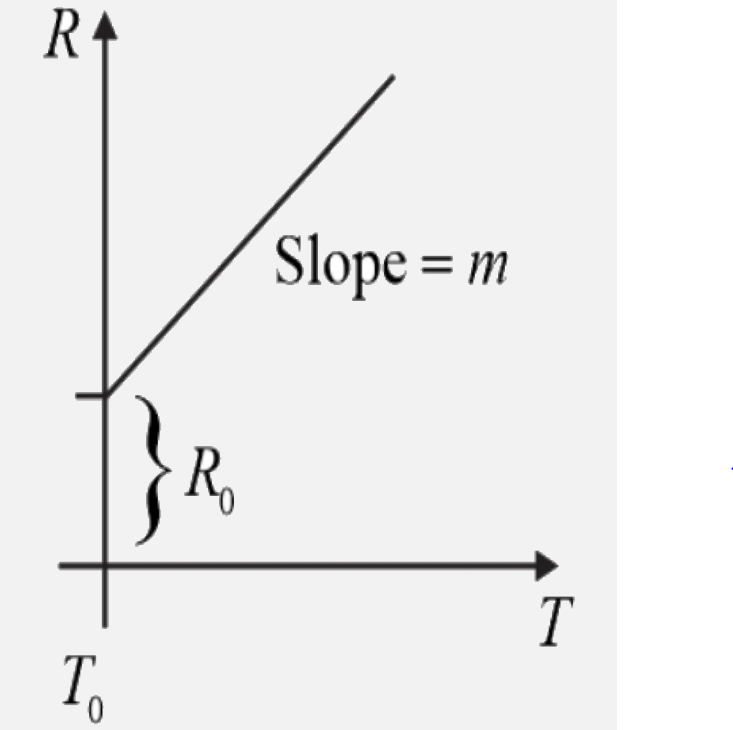
View SolutionVariation of resistance of the conductor with temperature is shown . Temperature coefficient of the conductor is
View SolutionThe current-voltage graph of a device is shown in figure. The resistance is negative in region.

View Solution
