The current-voltage graph of a device is shown in figure. The resistance is negative in region.
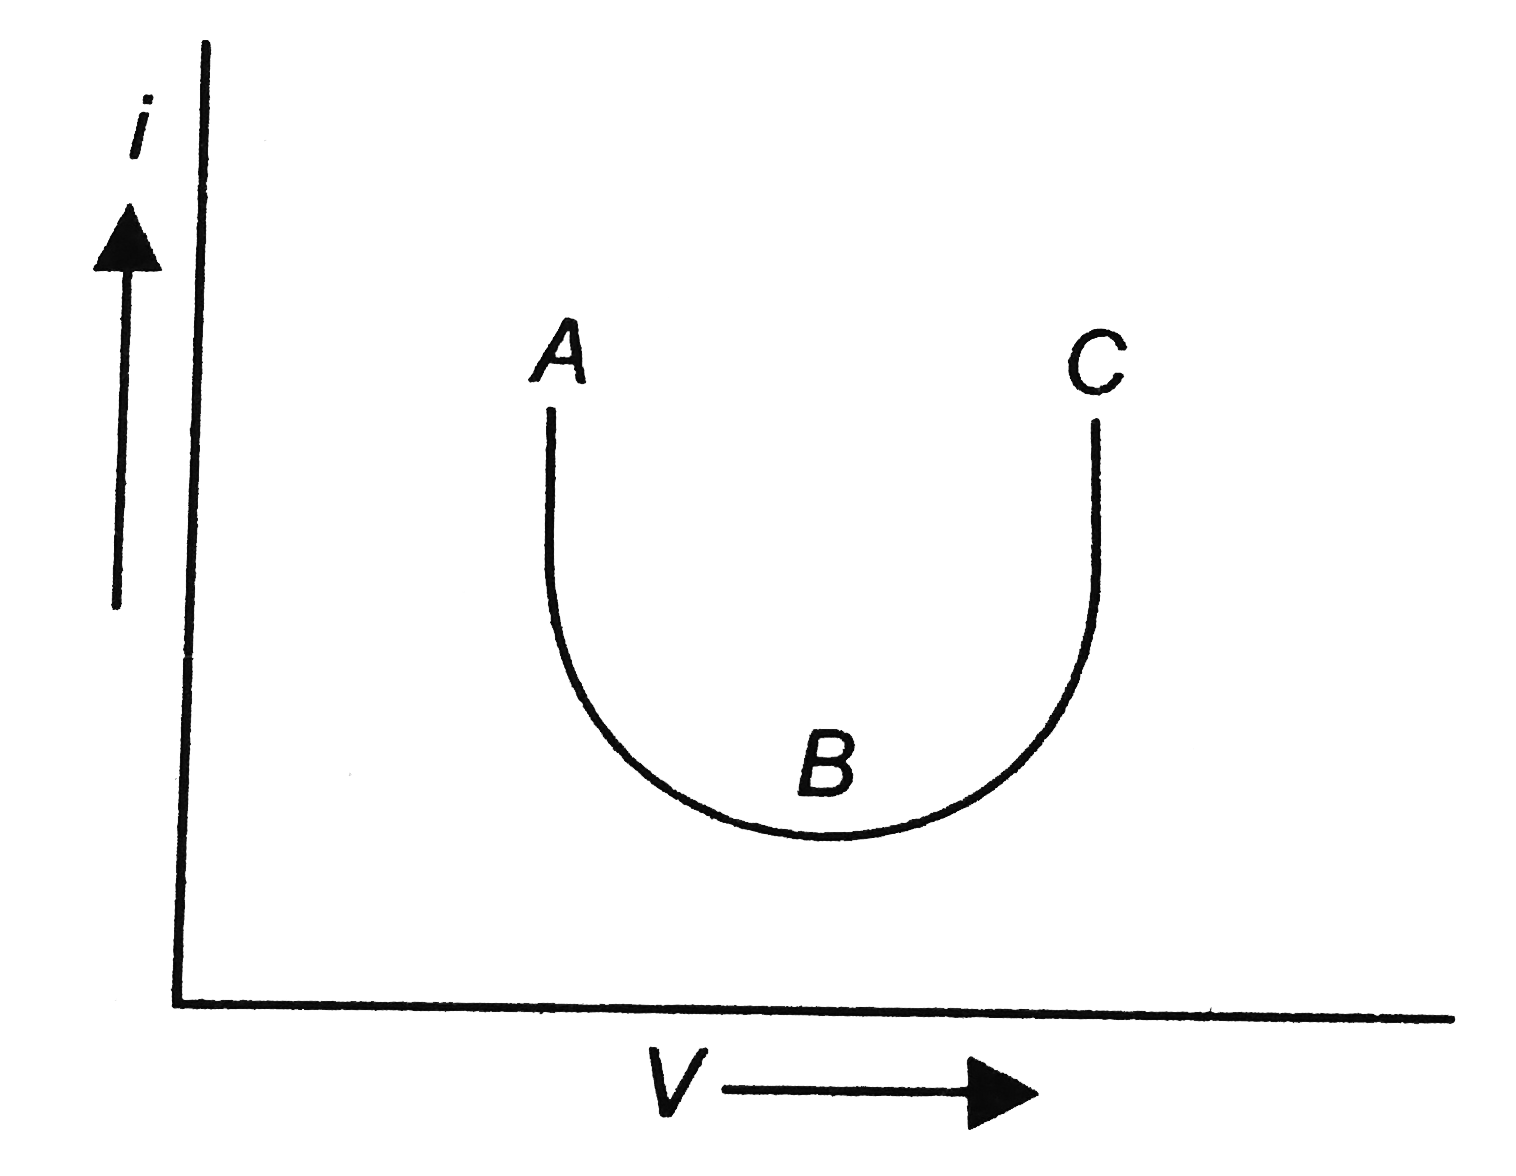
AB
BC
ABC
None of these
The correct Answer is:A
Step by step video & image solution for The current-voltage graph of a device is shown in figure. The resistance is negative in region. by Physics experts to help you in doubts & scoring excellent marks in Class 12 exams.
Updated on:21/07/2023Similar Questions
Knowledge Check
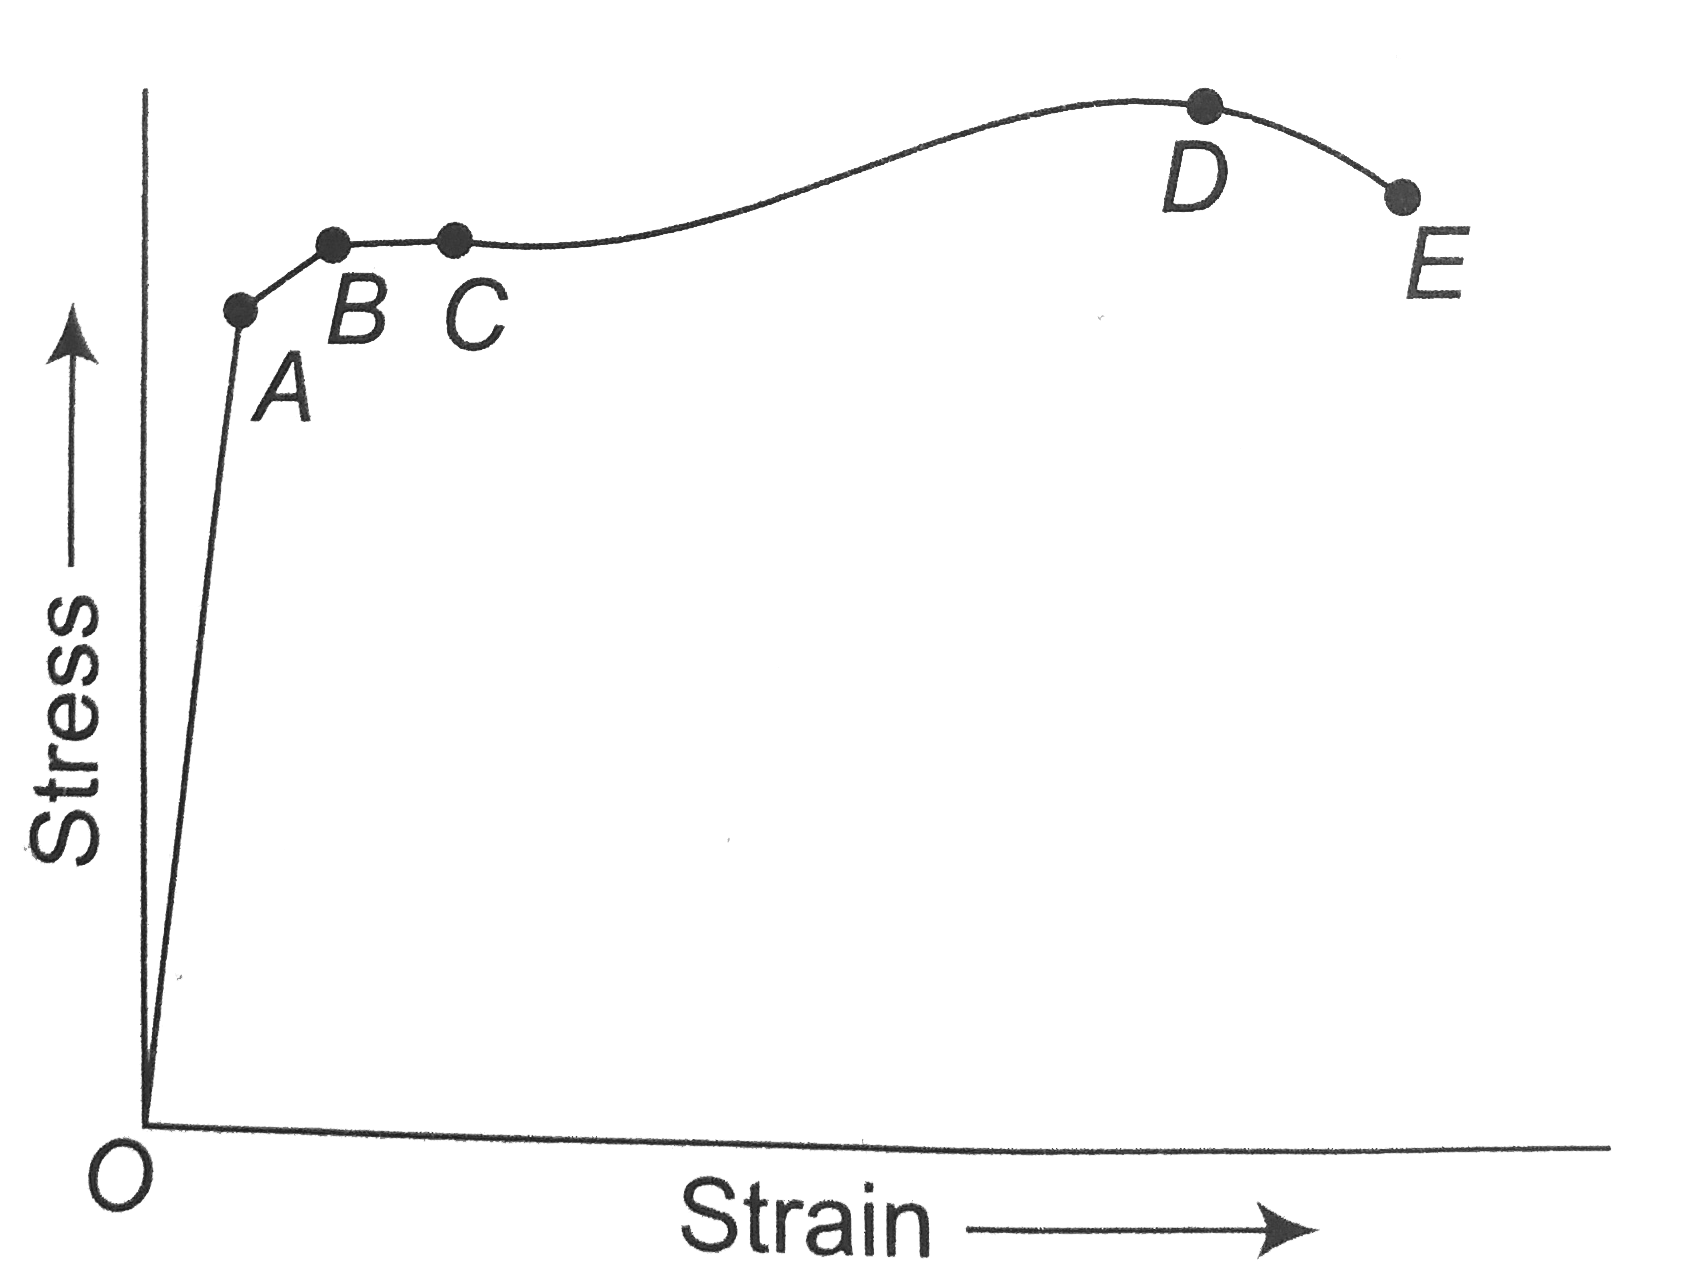
The stress strain graph for a metal wire is as shown in the figure. In the graph, the region in which Hooke's law is obeyed, the ultimate strength and fracture are represented byAOA, C, DBOB, D, ECÂ OA, D, EDOB, C, D
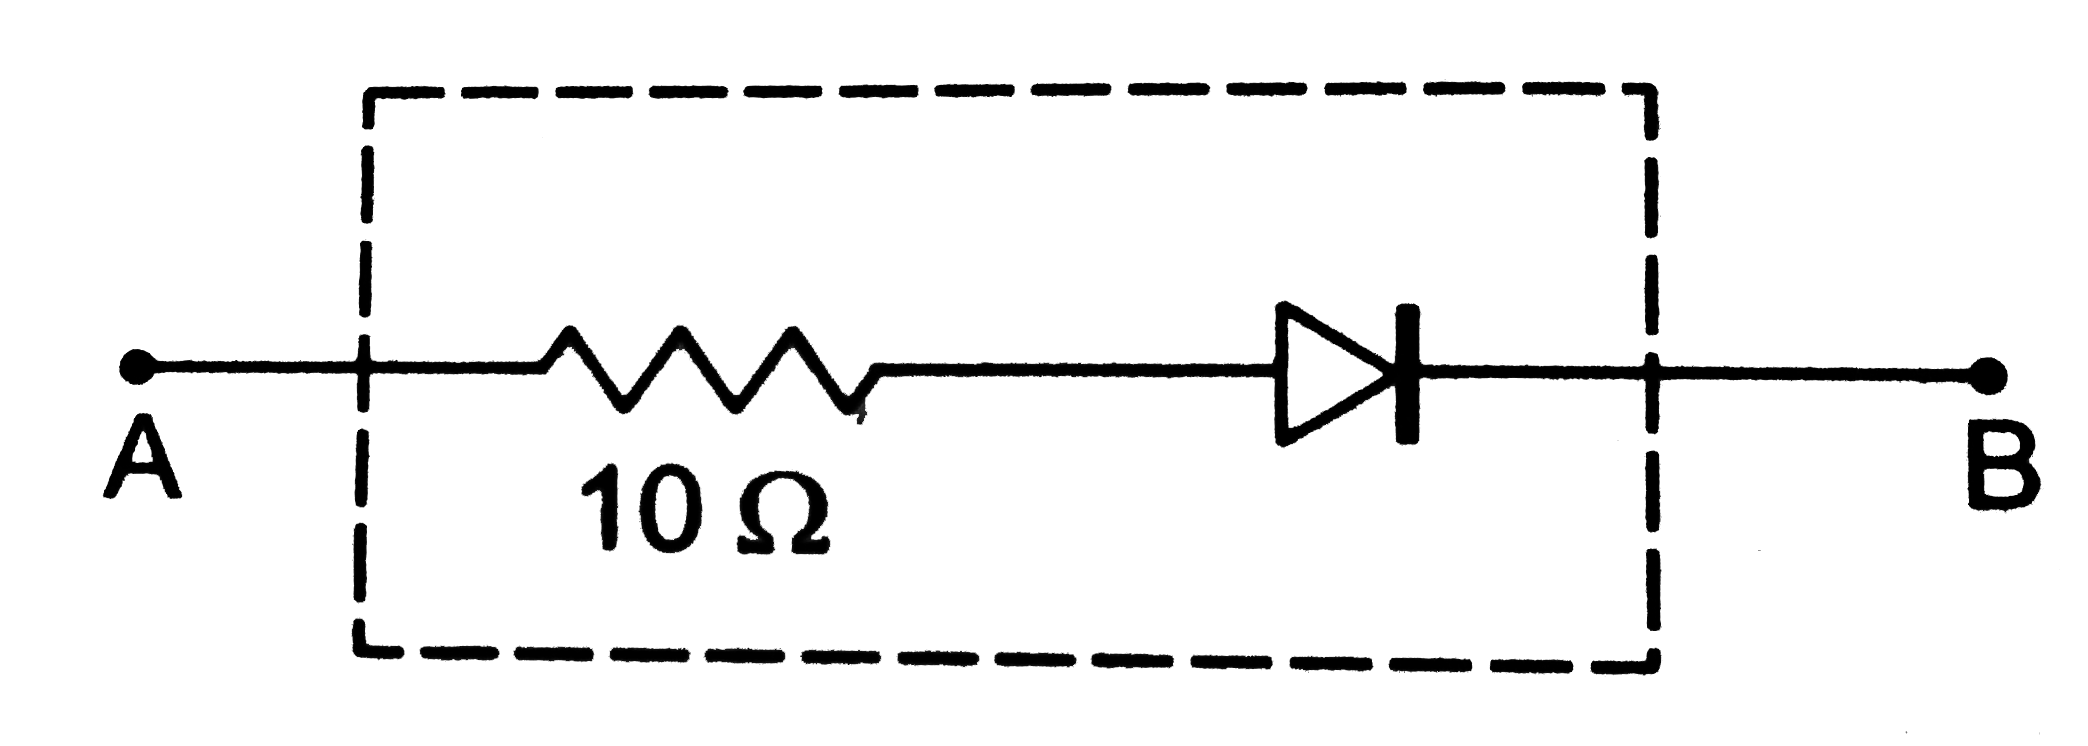
Draw the current-voltage characteristics for the device shown in figure between the terminal A and B.

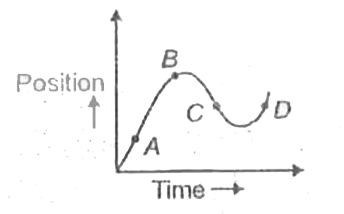
View SolutionThe position- time graph of a moving particle is shown. The instantaneous velocity of the particle is negative at the point
View SolutionAssertion : In the s-t graph as shown in figure, velocity of particle is negative and acceleration is positive.
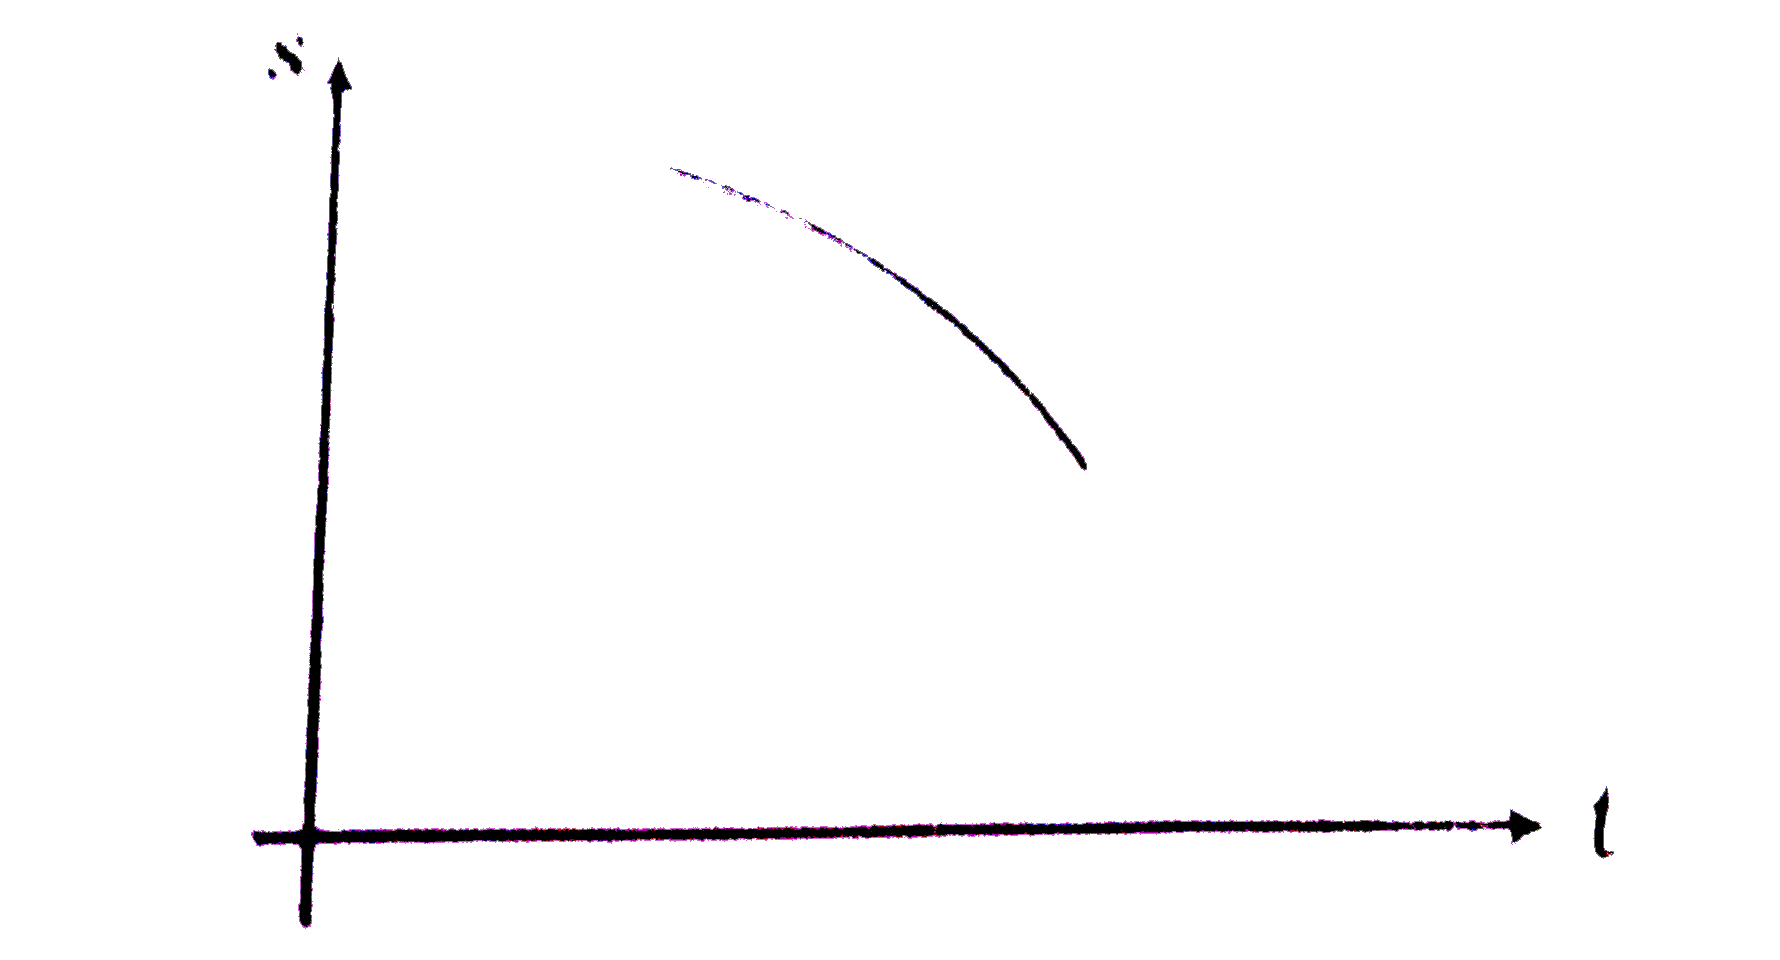
Reason : Slope of s-t graph is negative and increasing in magnitude.
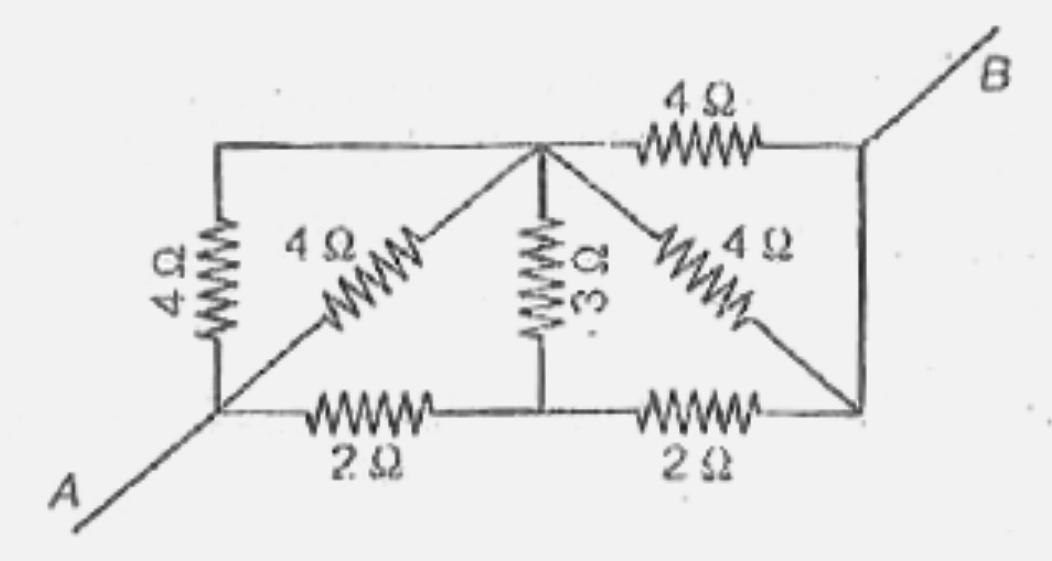
View SolutionResistance across AB as shown in figure is
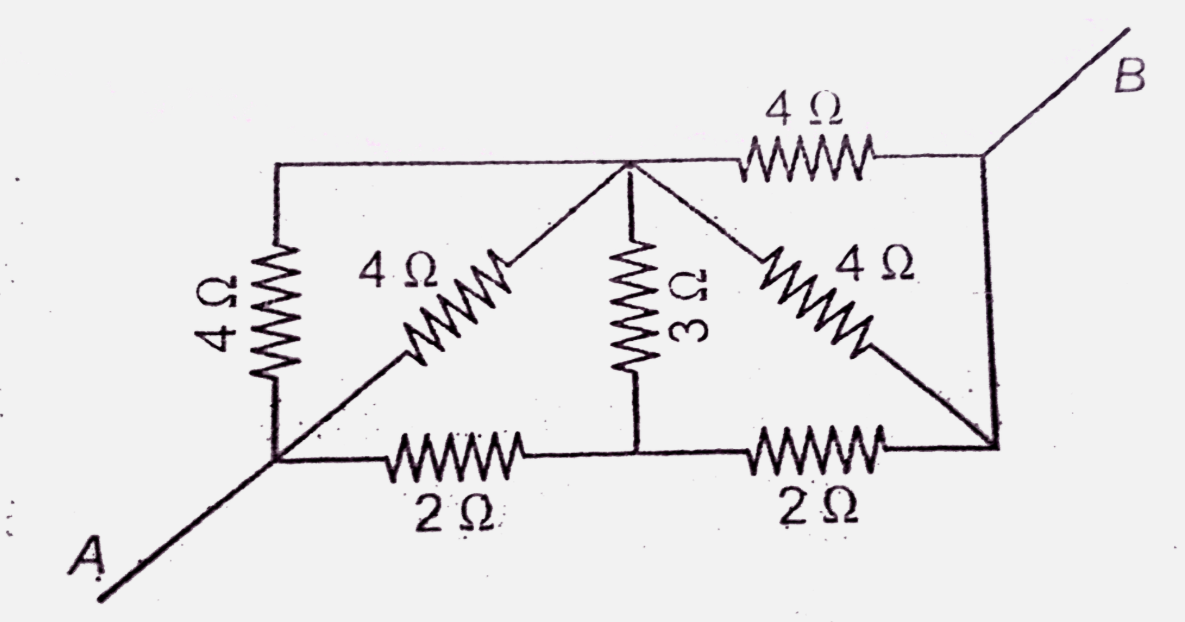
View SolutionResistance across AB as shown in figure is
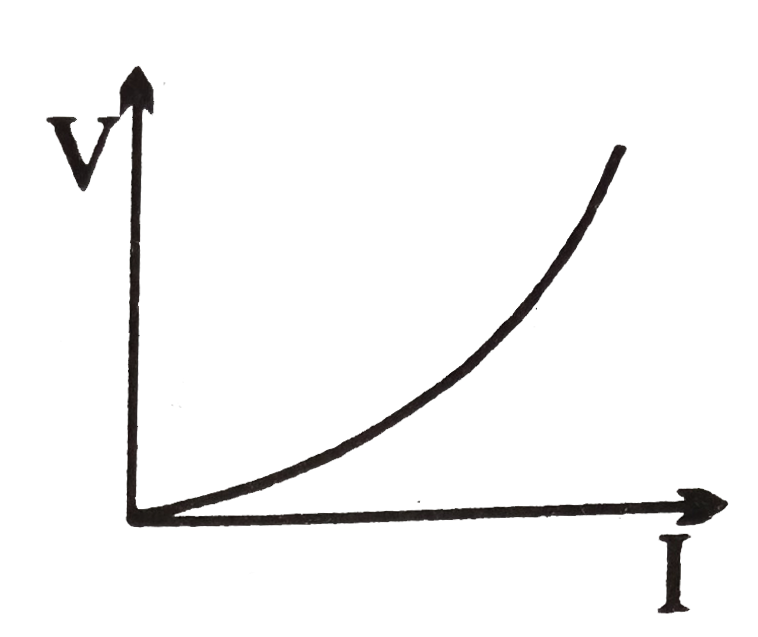
View SolutionThe variation of current (I) and voltage (V) is as shown in figure A. The variation of power P with current I is best shown by which of the following graph
View Solution(a) Draw graph showing the variation of current versus voltage in an electroyte when an external resistance is also connceted.
(b) (i) The graph between resistance (R ) and temperature (T) for Hg is shown in the figure (a). Explain the behaviour of Hg near 4k.
(ii) In which region of the graph shown in the figure (b) is the resistance negative and why?

View Solution

