For a simple pendulum graph between L and will be a
Rectangular hyperbola
parabola
St line passing through origin
A st line having a + ve y - intercept
The correct Answer is:C
Topper's Solved these Questions
- OSCILLATIONSBOOK - AAKASH SERIESCHAPTER - OSCILLATIONSEXERCISE - EXERCISE II
175 Videos
- OSCILLATIONSBOOK - AAKASH SERIESCHAPTER - OSCILLATIONSEXERCISE - Practice exercise
140 Videos
- OSCILLATIONSBOOK - AAKASH SERIESCHAPTER - OSCILLATIONSEXERCISE - PROBLEM
249 Videos
- OSCILLATIONBOOK - AAKASH SERIESCHAPTER - OSCILLATIONEXERCISE - QUESTIONS FOR DESCRIPTIVE ANSWERS
12 Videos
- PHYSICAL WORLDBOOK - AAKASH SERIESCHAPTER - PHYSICAL WORLDEXERCISE - VERY SHORT ANSWER TYPE QUESTIONS
5 Videos
Similar Questions
Knowledge Check
The graph between L and T2 is
A B
B C
C D
D
The graph between L and T2 is
A B
B C
C D
D
Assertion : For a simple pendlume the graph between ans T2 is hyperbola
Reason : T=2π√g1AIf both assertion and reason are true and the reasopn is correct explanation of the assertionBIf both assertion and reason are true and but not the correct explanation of assertionCIf assertion is true but the reason is falseDIf both assertion and reason are false
For a simple pendulum, the graph between T2andL (where T is the time period & Lis the length) is
View SolutionFor a simple pendulum the graph between length and time period will be
View SolutionWhile determining the value of g using simple pendulum, we plot a graph between l and T2 which is
View SolutionIn an experiment , to find the loss of energy with respect to time in case of swinging simple pendulum , the graph between (amplitude)2 and time is
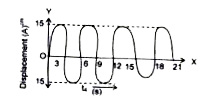
View SolutionIn the case of a simple pendulum, a graph is drawn between the displacement and time taken for its oscillations as shown in the figure. Then

The amplitude of oscillation of the pendulum bob is _____ cm.
View Solution
