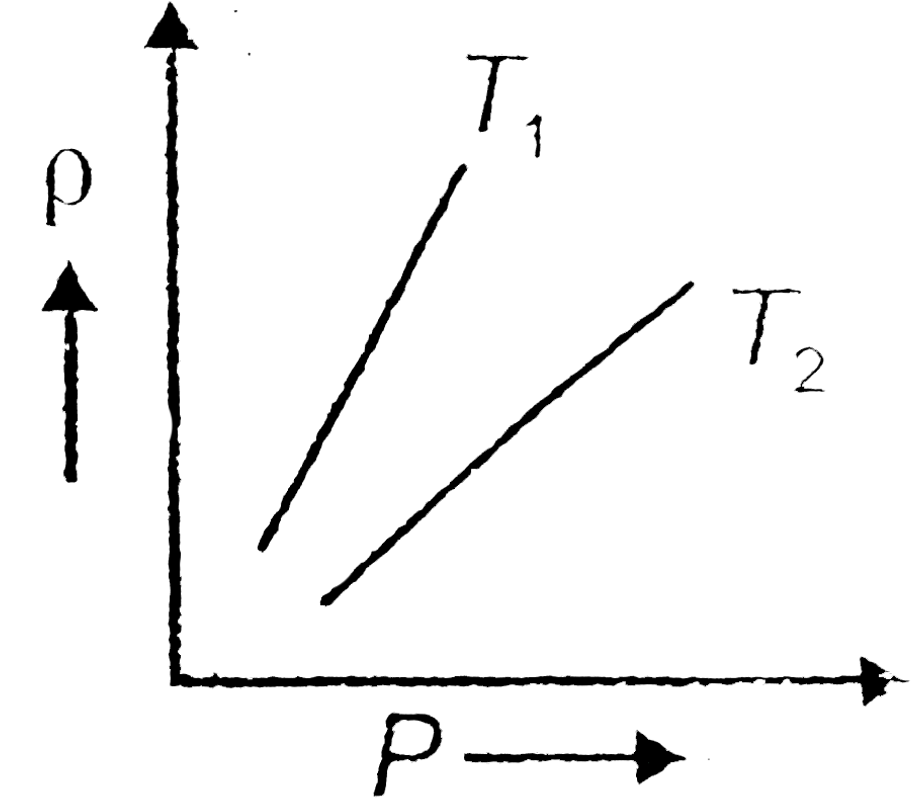
A graph plotted between Pdvsd (where p is osmotic pressure of solution of a solute of mol. Wt. m and d is its density temperature T. Pick out the correct statements about the plots :
[Pd]d→0=STm
The intercept of the plot STm
The intercept of the plot =[Pd]d→0
[Pd]d→0 is independent of temperature
The correct Answer is:A, B, C
To solve the problem, we need to analyze the relationship between osmotic pressure (P), density (d), and the molar mass (m) of a solute in a solution. We will derive the relationship and then interpret the graph plotted between Pd and d.
1. Understanding Osmotic Pressure:
The osmotic pressure (Π) of a solution is given by the formula:
Π=CRT
where C is the concentration of the solute, R is the ideal gas constant, and T is the temperature in Kelvin.
2. Relating Concentration to Density:
The concentration C can be expressed in terms of density d and molar mass m:
C=nV=mM⋅V
where n is the number of moles, V is the volume, and M is the molar mass of the solute.
3. Using the Ideal Gas Law:
From the ideal gas law, we have:
PV=nRT
Rearranging gives us:
P=nRTV
4. Substituting for Density:
We know that density d is defined as:
d=mV
Therefore, we can express V in terms of d:
V=md
5. Substituting Back into the Pressure Equation:
Substituting this expression for V back into the equation for P:
P=nRTmd=nRTdm
6. Expressing Pd:
Now, we can express Pd:
Pd=nRTm
This shows that Pd is directly proportional to the temperature T and inversely proportional to the molar mass m.
7. Analyzing the Graph:
When we plot Pd against d, we can see that as d increases, Pd remains constant for a given temperature T and molar mass m. The intercept of this plot will be related to RTm.
8. Conclusion:
Based on the analysis, we can conclude that:
- The intercept of the plot is RTm.
- The relationship shows that Pd is dependent on temperature and molar mass.
Correct Statements:
- The intercept of the plot is RTm.
- The plot indicates that Pd is directly proportional to temperature.
The osmotic pressure (Π) of a solution is given by the formula:
Π=CRT
where C is the concentration of the solute, R is the ideal gas constant, and T is the temperature in Kelvin.
The concentration C can be expressed in terms of density d and molar mass m:
C=nV=mM⋅V
where n is the number of moles, V is the volume, and M is the molar mass of the solute.
From the ideal gas law, we have:
PV=nRT
Rearranging gives us:
P=nRTV
We know that density d is defined as:
d=mV
Therefore, we can express V in terms of d:
V=md
Substituting this expression for V back into the equation for P:
P=nRTmd=nRTdm
Now, we can express Pd:
Pd=nRTm
This shows that Pd is directly proportional to the temperature T and inversely proportional to the molar mass m.
When we plot Pd against d, we can see that as d increases, Pd remains constant for a given temperature T and molar mass m. The intercept of this plot will be related to RTm.
Based on the analysis, we can conclude that:
- The intercept of the plot is RTm.
- The relationship shows that Pd is dependent on temperature and molar mass.
- The intercept of the plot is RTm.
- The plot indicates that Pd is directly proportional to temperature.
Topper's Solved these Questions
- BOOK - RESONANCE ENGLISHCHAPTER - SOLUTIONSEXERCISE - EXERCISE-2(PART-4)4videos
SOLUTIONS
- BOOK - RESONANCE ENGLISHCHAPTER - SOLUTIONSEXERCISE - EXERCISE-3(PART-1)14videos
SOLUTIONS
- BOOK - RESONANCE ENGLISHCHAPTER - SOLUTIONSEXERCISE - EXERCISE-2(PART-1)25videos
SOLUTIONS
- BOOK - RESONANCE ENGLISHCHAPTER - SOLUTION AND COLLIGATIVE PROPERTIESEXERCISE - PHYSICAL CHEMITRY (SOLUTION & COLLIGATIVE PROPERTIES)52videos
SOLUTION AND COLLIGATIVE PROPERTIES
- BOOK - RESONANCE ENGLISHCHAPTER - STEREOISOMERISMEXERCISE - EXERCISE (PART III : PRACTICE TEST-2 (IIT-JEE (ADVANCED PATTERN))23videos
STEREOISOMERISM
Similar Questions
Knowledge Check
- Question 1 - Select One
According to Henry's law the partial pressure of the gas in vapour phase (p) is proportional to the mole fraction of the gas (x) in the solution . For different gases the correct statement about Henry's constant is
Ahigher the value of KH at a given pressure , higher is the solubility of the gasBhigher the value of KH at a given pressure , lower is the solubility of the gasCKH is not a function of nature of gasDKH value for all gases is same at a given pressure - Question 2 - Select One
If a graph is plotted between T2andr3 for a planet, then its slope will be be (where MS is the mass of the sun)
A4π2GMSBGMS4πC4πGMSDGMS
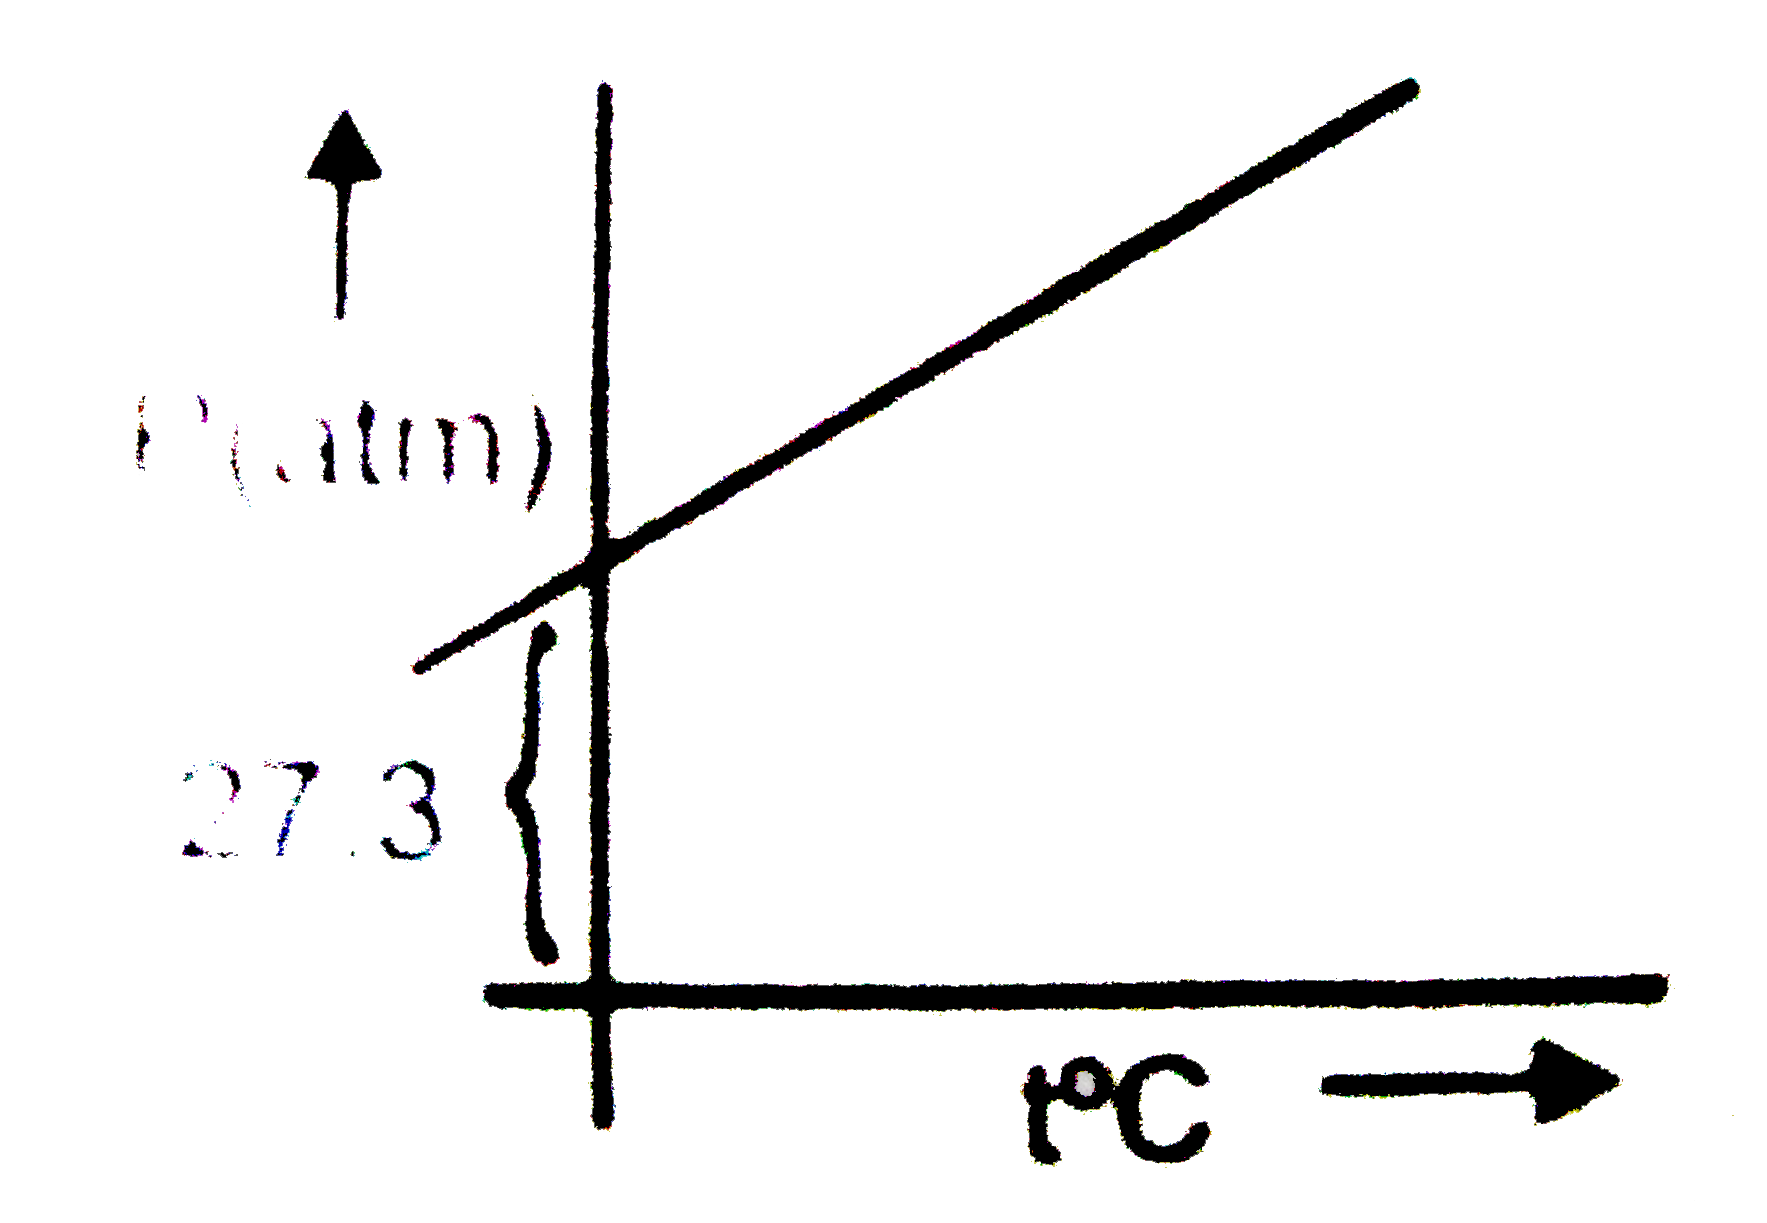
A graph is plotted between p (atm) vs t∘C for 10 mol of an ideal gas as follows:
Then slope of curve and volume of container (L) respectively, are:
 View Solution
At 17∘C, the osmotic pressure of sugar solution is 580 torr. The solution is diluted and the temperature is raised to 57∘C, when the osmotic pressure is found to be 165 torr. The extent of dilution is
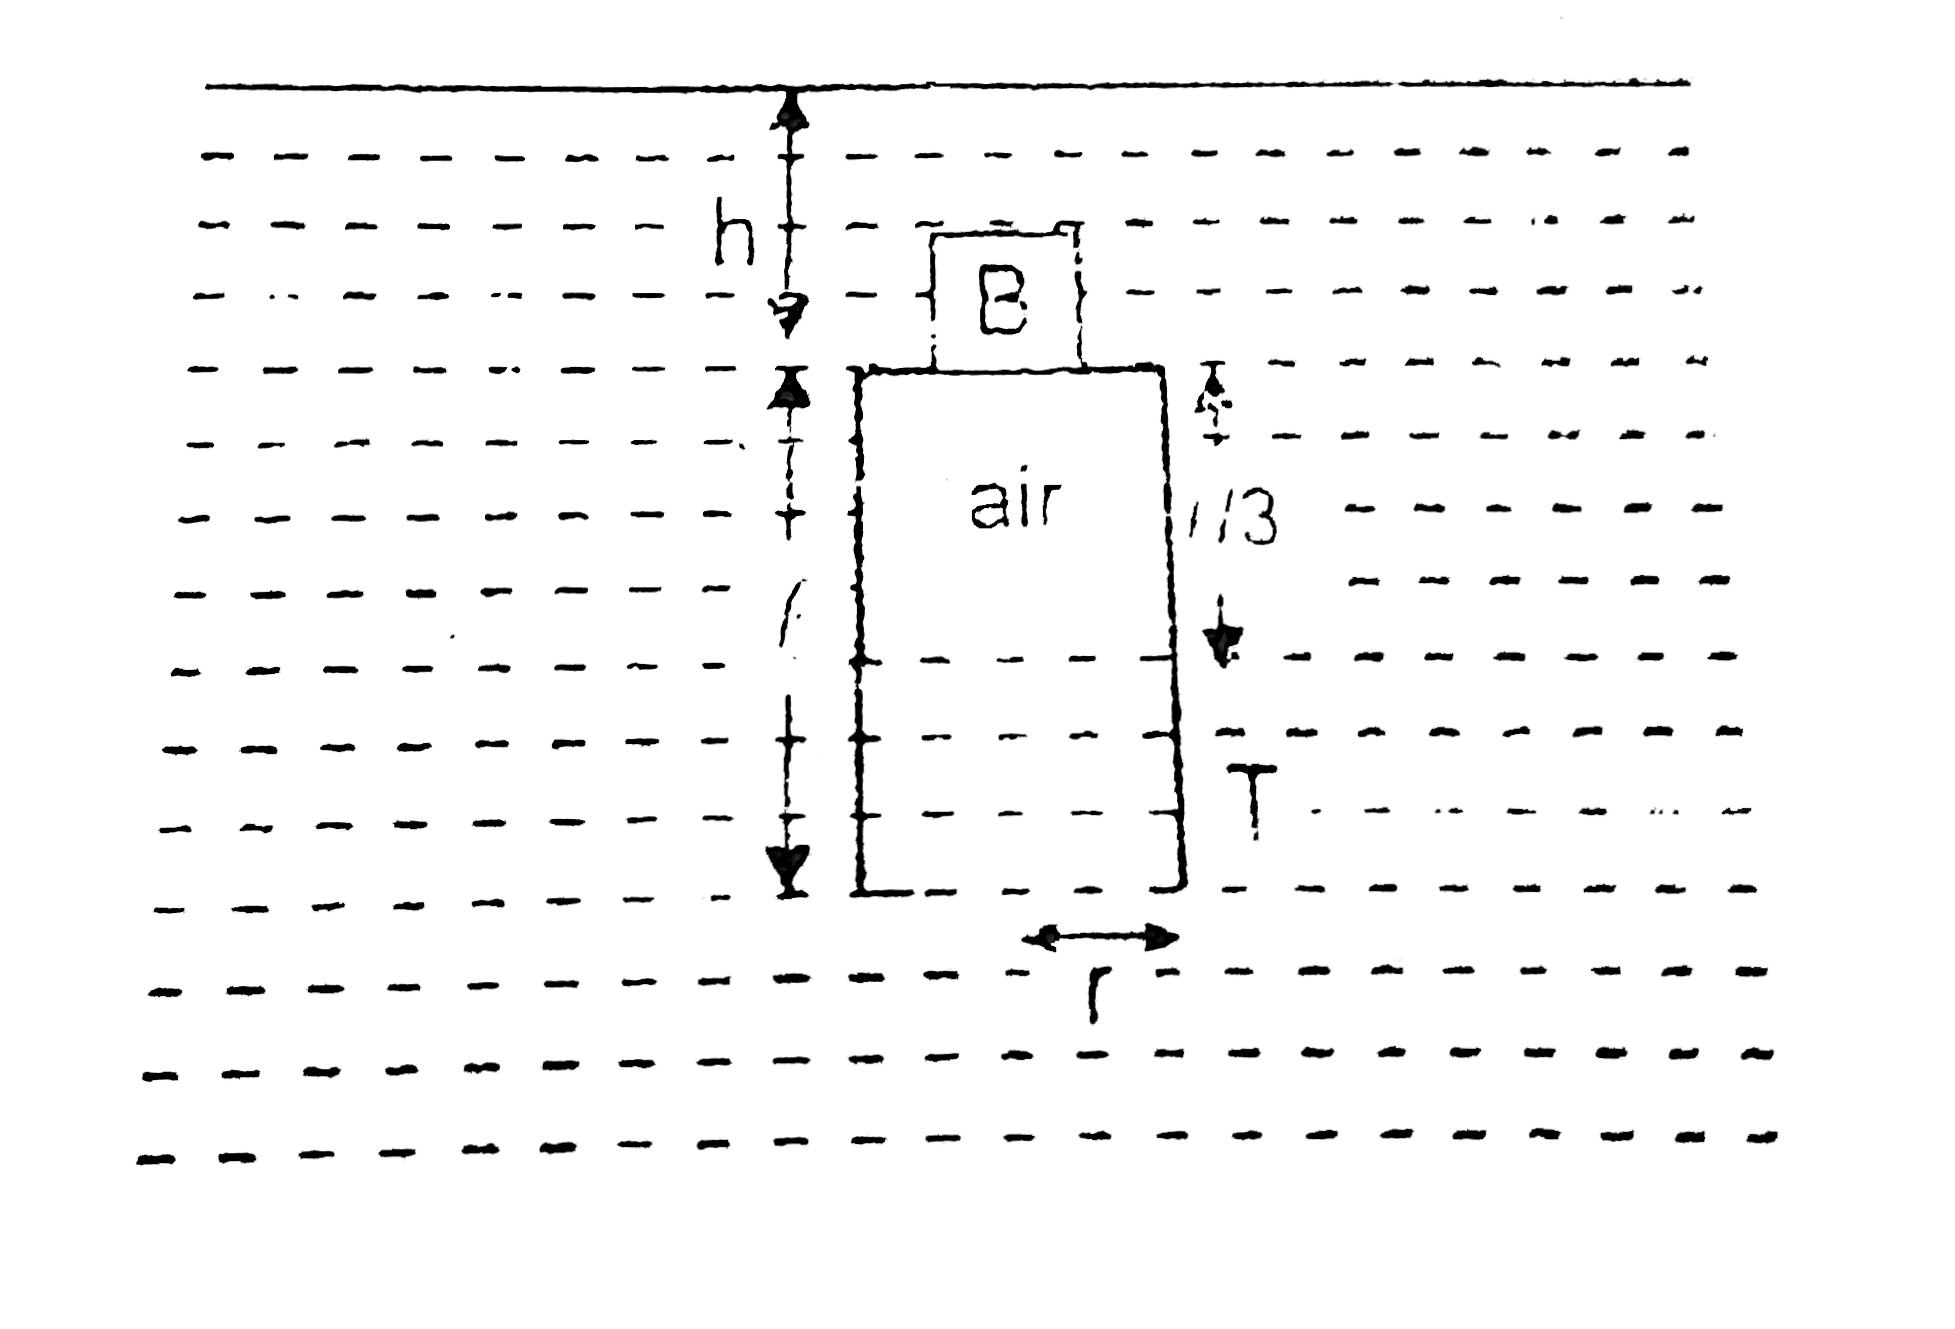
a.2 times ,b.3 times ,c.4 times ,d.5 timesView SolutionA light cylindrical tube 'T' of length l and radius 'r' containing air is inverted in water (density d). One end of the tube is open and the other is closed A block 'B' of density 2d is kept on the tube as shown in the figure. The tube stays in equilibrium in the position shown. (Assume the atmosphere pressure is to be P0)
Assume that density of air is very small than density of block and water. Pick up the correct statement (s)
 View Solution
The osomotic pressure of a solution at 0∘C is 4atm. What will be its osmotic pressure at 546K under similar conditions?
a.4atm, b.9atm,c.8atm, d.6atmView SolutionA graph is plotted between log (x/m) and log p according to the equation xmkp1/n
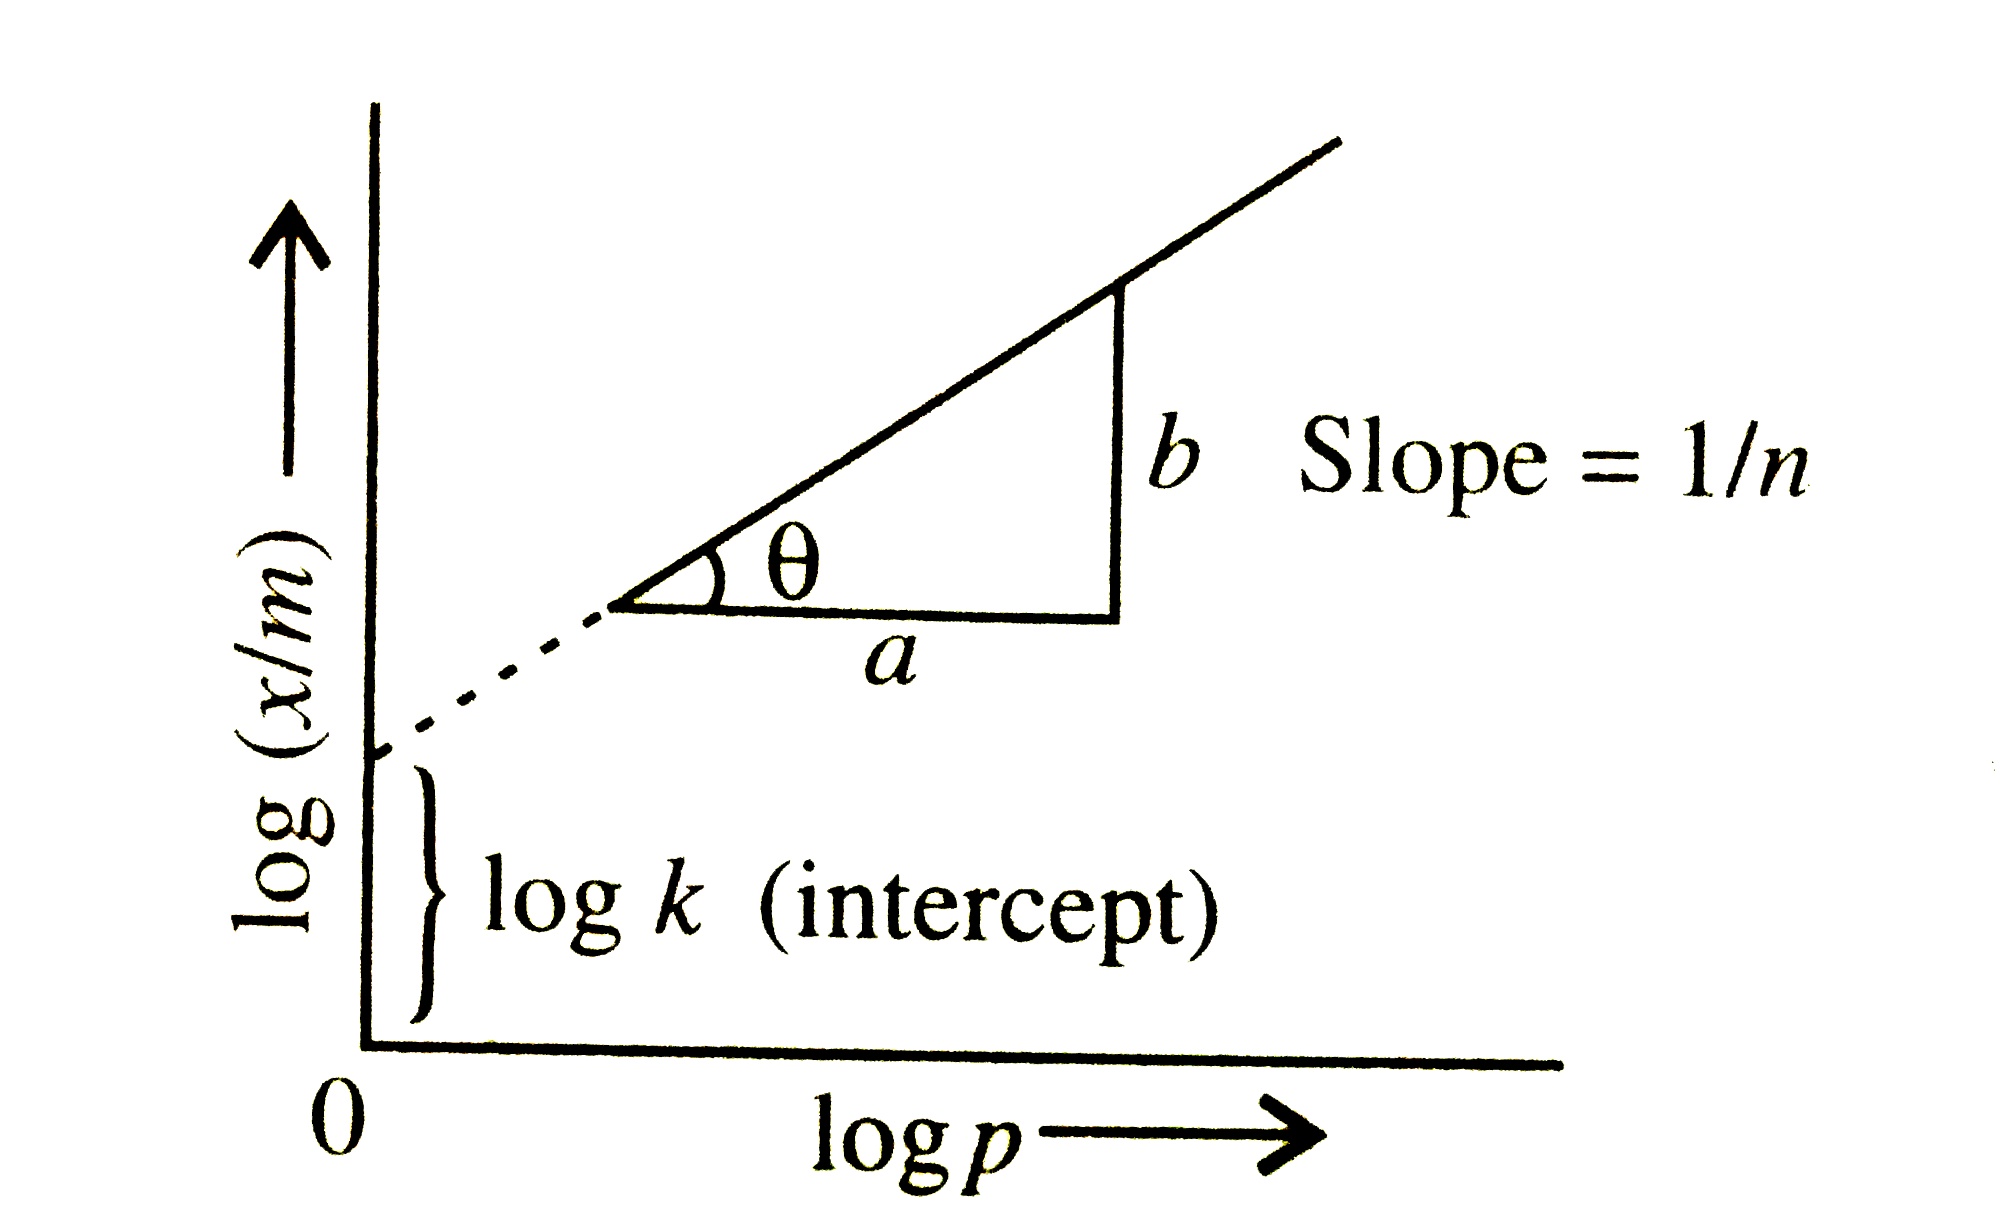
Which is the following statements about his graph is not correct ?View SolutionThe density (ρ) versus pressure (P) graphs of a given mass of an ideal gas is shown at two temperatures T1andT2. Then relation between T1andT2 may be
 View Solution


