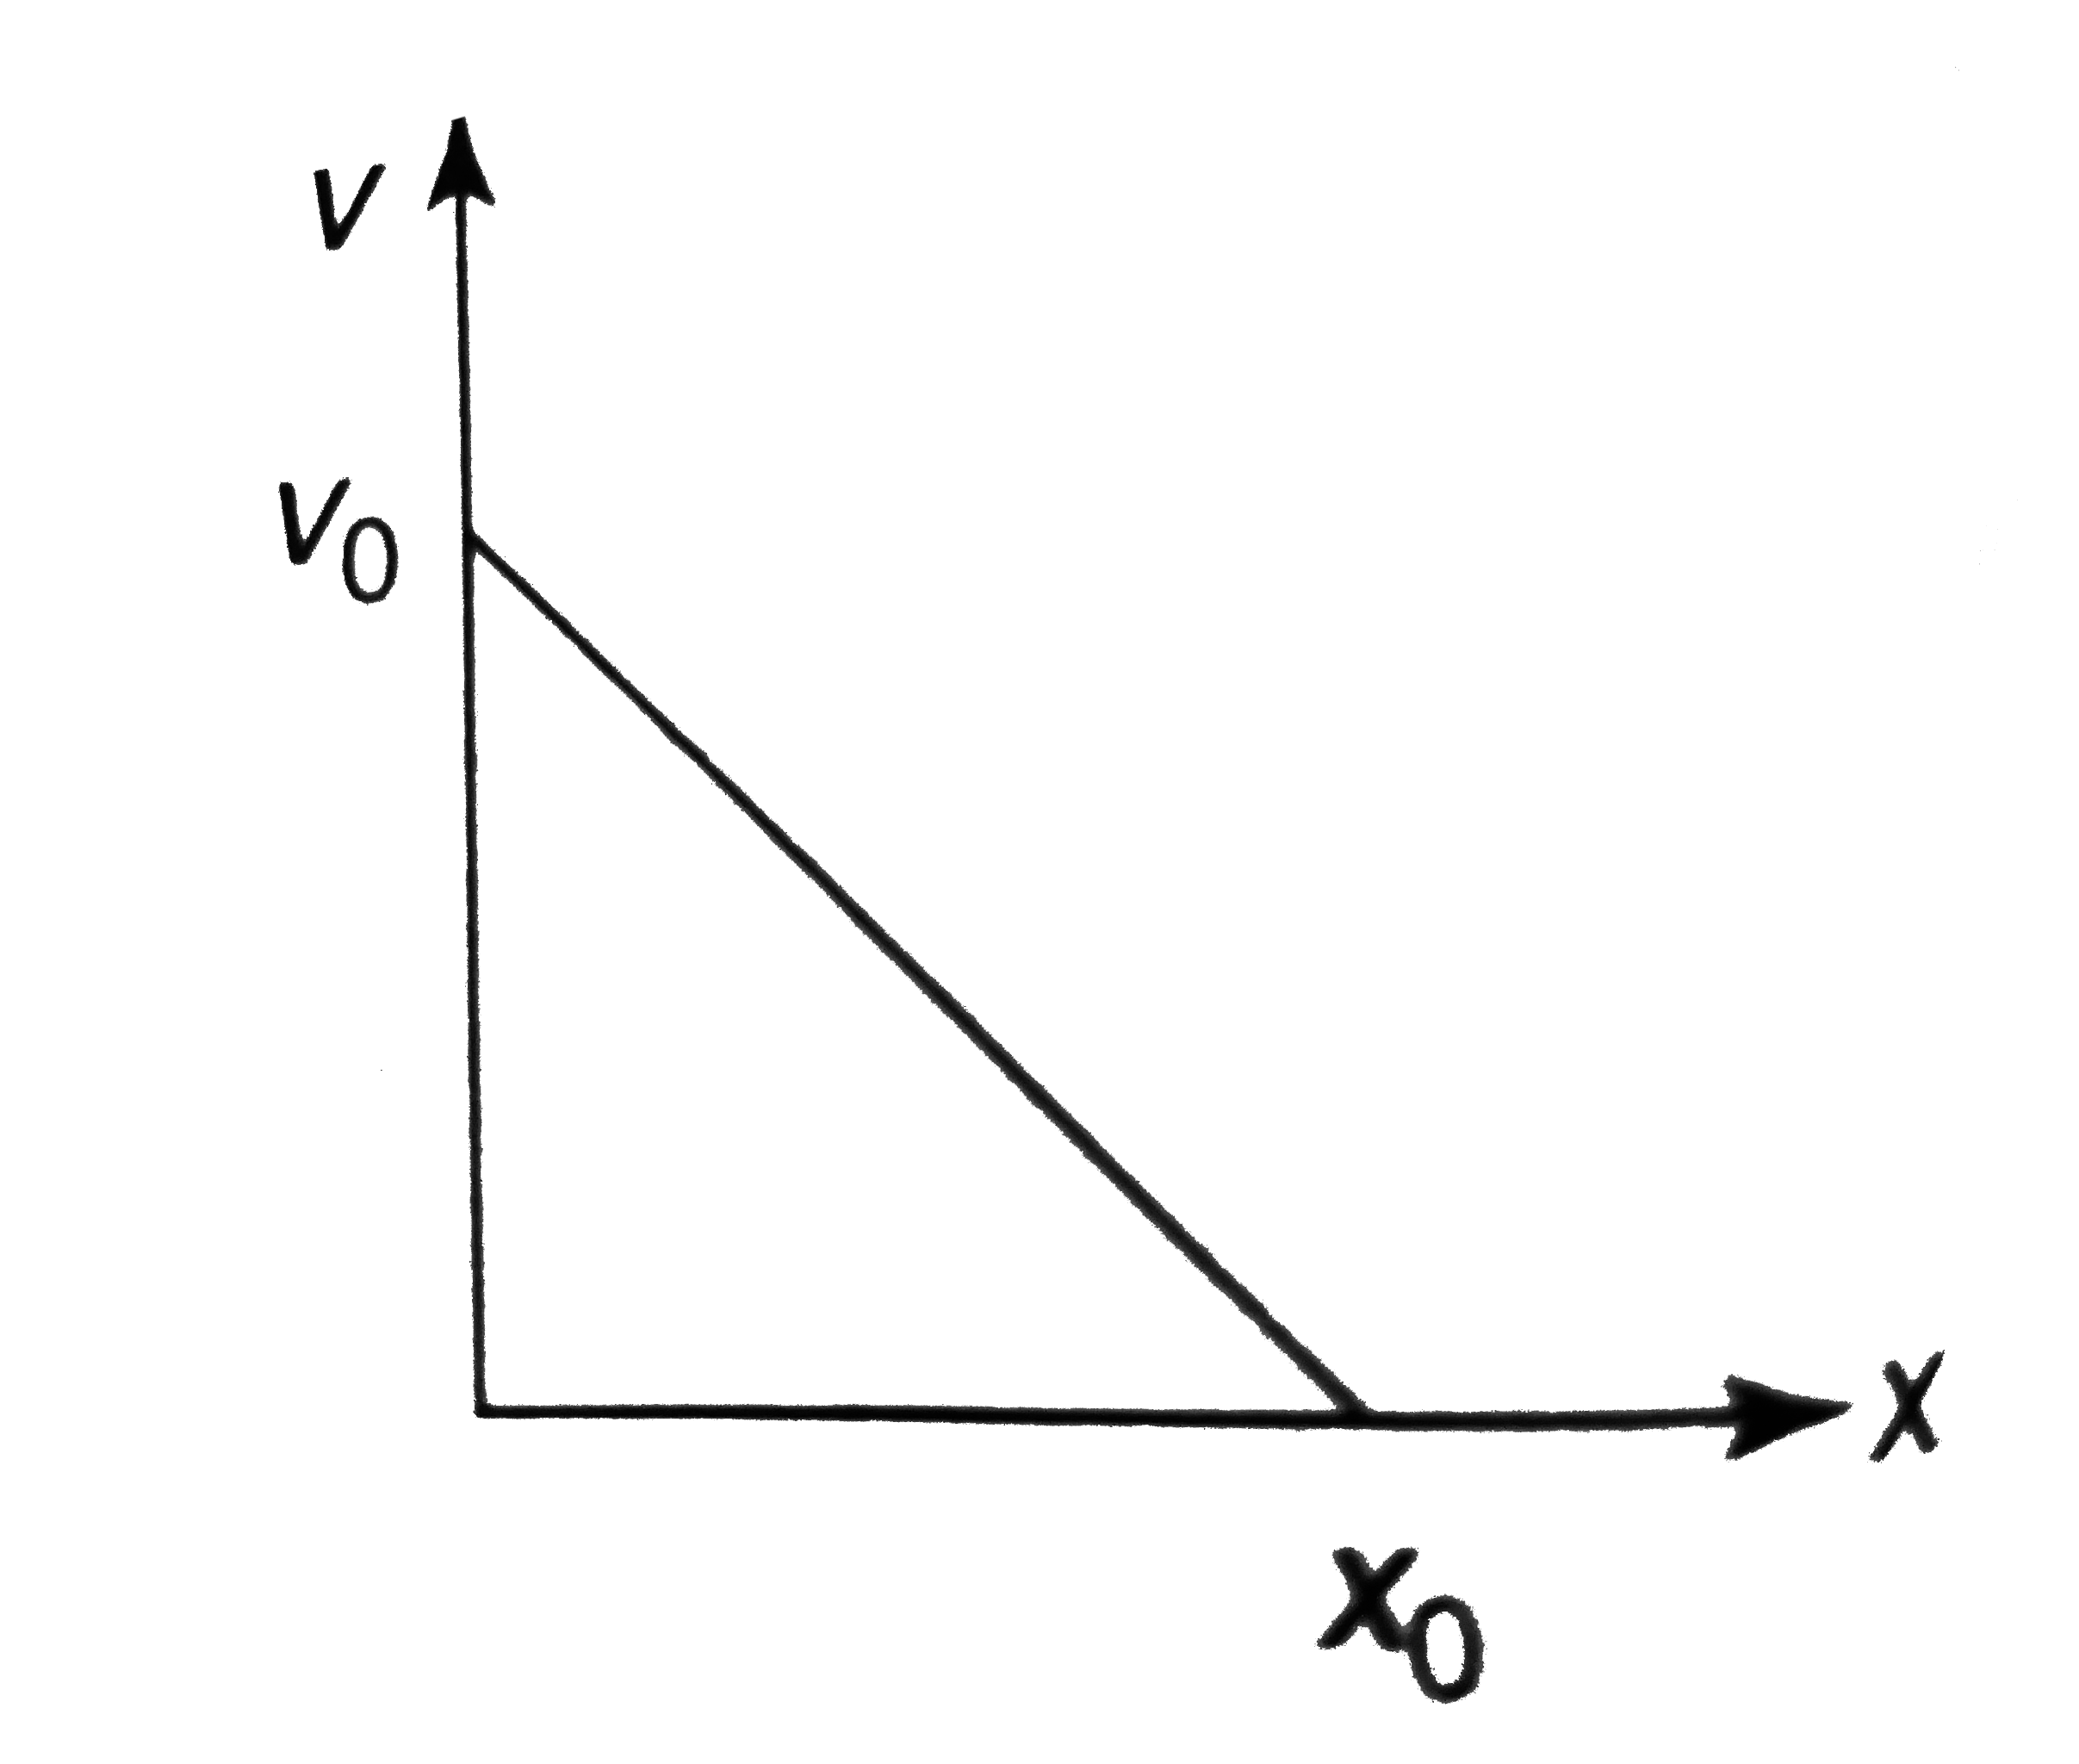
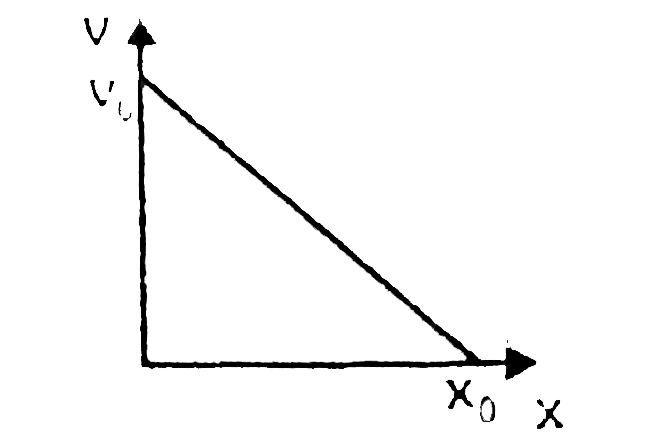
Which of the following graphs correctly represents the variation of g on the - Earth? Solution in Kannada


The correct Answer is:B
Upto the surface of earth gαR
Outside the surface of earth gα1r2
Topper's Solved these Questions
- BOOK - SUNSTAR PUBLICATIONCHAPTER - II PUC PHYSICS SUPPLEMENTARY EXAM QUESTION PAPER JULY - 2017 EXERCISE - PART-D ( Vi. Answer any three of the following questions:)5videos
II PUC PHYSICS SUPPLEMENTARY EXAM QUESTION PAPER JULY - 2017
- BOOK - SUNSTAR PUBLICATIONCHAPTER - K-CET-PHYSICS - 2016EXERCISE - MCQs59videos
K-CET-PHYSICS - 2016
Similar Questions
In a parallel plate capacitor with air between the plates, each has an area 8×10⁻³m2 and distance between the plates is 2 mm. Calculate the capacitance of the capacitor. If this capacitor is connected to a 50 V supply, what is the charge on each plate of the capacitor? (Absolute permittivity of free space =8.85×10⁻¹²Fm−1)
02:14View SolutionA body falls freely for 10 sec Its average velocity during this journey ( take = 10ms−2)
02:49View SolutionWhich of the following graphs correctly represents the variation of β=−dV/dPV
with P for an ideal gas at constant temperature?02:35View SolutionThe given graph shows the variation of velocity with displacement. Which one of the graphs given below correctly represents the variation of acceleration with displacement ?
 03:32View Solution
Which of the following graphs correctly represents the variation of β=−(dVdP)/V with P for an ideal gas at constant temperature
View SolutionWhich of following graphs correctly represents the variation of particle momentum with de-Broglie wavelength?
03:29View SolutionThe velocity -displacement graph of a particle is as shown in the figure. Which of the following graphs correctly represents the variation of acceleration with displacement?
02:14View SolutionThe graph that represents variation of g with height (h) from the surface of the earth is
02:41View SolutionThe graph that represents variation of g with depth (d) from the surface of the earth is
03:52View SolutionThe graph that represents variation of g at the equator with square of angular velocity of rotation of earth is
09:47View SolutionWhich of the following graphs correctly represents the variation of g on the - Earth?
View SolutionThe variation of g with height or depth (r ) is shown correctly by the graph in Fig .4.2 (where R is radius of the earth),
03:27View SolutionWhich of the following graph shows the variation in the value of 'g' with increasing distance from the centre of the earth. [Re = Radius of earth]
04:54View SolutionThe velocity -displacement graph of a particle is as shown in the figure. Which of the following graphs correctly represents the variation of acceleration with displacement?
 02:10View Solution
निम्नलिखित में से कौन-सा ग्राफ सही रूप से पृथ्वी तल पर g के परिवर्तन को प्रदर्शित करता है?
03:14View SolutionThe given graph shows the variation of velocity with displacement. Which one of the graph given below correctly represents the variation of acceleration with displacement :-
 02:15View Solution

