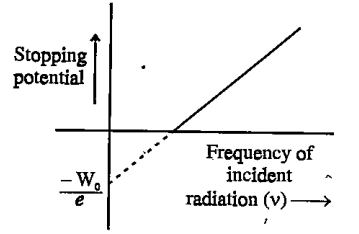
What is plot a graph how for a given photosensitive material cutt off voltage and threshold frequency are related ?
Acc. to Einstein.s photoelectric equation the maximum K.E. of photoelectrons is given by Kmax=hv−W0. If V0 is the atopping potential, then Kmax=eV0 or eV0=hv−W0
V0=(h/e)v-W0e So, if we plot a graph V0~ v is a straight line.

Similar Questions
Plot a graph showing variation of stopping potential (V0) with the frequency (v) of the incident radiation for a given photosensitive material. Hence, state the significance of the threshold frequency in photoelectric emission.
Using the principle of energy conservation, write the equation relating the energy of incident photon, threshold frequency and the maximum kinetic energy of the emitted photoelectrons.
View SolutionWork function of a certain photosensitive mateiral is 2.5 eV. Threshold frequency for the material is ____Hz.
View SolutionUsing Einstein's photoelectric equation show how the cut -off voltage and threshold frequency for a given photosensitive material can be determined with the help of a suitable plot/graph.
View SolutionUsing Einstein's photoelectric equation show how the cut -off voltage and threshold frequency for a given photosenstive material can be determined with the help of a suitable plot/graph.
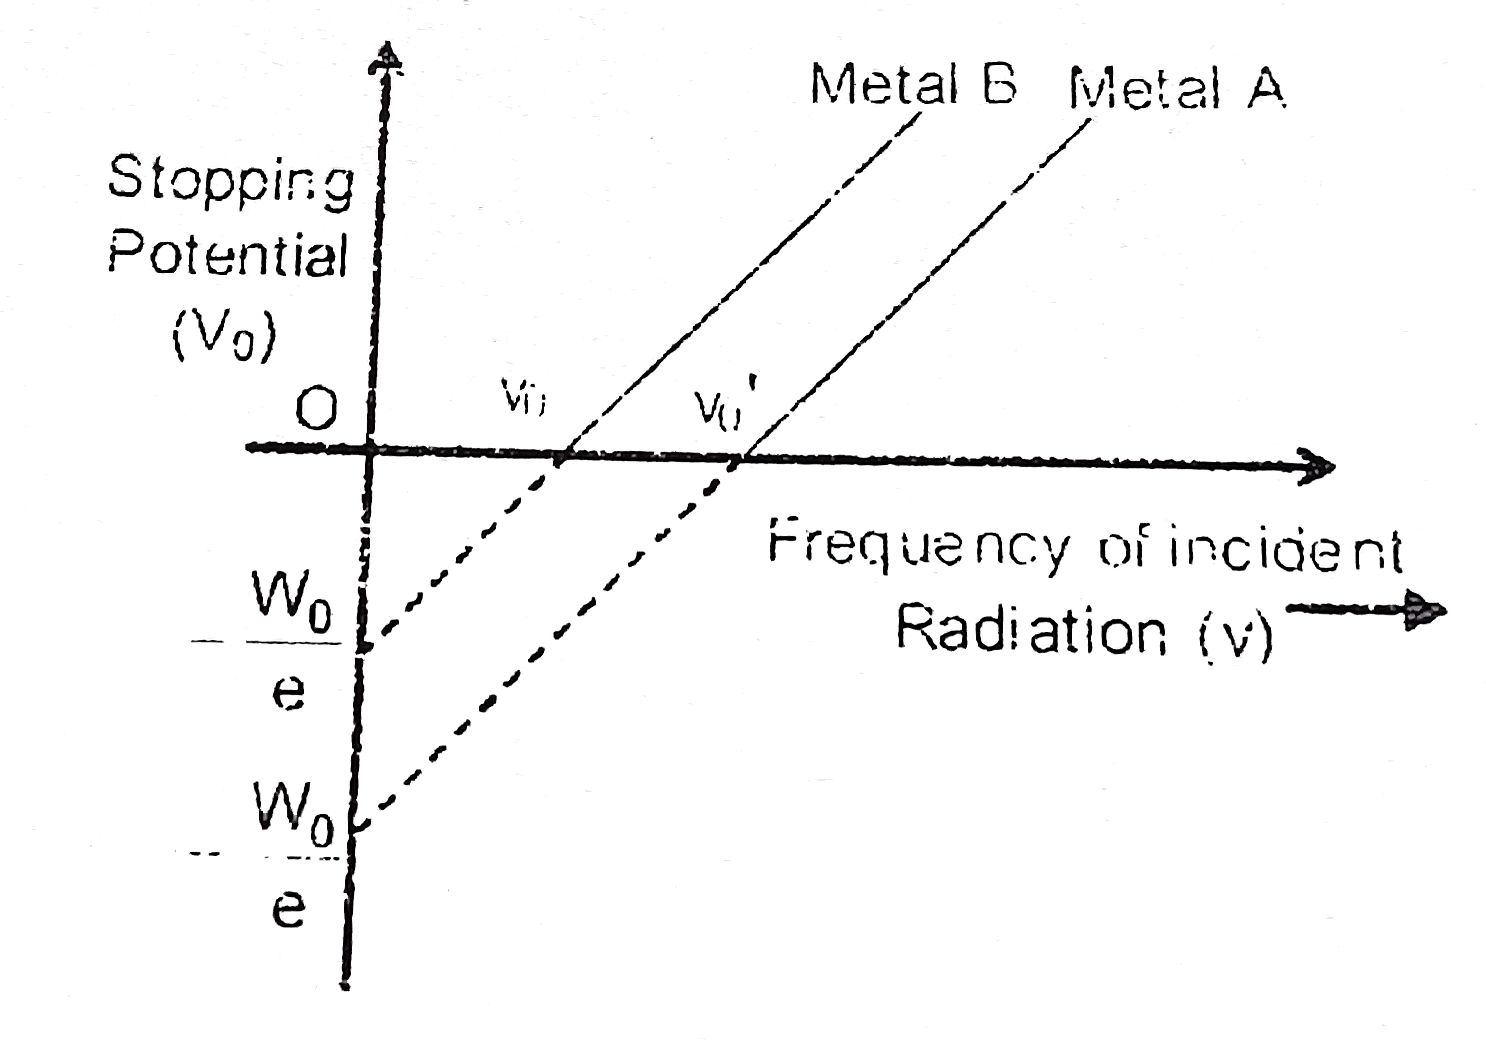
View SolutionThe graph shows variation of stopping potential V0 versus frequency of incident radiation v for two photosensitive metals A and B. Which of two metals has higher threshold frequency and why?

View SolutionThe graph shows variation of stopping potential V0 versus frequency of incident radiation v for two photosensitive metals A and B. Which of two metals has higher threshold frequency and why?

View SolutionSketch the graphs, showing the variation of stopping potential Vs with frequency v of the incident radiations for two photosensitive materials A and B having threshold frequencies v0>v'0 respectively.
(i) which of the two metals A or B has higher work function?
(ii) What information do you get from the slope of the graphs?
(iii) What does the value of the intercept of graph A on the potential axis represent?
View SolutionLight of frequency 1.5 times the threshold frequency is incident on a photosensitive material. If the frequency is halved and the intensity is doubled, the photoelectric current becomes
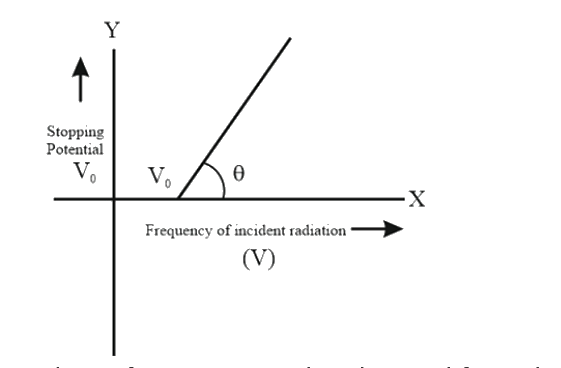
View SolutionThe graph between frequency of incident radiations and stopping potential for a given photosensitive material as follows.

What information can be obtained from the value of the intercept on the potential axis ?
View Solution
