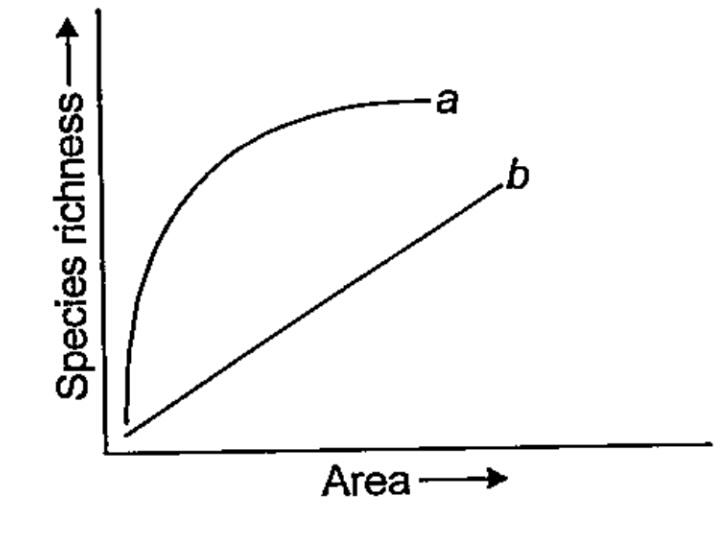
The graph shows species area relationship.
If b denotes the relationship on log scale.
Describe a and b.
 Solution in Punjabi
Step by step video & image solution for The graph shows species area relationship. If b denotes the relationship on log scale. Describe a and b. by Biology experts to help you in doubts & scoring excellent marks in Class 12 exams.
Updated on:21/07/2023Topper's Solved these Questions
Similar Questions
the unique event of flowering plant is-
View SolutionA disease caused by an autosomal primary non-disjunction is.
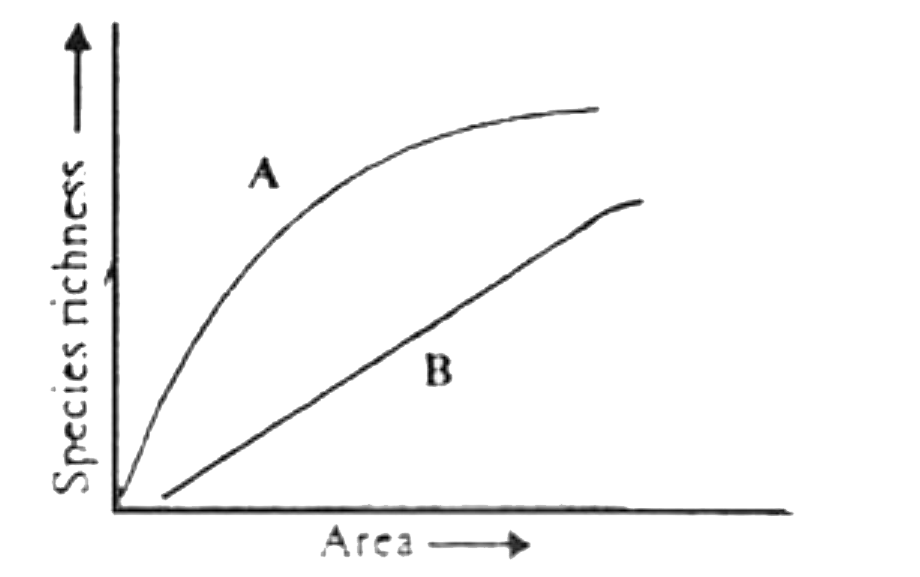
View SolutionWhich option correctly describes the equations for curves A and B, in the given graph of species-area relationship?

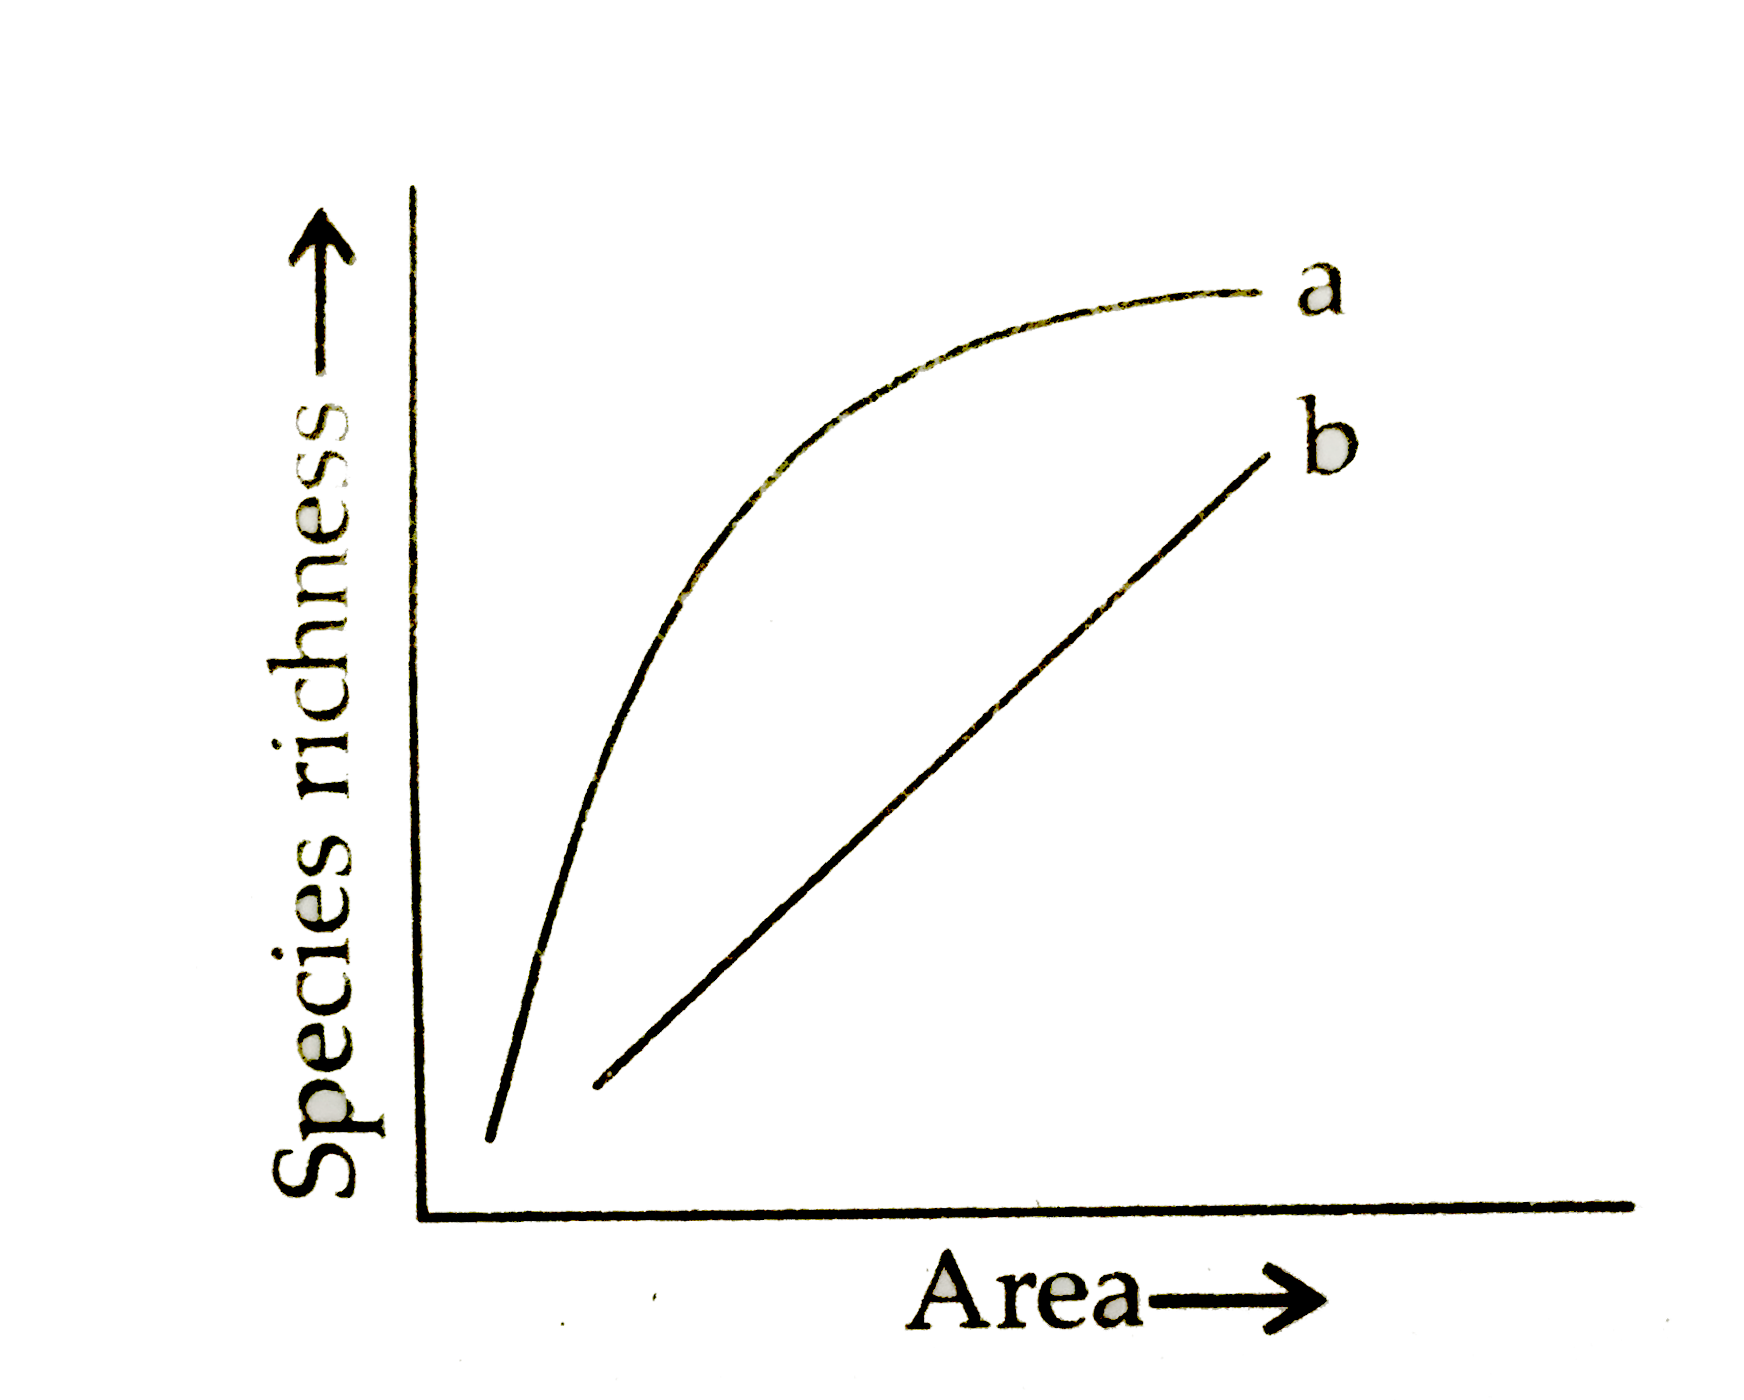
View SolutionThe given graph shows species-area relationship. Write the equation of the curve 'a' and explain.
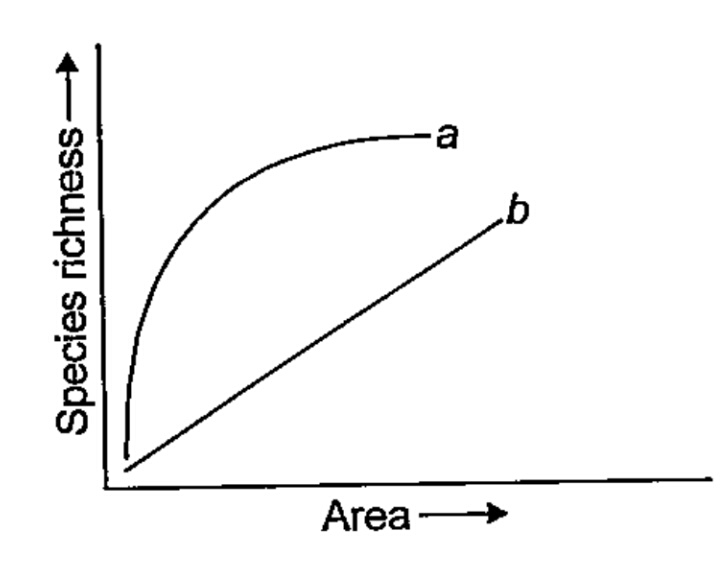
View SolutionThe above graph show Species-Area relationship. Write the equation of the curve a and explain.
View SolutionDescribe species-area relationship on log scale.
View SolutionWhich option correctly describes the equation for curves A and B, in the given graph of species - area relationship ?

View SolutionThe above graph show Species-Area relationship. Write the equation of the curve a and explain.

View SolutionWhich option correctly describes the equation for curves A and B, in the given graph of species - area relationship ?

View SolutionDescribe species area relationships.
View SolutionThe graph shows species area relationship. If b denotes the relationship on log scale. How is slope represented?Give the normal range of slope.
View SolutionThe graph shows species area relationship.
If b denotes the relationship on log scale.
What kind of slope will be observed for frugivorous birds and mammals in a tropical forest?

View SolutionDescribe species-area relationship on log scale.
View SolutionWhich option correctly describes the equation for curves A and B, in the given graph of species - area relationship ?

View SolutionSpecies -Area relationship is represented on a log scale as
View Solution
