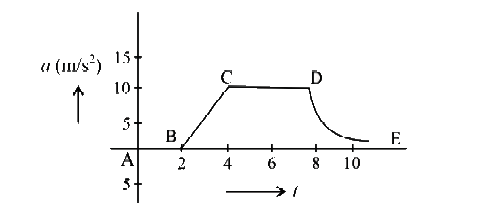
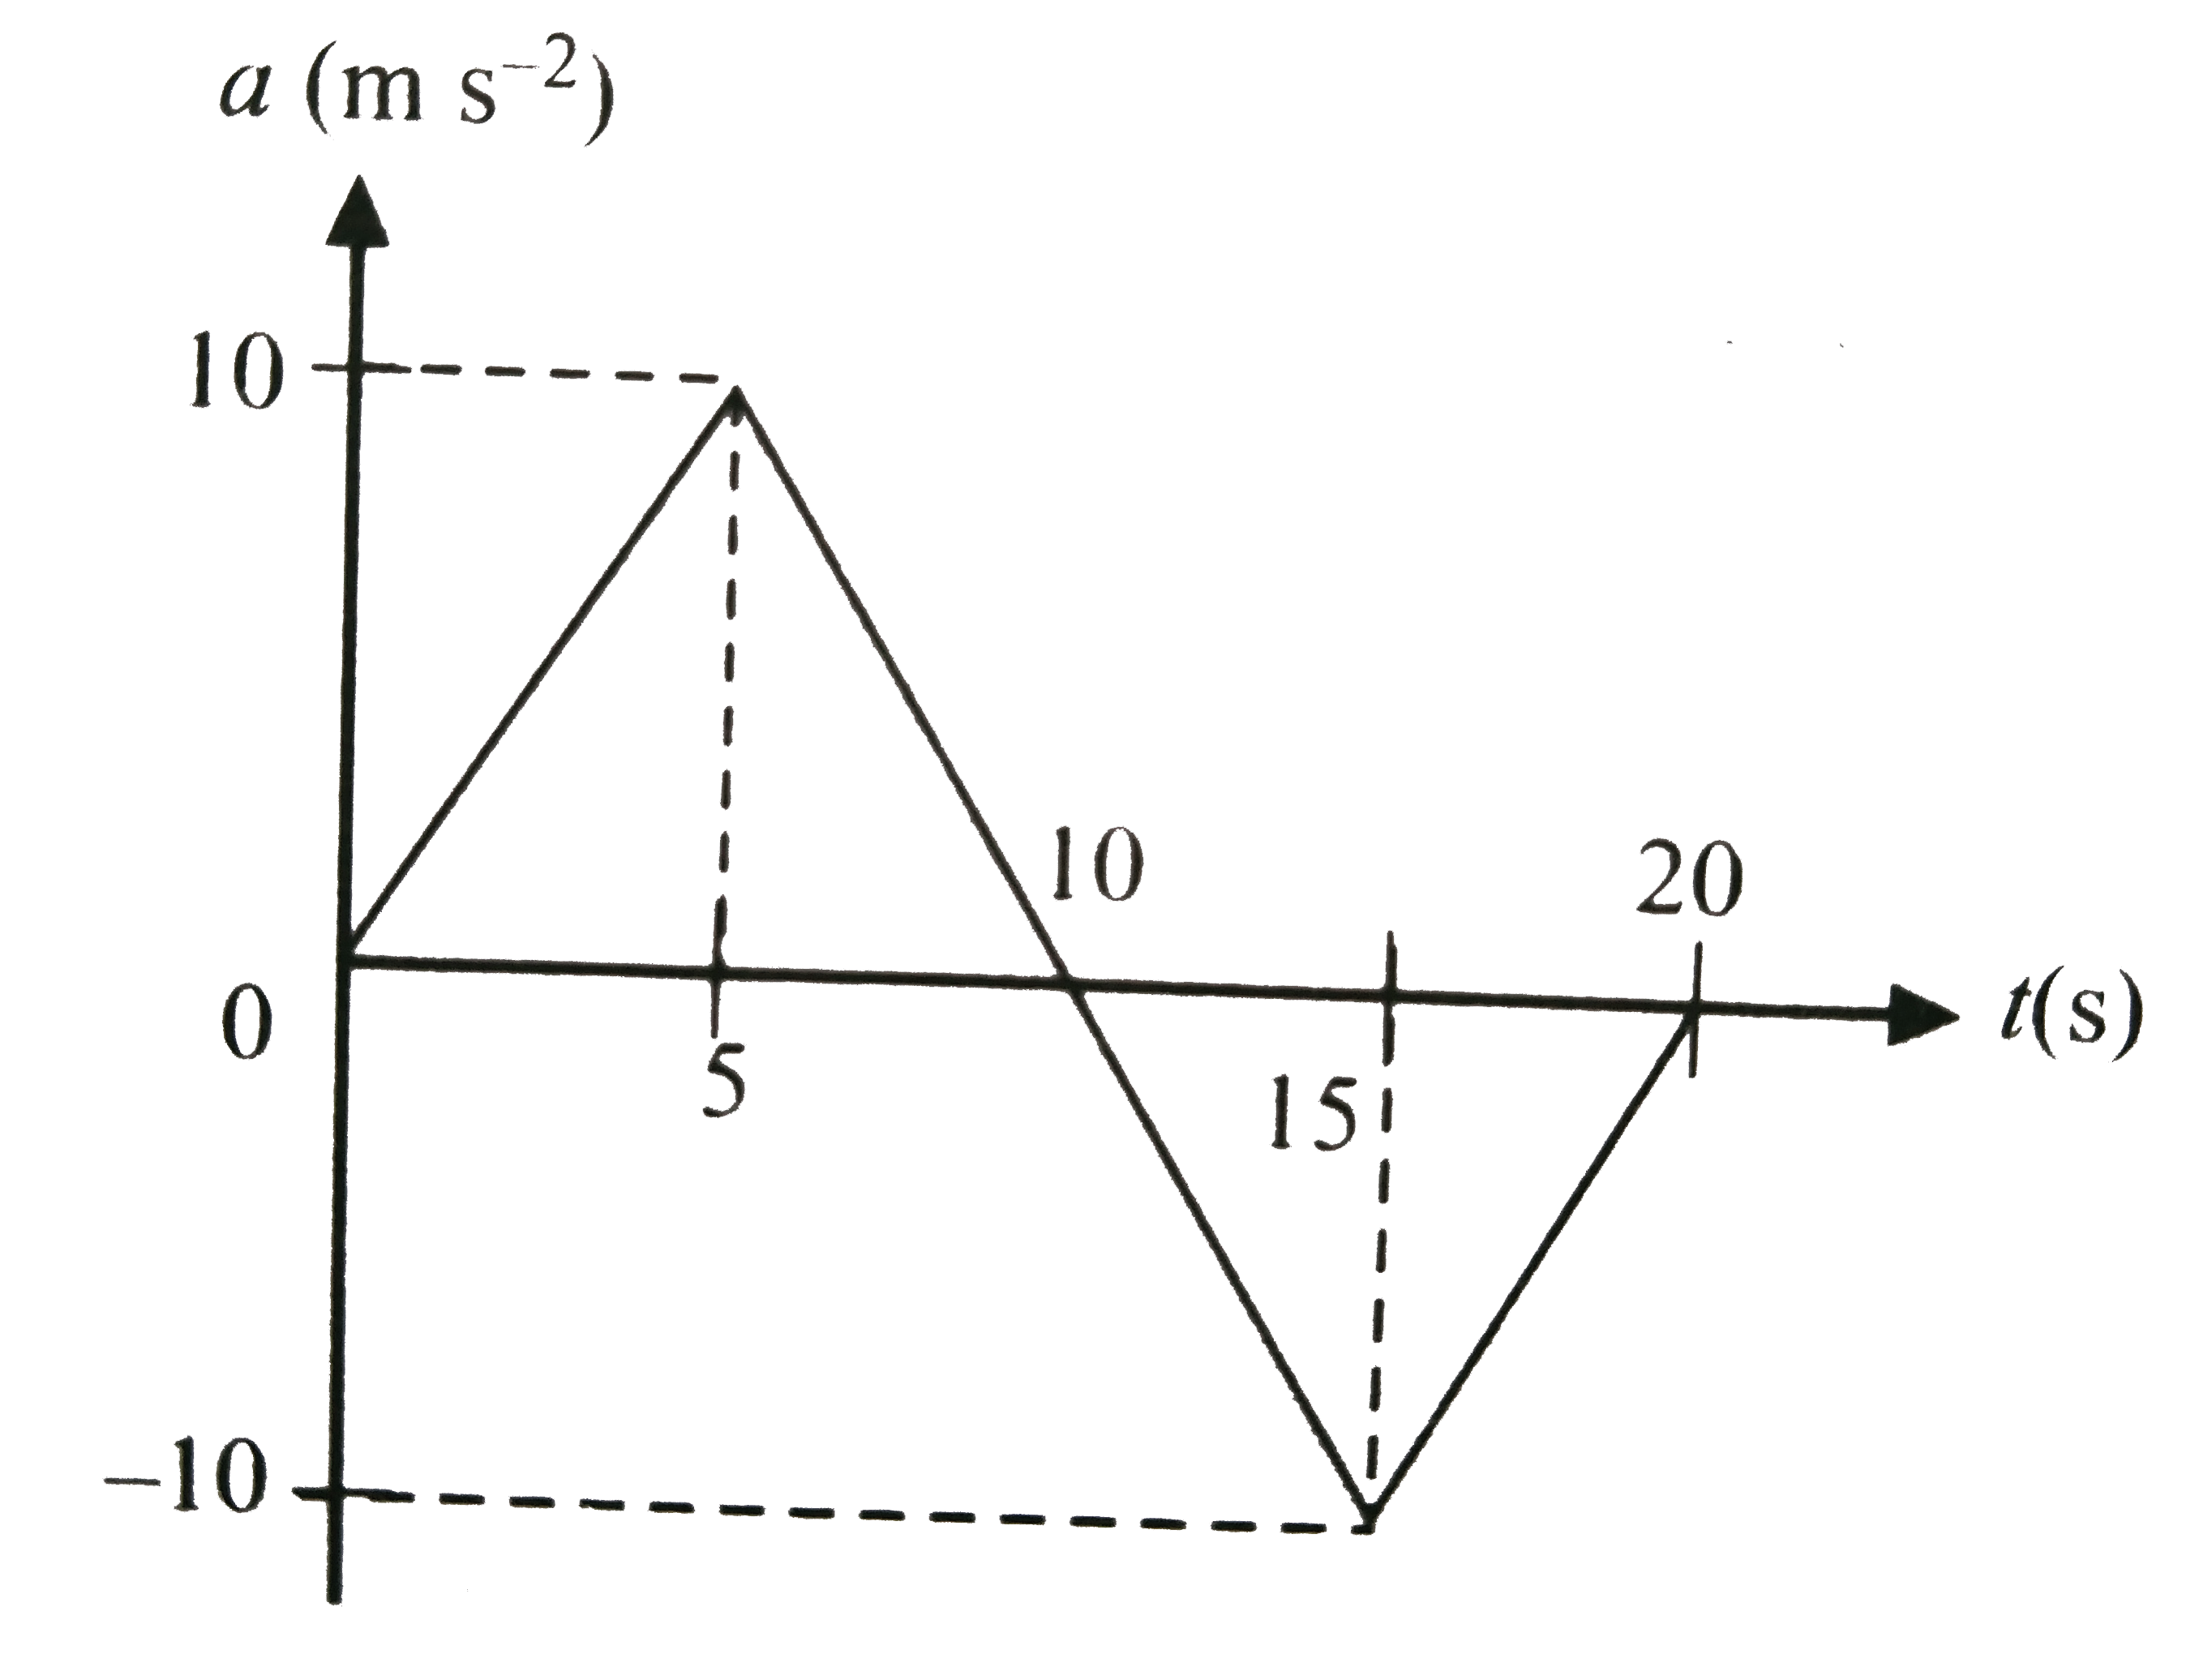
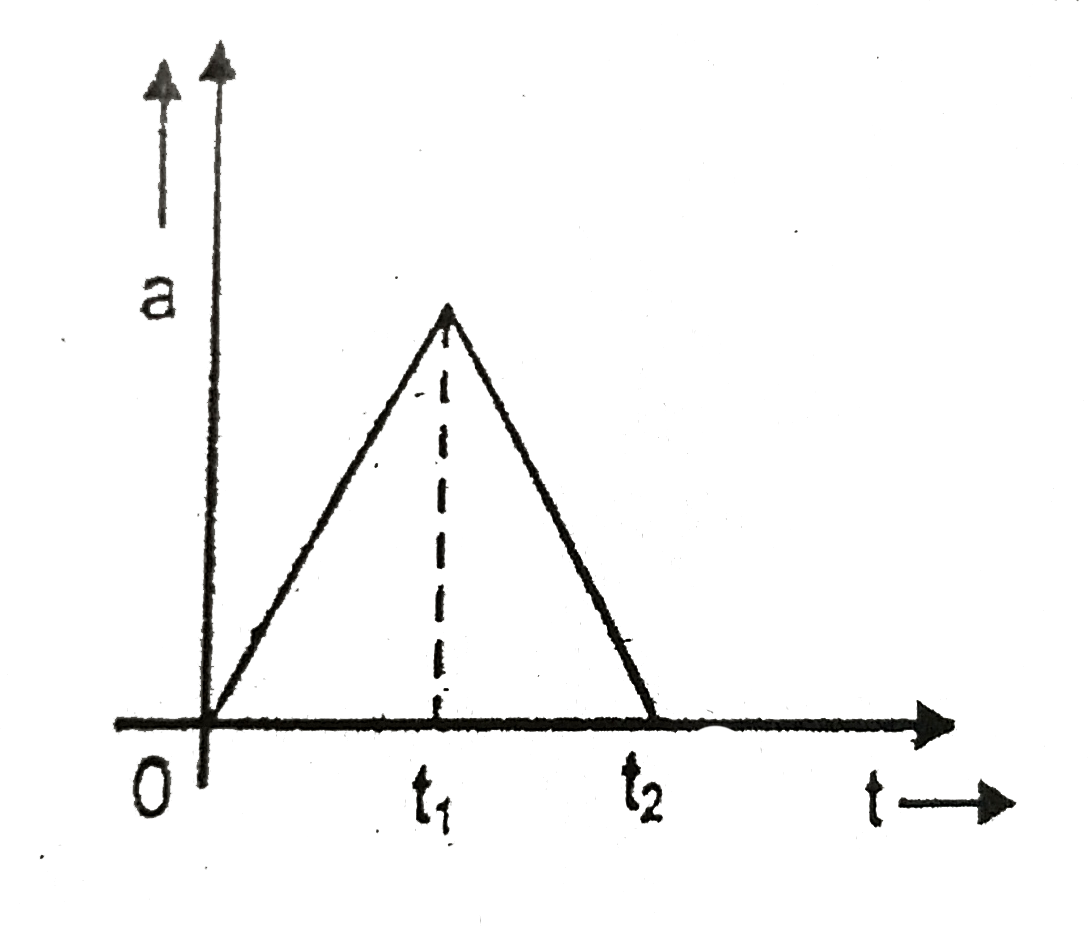
A subway train travels between two of its stations at then stops with the acceleration shcedule shown in the acceleration versus time graph. Then
The time interval Δ is 8s.
The distance between station is 350m
The time interval Δt is 10s
The distance between stations is 416m
The correct Answer is:C, D
Step by step video & image solution for A subway train travels between two of its stations at then stops with the acceleration shcedule shown in the acceleration versus time graph. Then by Physics experts to help you in doubts & scoring excellent marks in Class 11 exams.
Updated on:21/07/2023Topper's Solved these Questions
- KINEMATICS 1BOOK - DC PANDEY ENGLISHCHAPTER - KINEMATICS 1EXERCISE - COMPREHENSION_TYPE
19 Videos
- KINEMATICS 1BOOK - DC PANDEY ENGLISHCHAPTER - KINEMATICS 1EXERCISE - MATCH THE COLUMN
10 Videos
- KINEMATICS 1BOOK - DC PANDEY ENGLISHCHAPTER - KINEMATICS 1EXERCISE - INTEGER_TYPE
15 Videos
- KINEMATICSBOOK - DC PANDEY ENGLISHCHAPTER - KINEMATICSEXERCISE - INTEGER_TYPE
10 Videos
- LAWS OF MOTIONBOOK - DC PANDEY ENGLISHCHAPTER - LAWS OF MOTIONEXERCISE - Medical entrances gallery
39 Videos
Similar Questions
Knowledge Check
The area under acceleration-time graph gives
Aintial velocityBfinal velocityCchange in velocityDdistance travelledPosition-time graph for motion with zero acceleration is
A B
B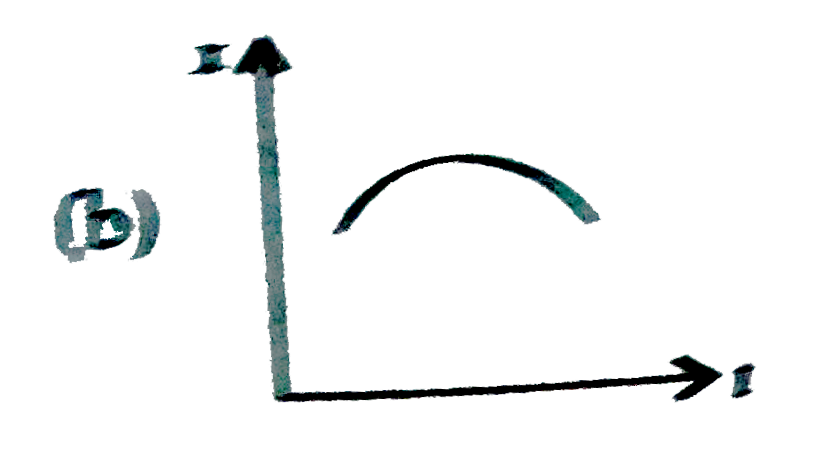 C
C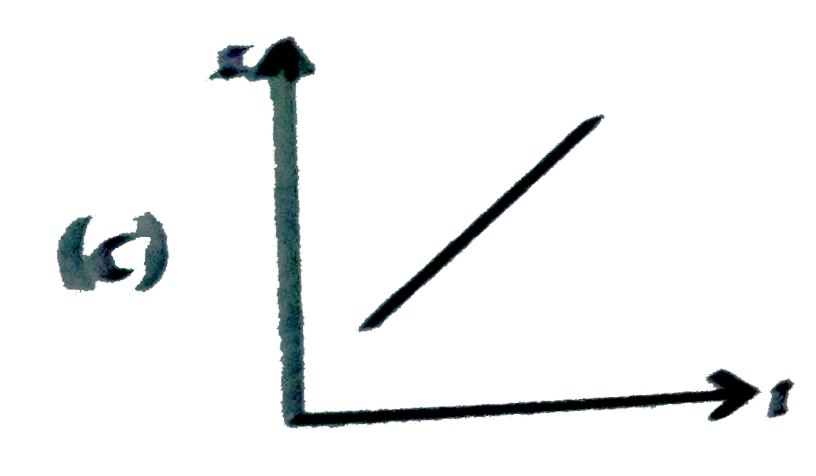 D
D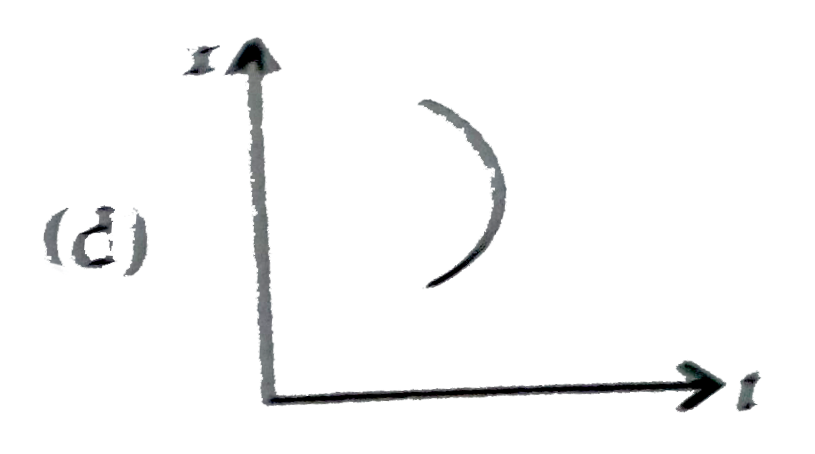
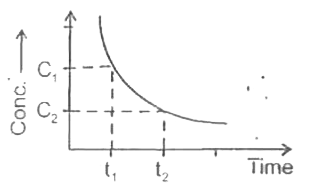
The graph plotted between concentration versus time
View SolutionPosition - time graph for motion with negative acceleration is
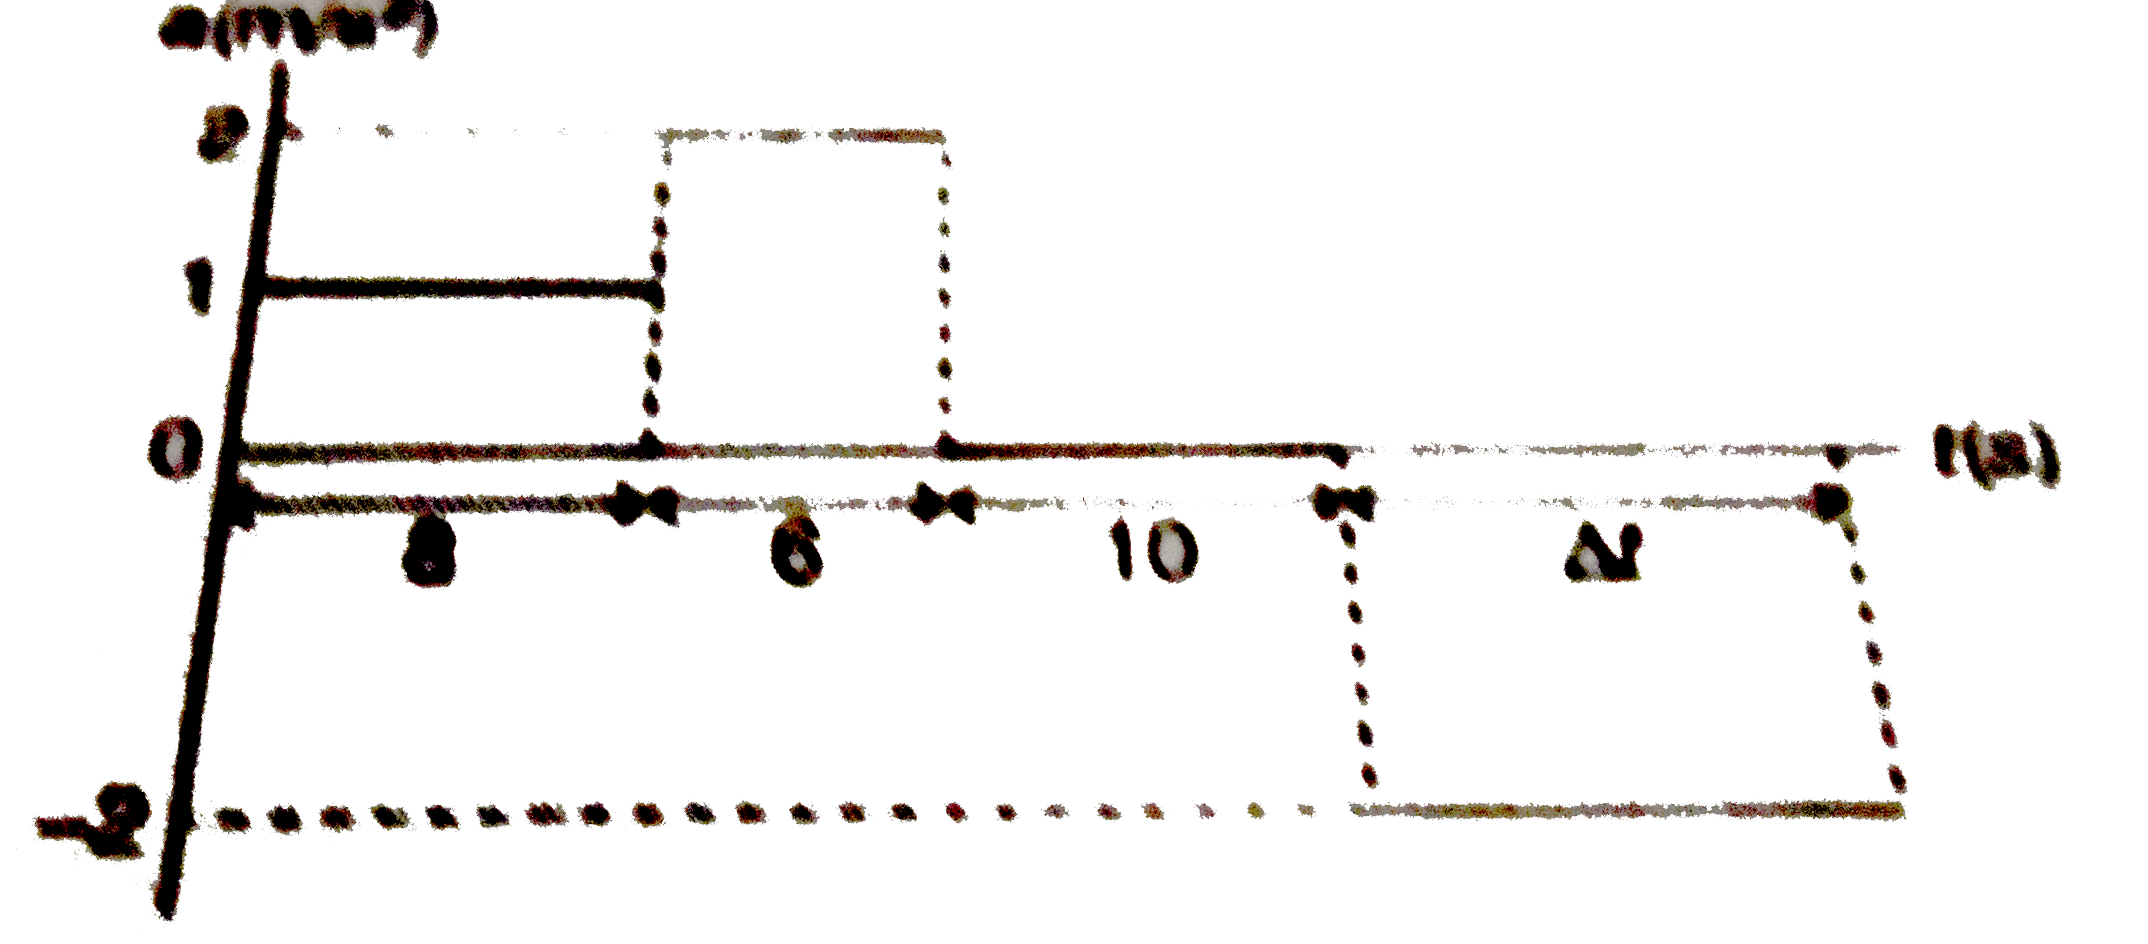
View SolutionPlot the acceleration-time graph of the welocity-time graph given in.
 .
.
View SolutionDuring charging of capacitor in the circuit shown,

Circuit current versus time graph is
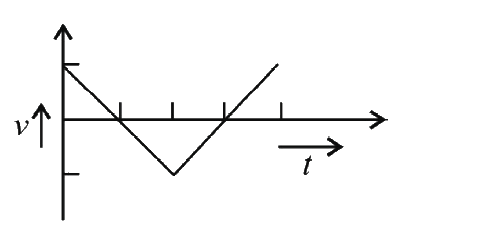
View SolutionThe graph in figure shows the velocity v versus time t for a body. Which of the graphs shown in figure represents the correesponding acceleration versus time graphs ?
View SolutionA particle starts to move along a straight line. The acceleration versus time graph of particle is as shown in figure. The correct velocity versus time graph is :
View Solution

