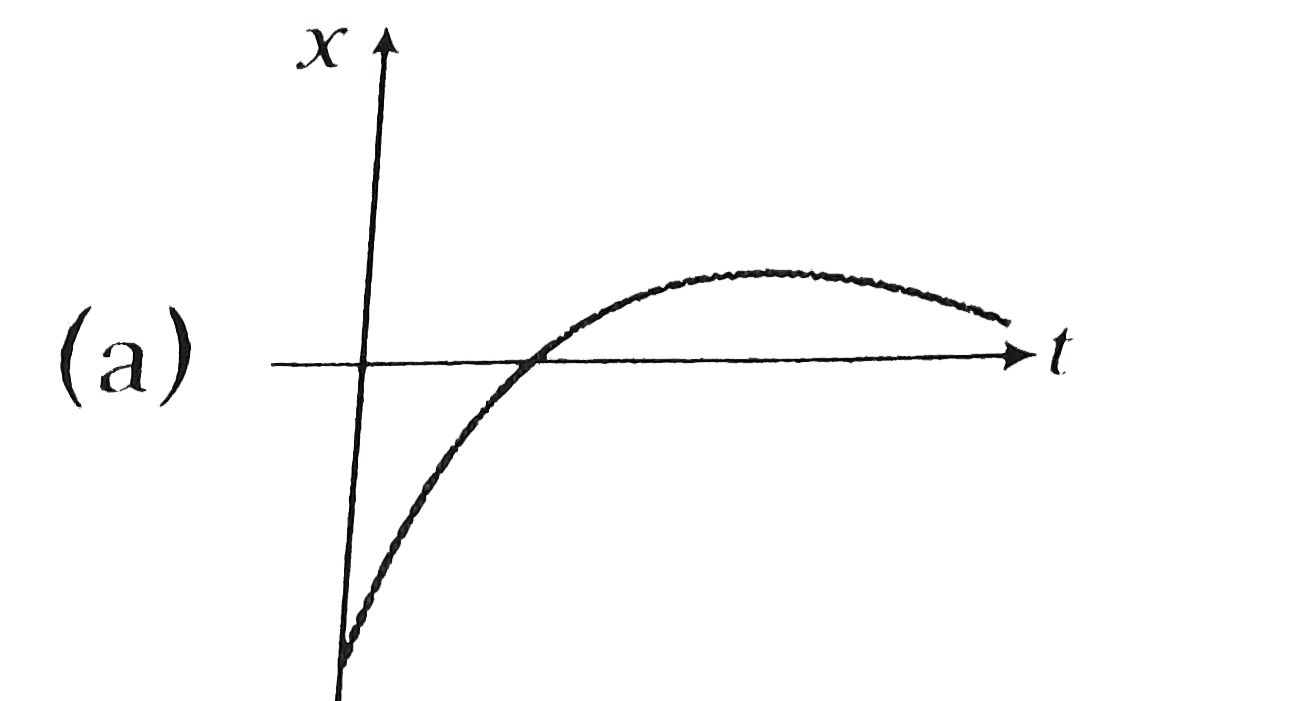
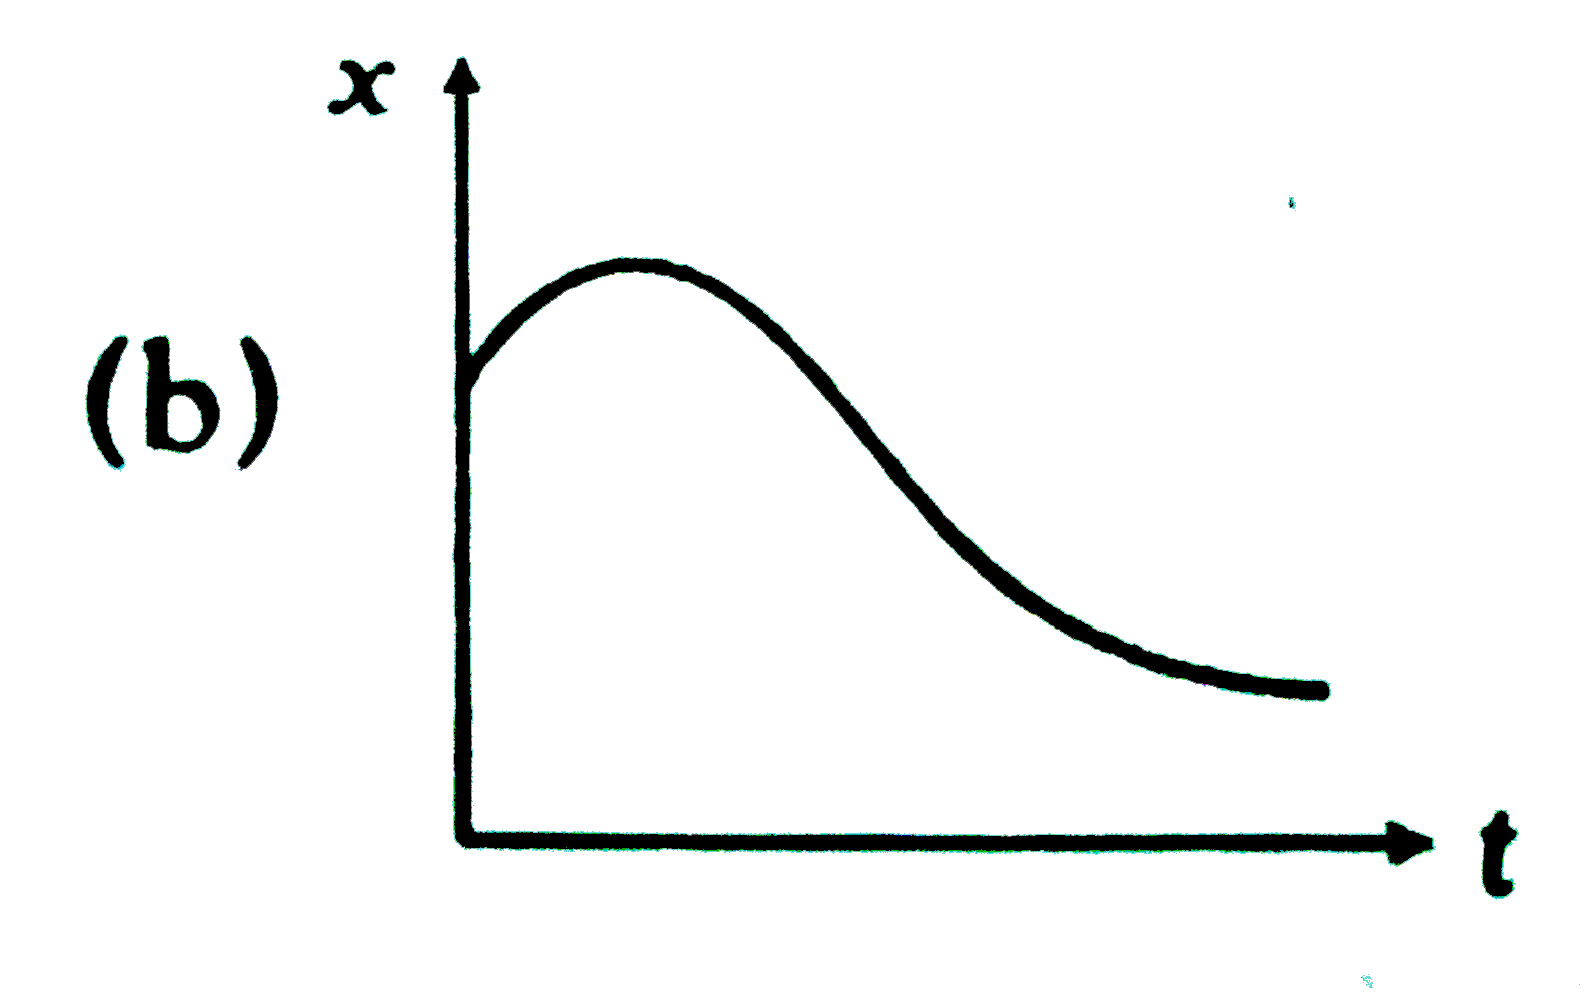
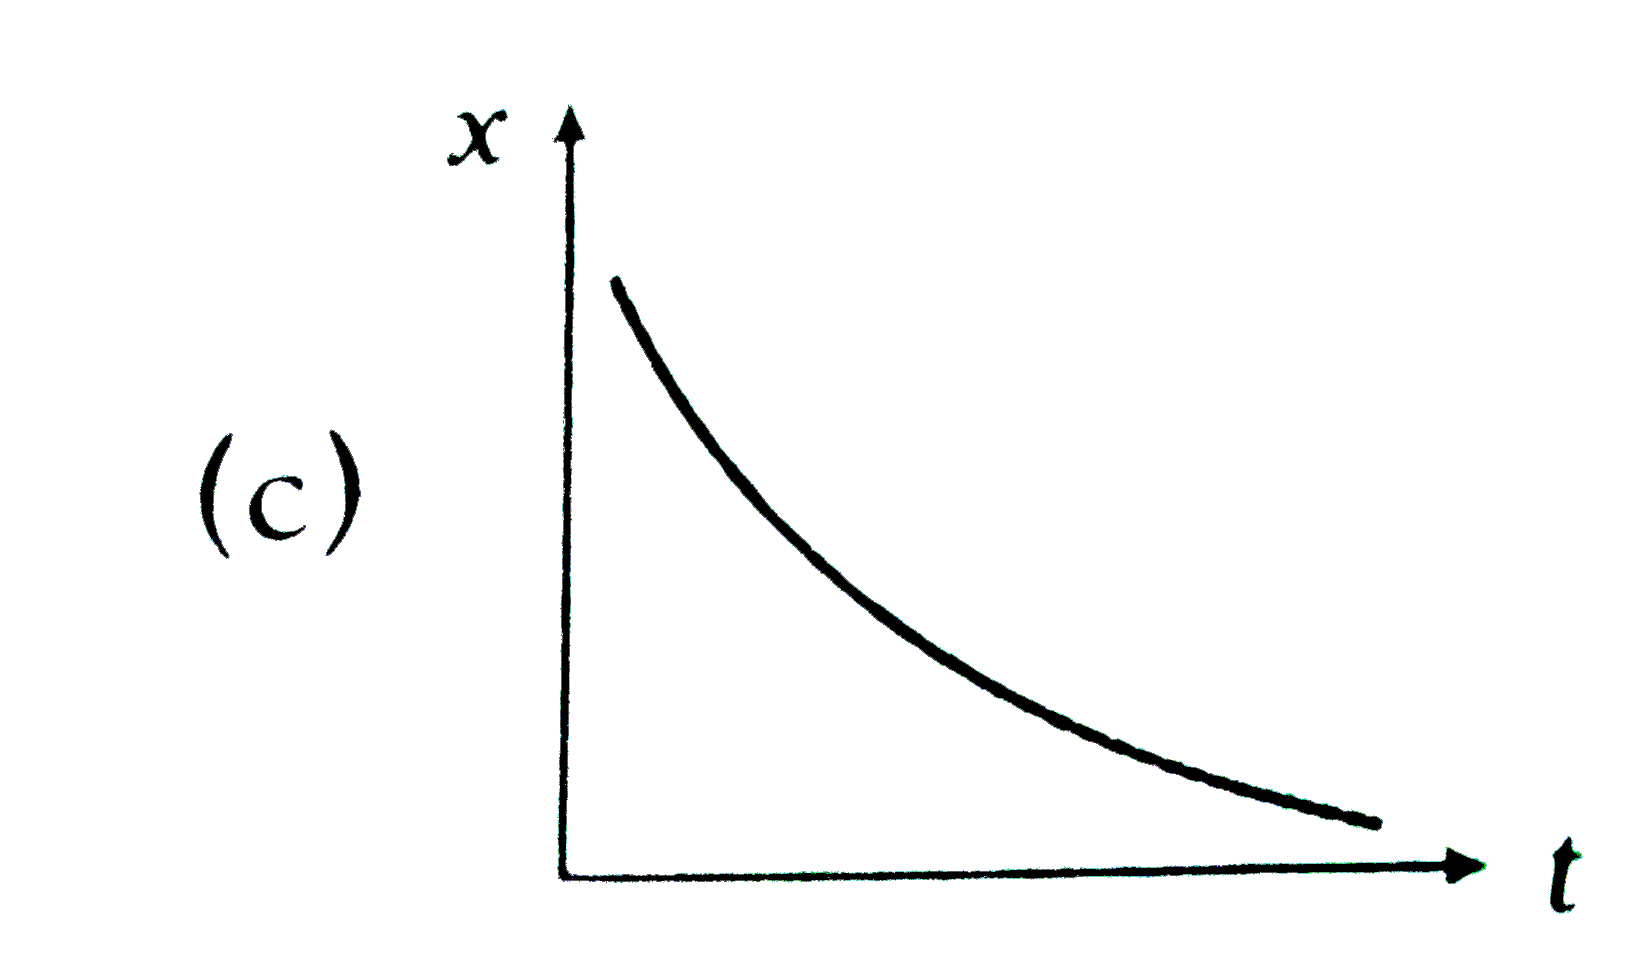
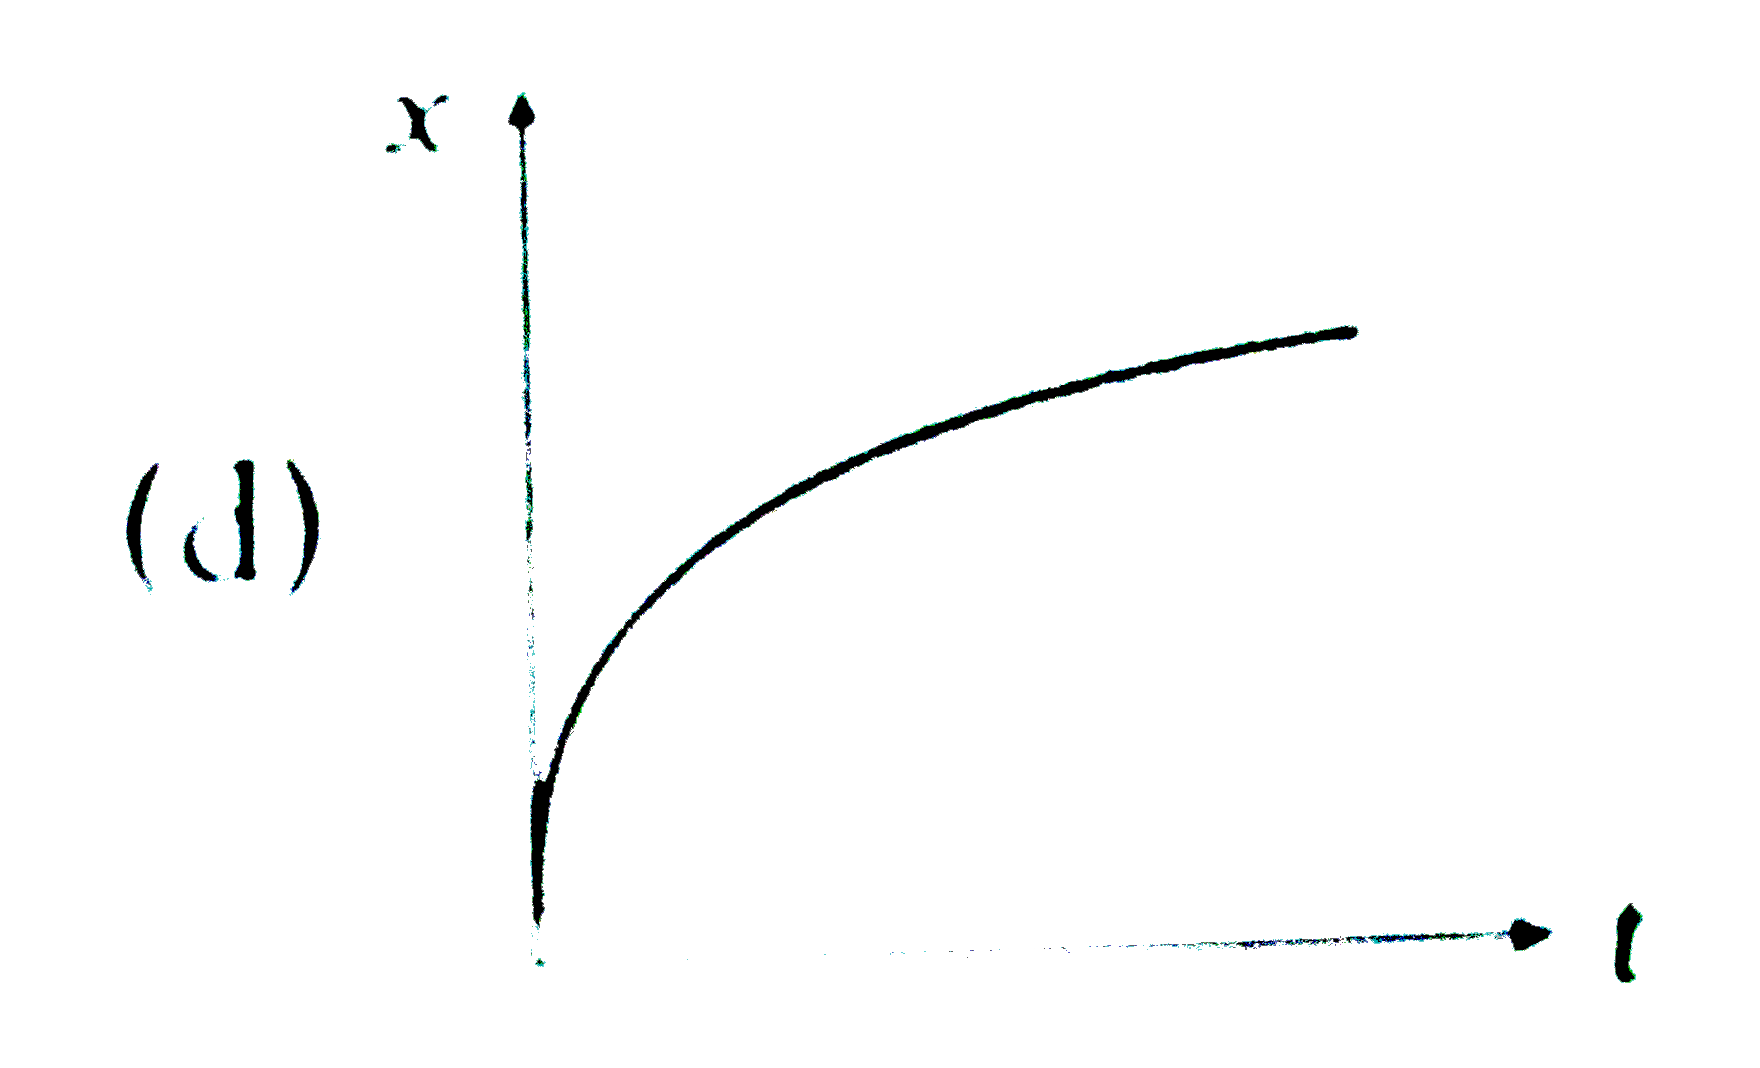
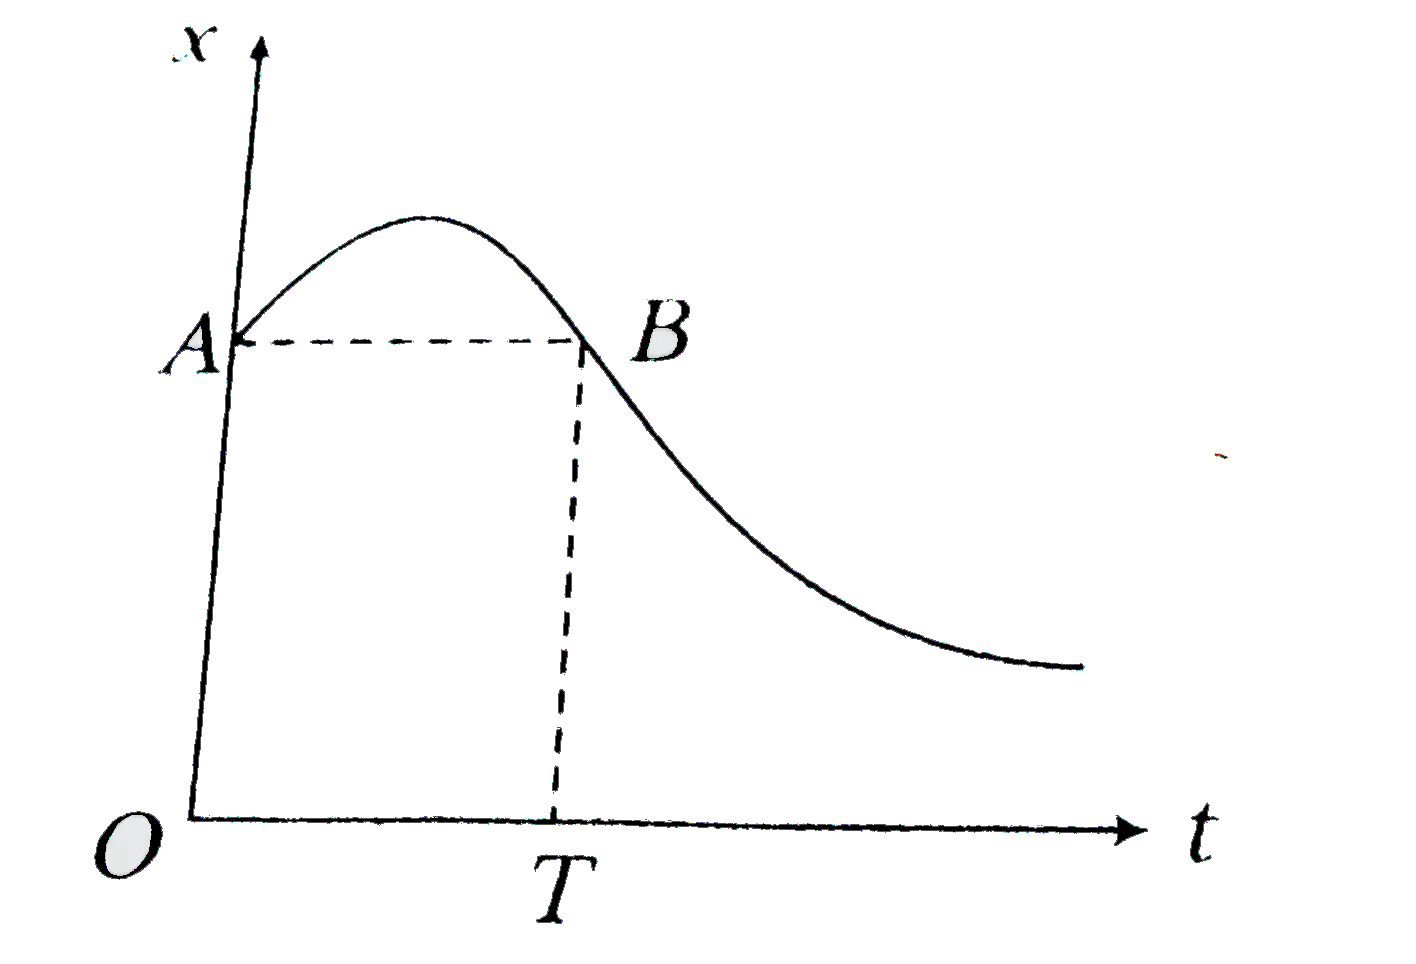
Among the four graphs, there is only one graph for which average velocity over the time interval (0, T) can vanish for a suitably chosen T. Which one is it?
The correct Answer is:B
In graph (b) from for one value of displacement there are two different points of time. Hence, for one time, the average velocity is positive and for other time is equivalent negtive. As there are opposite velocity in the interval 0 to T hence average velocity can vansih in (b). This can be seen in the figure alongside. Here, OA=BT (same displacement) for two different point of time.
Topper's Solved these Questions
- MOTION IN A PLANEBOOK - DC PANDEY ENGLISHCHAPTER - MOTION IN A PLANEEXERCISE - (B) Meical entrance special format questions (Assertion and reason)
19 Videos
- MOTION IN A PLANEBOOK - DC PANDEY ENGLISHCHAPTER - MOTION IN A PLANEEXERCISE - (B) Meical entrance special format questions (Mathch the columns)
6 Videos
- MOTION IN A PLANEBOOK - DC PANDEY ENGLISHCHAPTER - MOTION IN A PLANEEXERCISE - Check point 3.7
15 Videos
- MOTIONBOOK - DC PANDEY ENGLISHCHAPTER - MOTIONEXERCISE - Medical entrances gallery
19 Videos
- PROJECTILE MOTIONBOOK - DC PANDEY ENGLISHCHAPTER - PROJECTILE MOTIONEXERCISE - Level - 2 Subjective
10 Videos
Similar Questions
Among the four graphs shown in the figure there is only one graph for which average velocity over the time interval (0,T) can vanish for a suitably chosen T. Which one is it ?
View SolutionAmong the four graphs, there is only one graph for which average velocity over the time interval (0, T) can vanish for a suitably chosen T. Which one is it?
View Solution
Knowledge Check
Among the four graphs shown in the figure there is only one graph for which average velocity over the time interval (0,T) can vanish for a suitably chosen T. Which one is it ?
A B
B C
C D
D
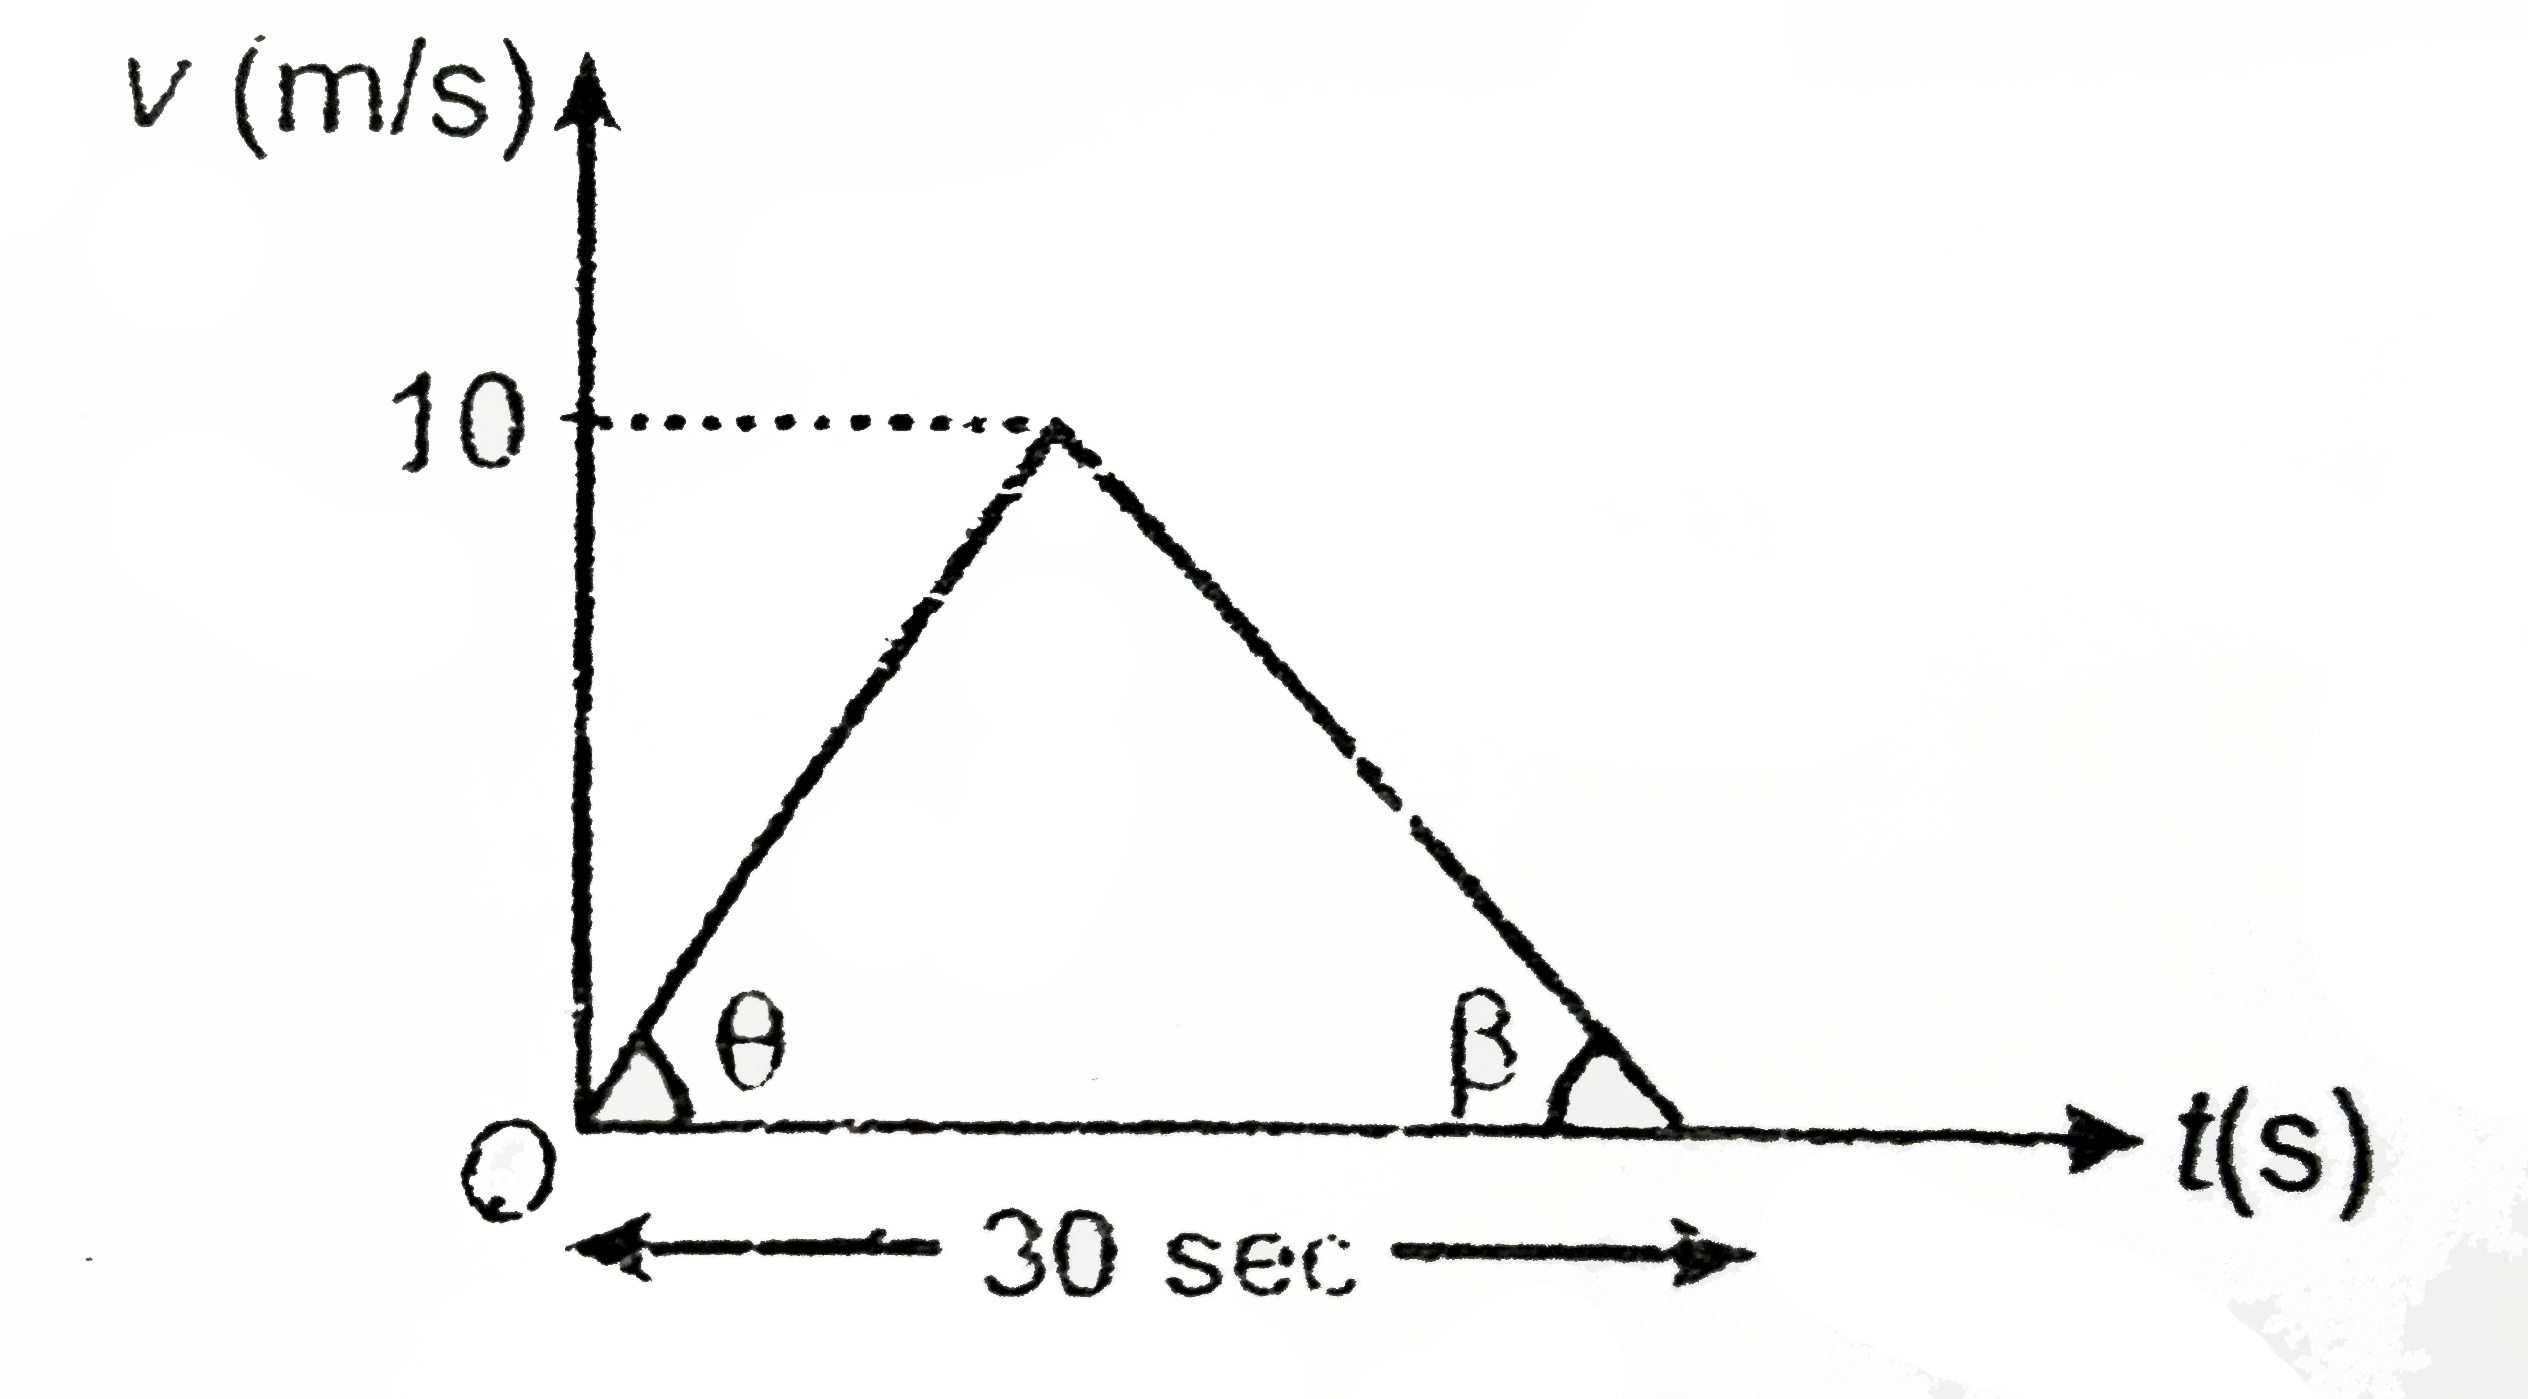
A particle obeys the following v - t graph as shown. The average velocity over 30 s is
View SolutionFor which of the following graphs the average velocity of a particl moving along a straight line for time interval (0,t) must be negative−
View SolutionFor which of the following graphs the average velocity of a particle moving along a straight line for time interval (0,t) must be negative−
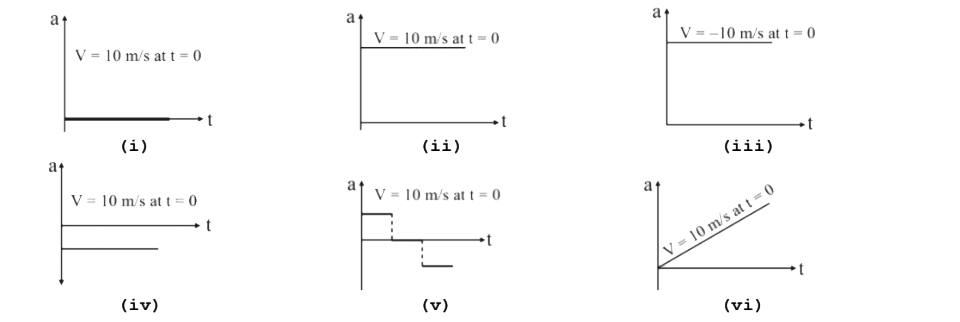
View SolutionDraw the v-t graphs for the given a-t graphs for a particle moving in one dimension.
View SolutionThe v-t graph for a particle moving along x-axis is shown in the figure, find
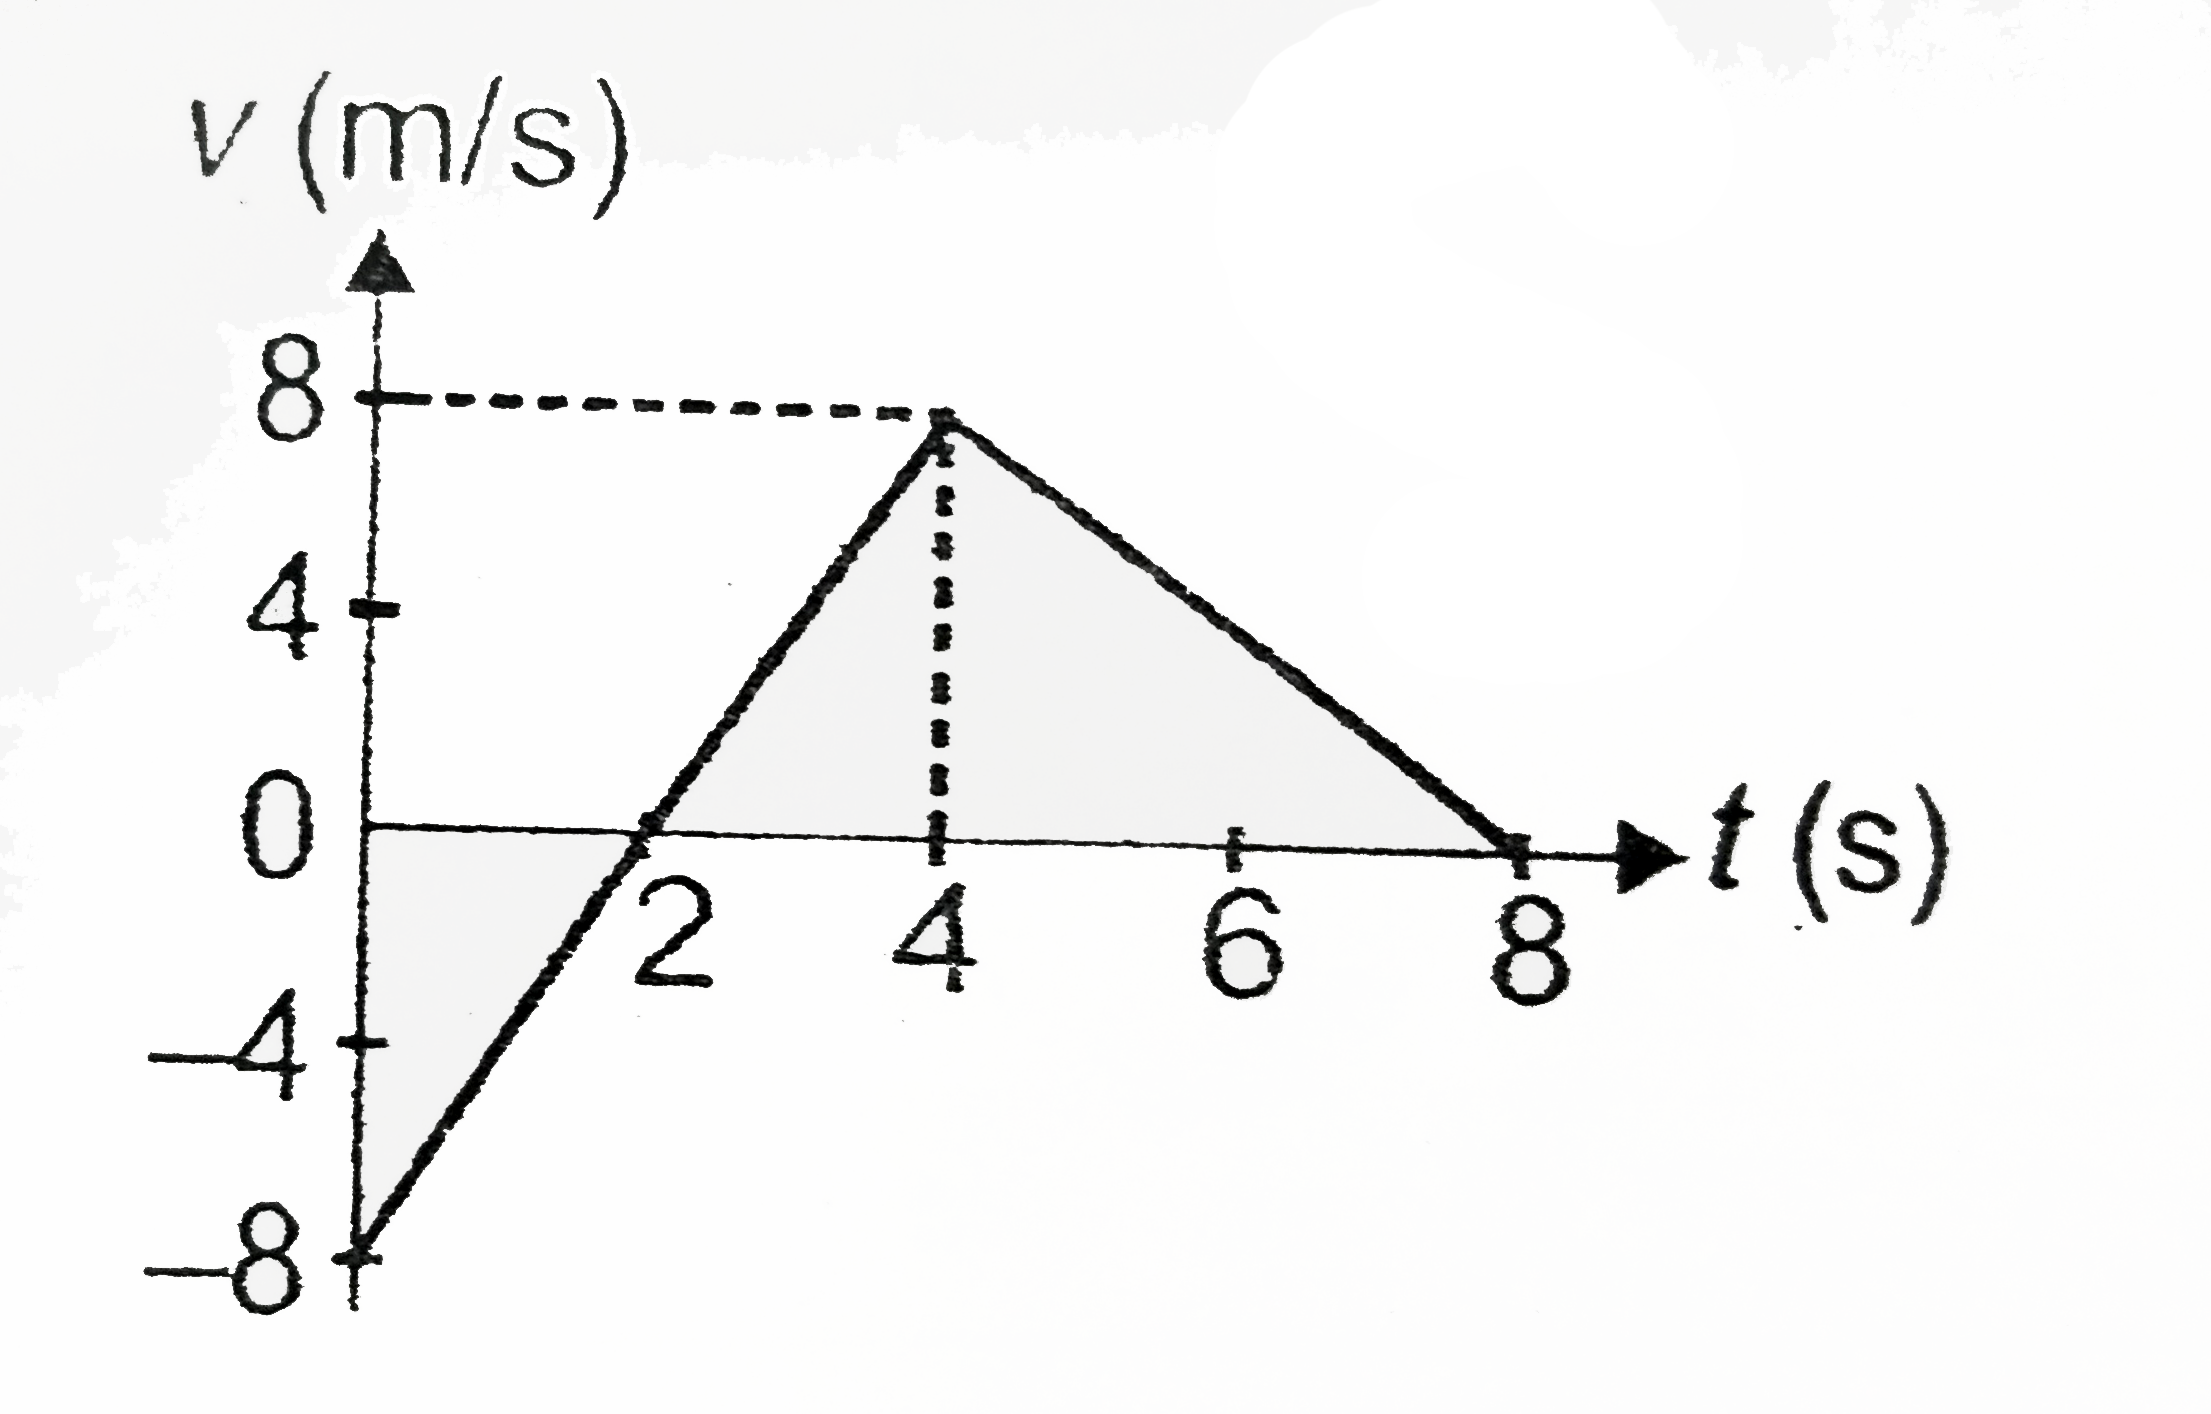
(a) Average velocity in the interval 0 to 8 s.
(b) Average speed in the interval 0 to 8 s.
(c) Average acceleration in the interval 0 to 4 s.
(d) Instantaneous acceleration at t = 2.5 s.
View SolutionAssertion : In the υ−t diagram as shown in figure, average velocity between the interval t = 0 and t=t0 is independent of t0
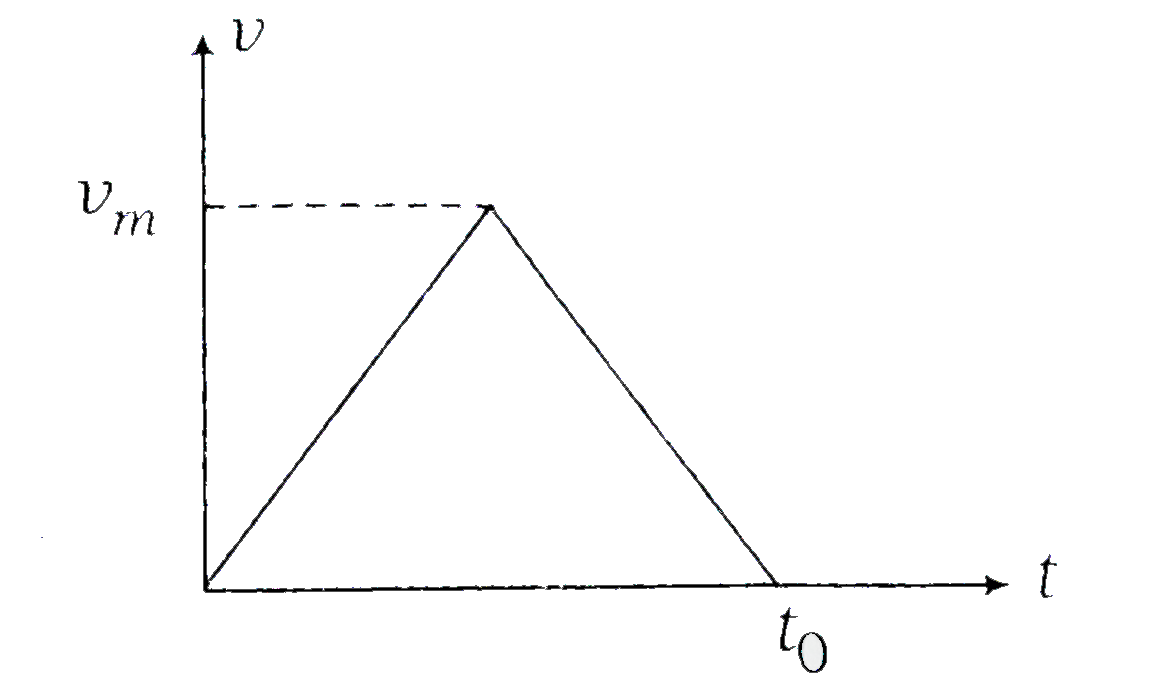
Reason : Average velocity in the given interval is 12υm.
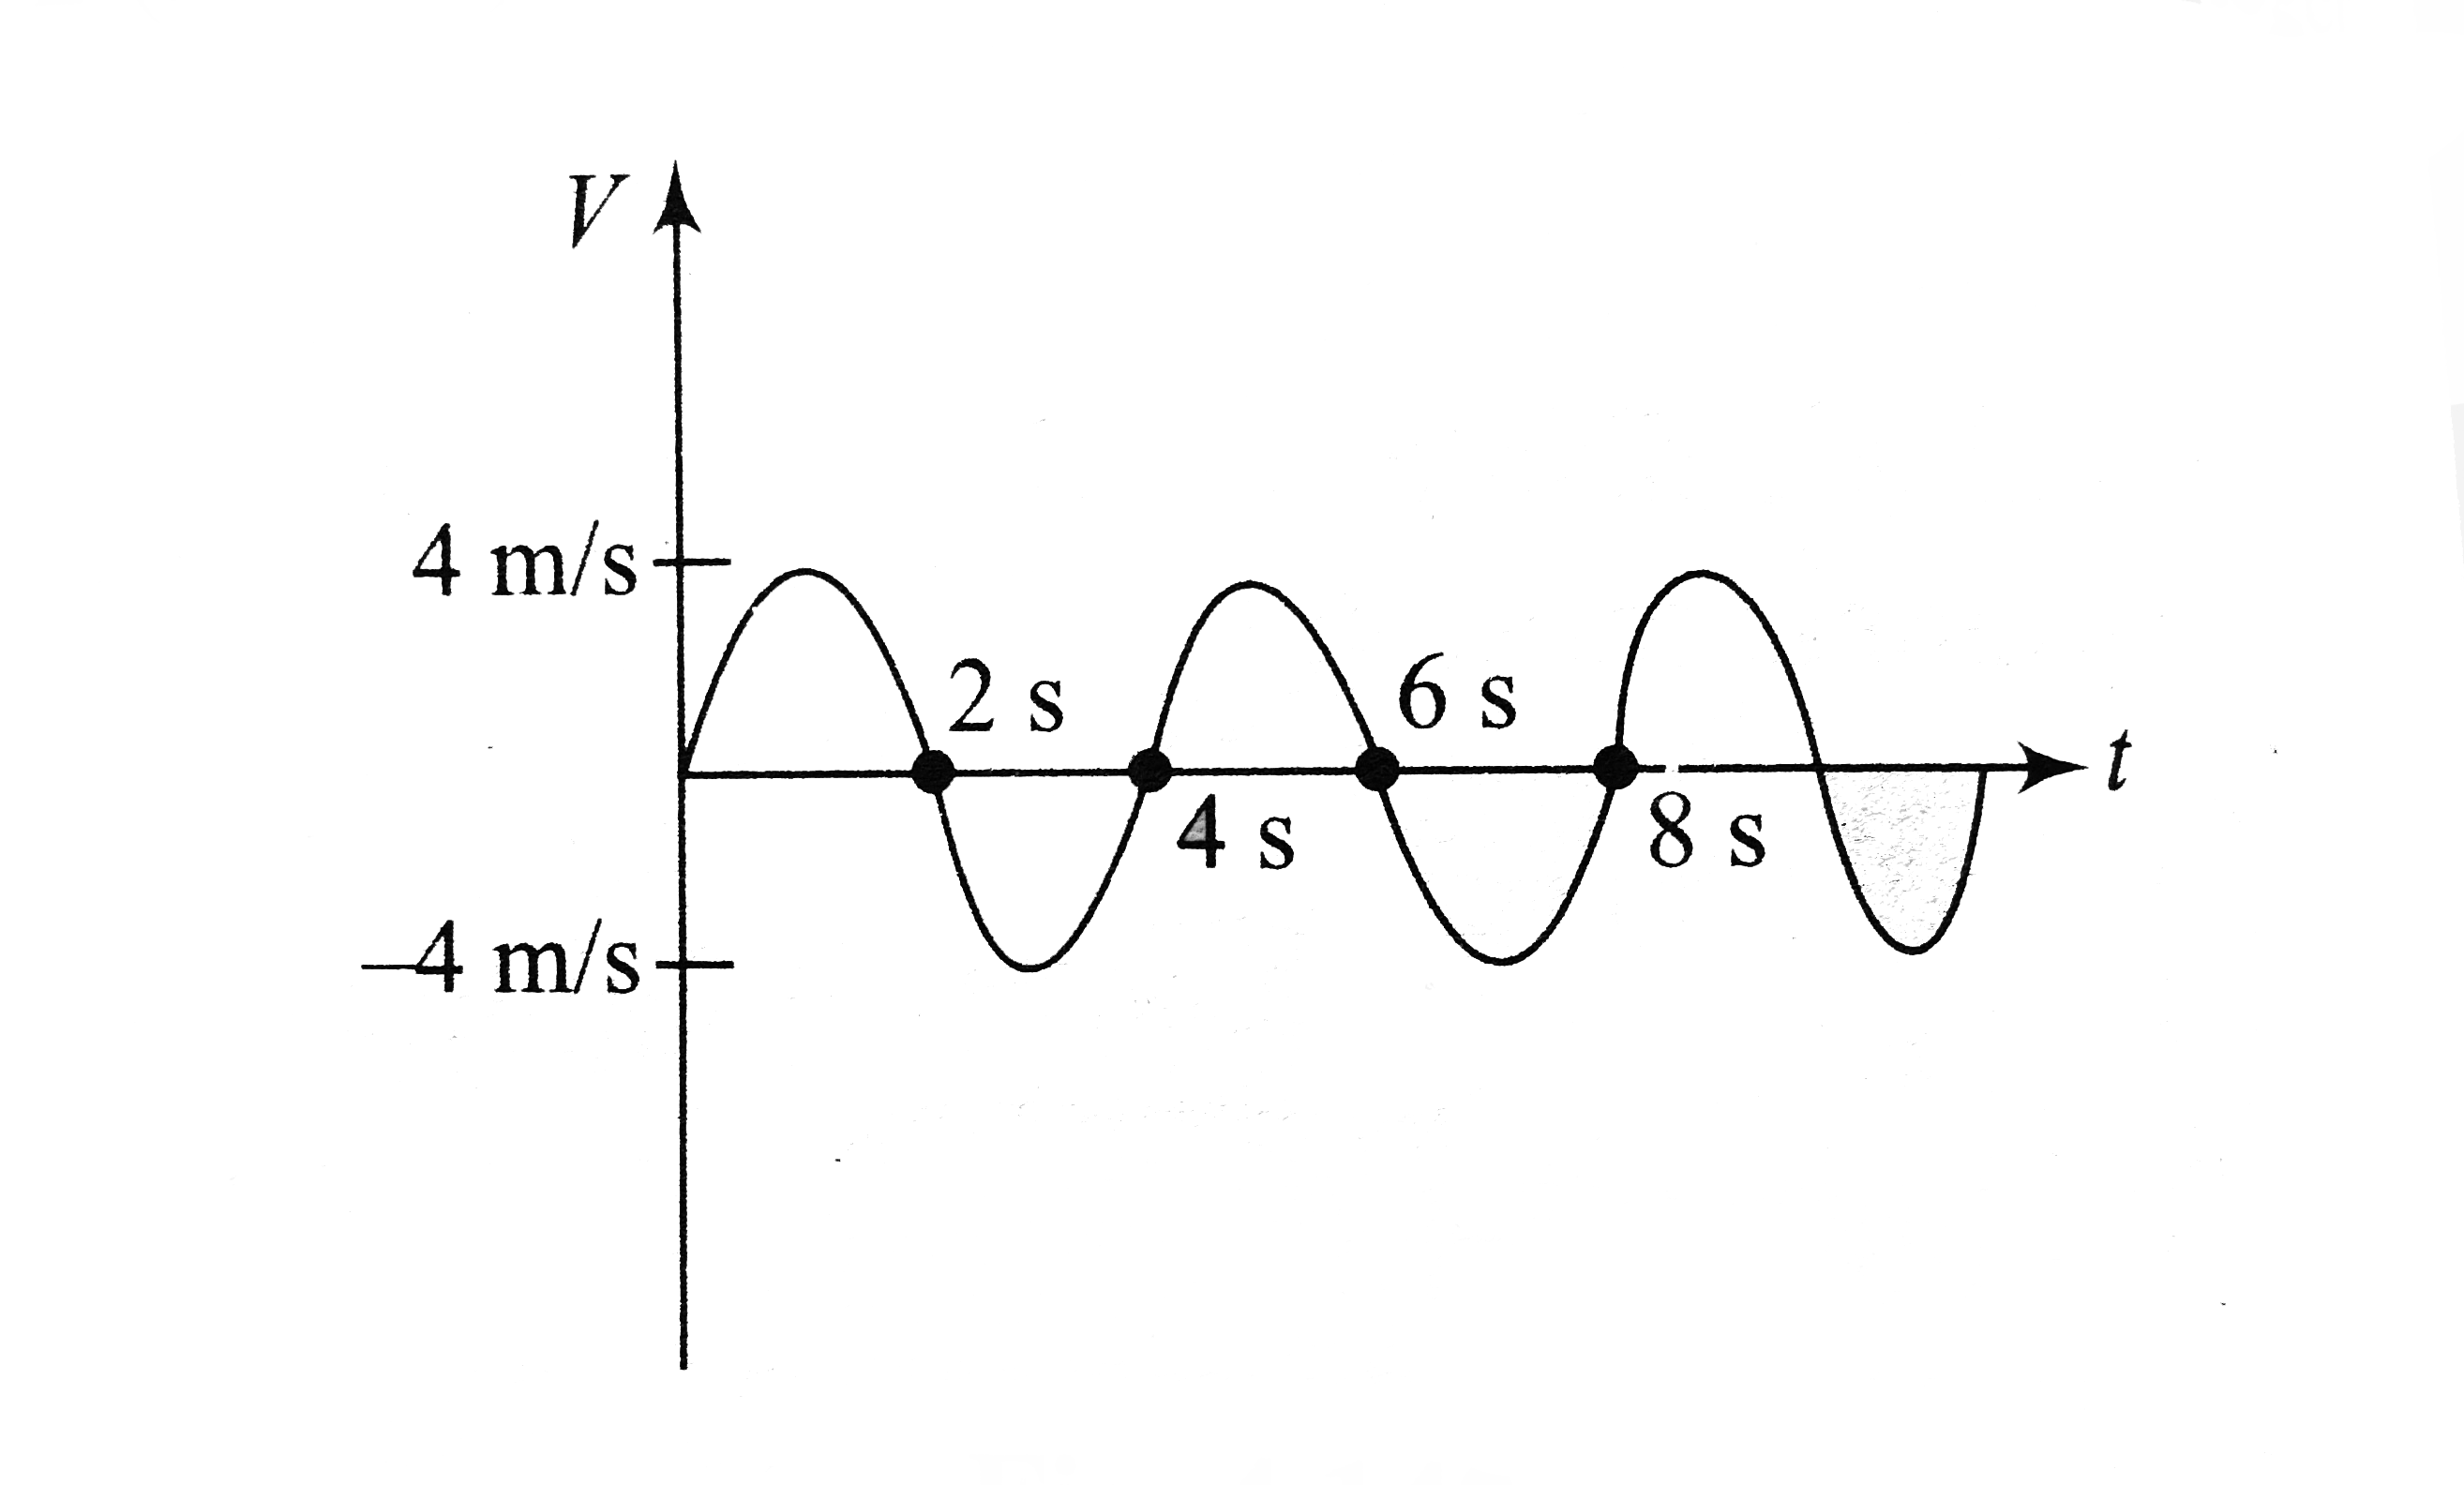
View SolutionIf velocity of a partical moving along a straight line changes sinusoidally with time as shown in given graph. Find the average speed over time interval t=0 to t=2(2n−1) second, n being any positive interget.
View Solution
