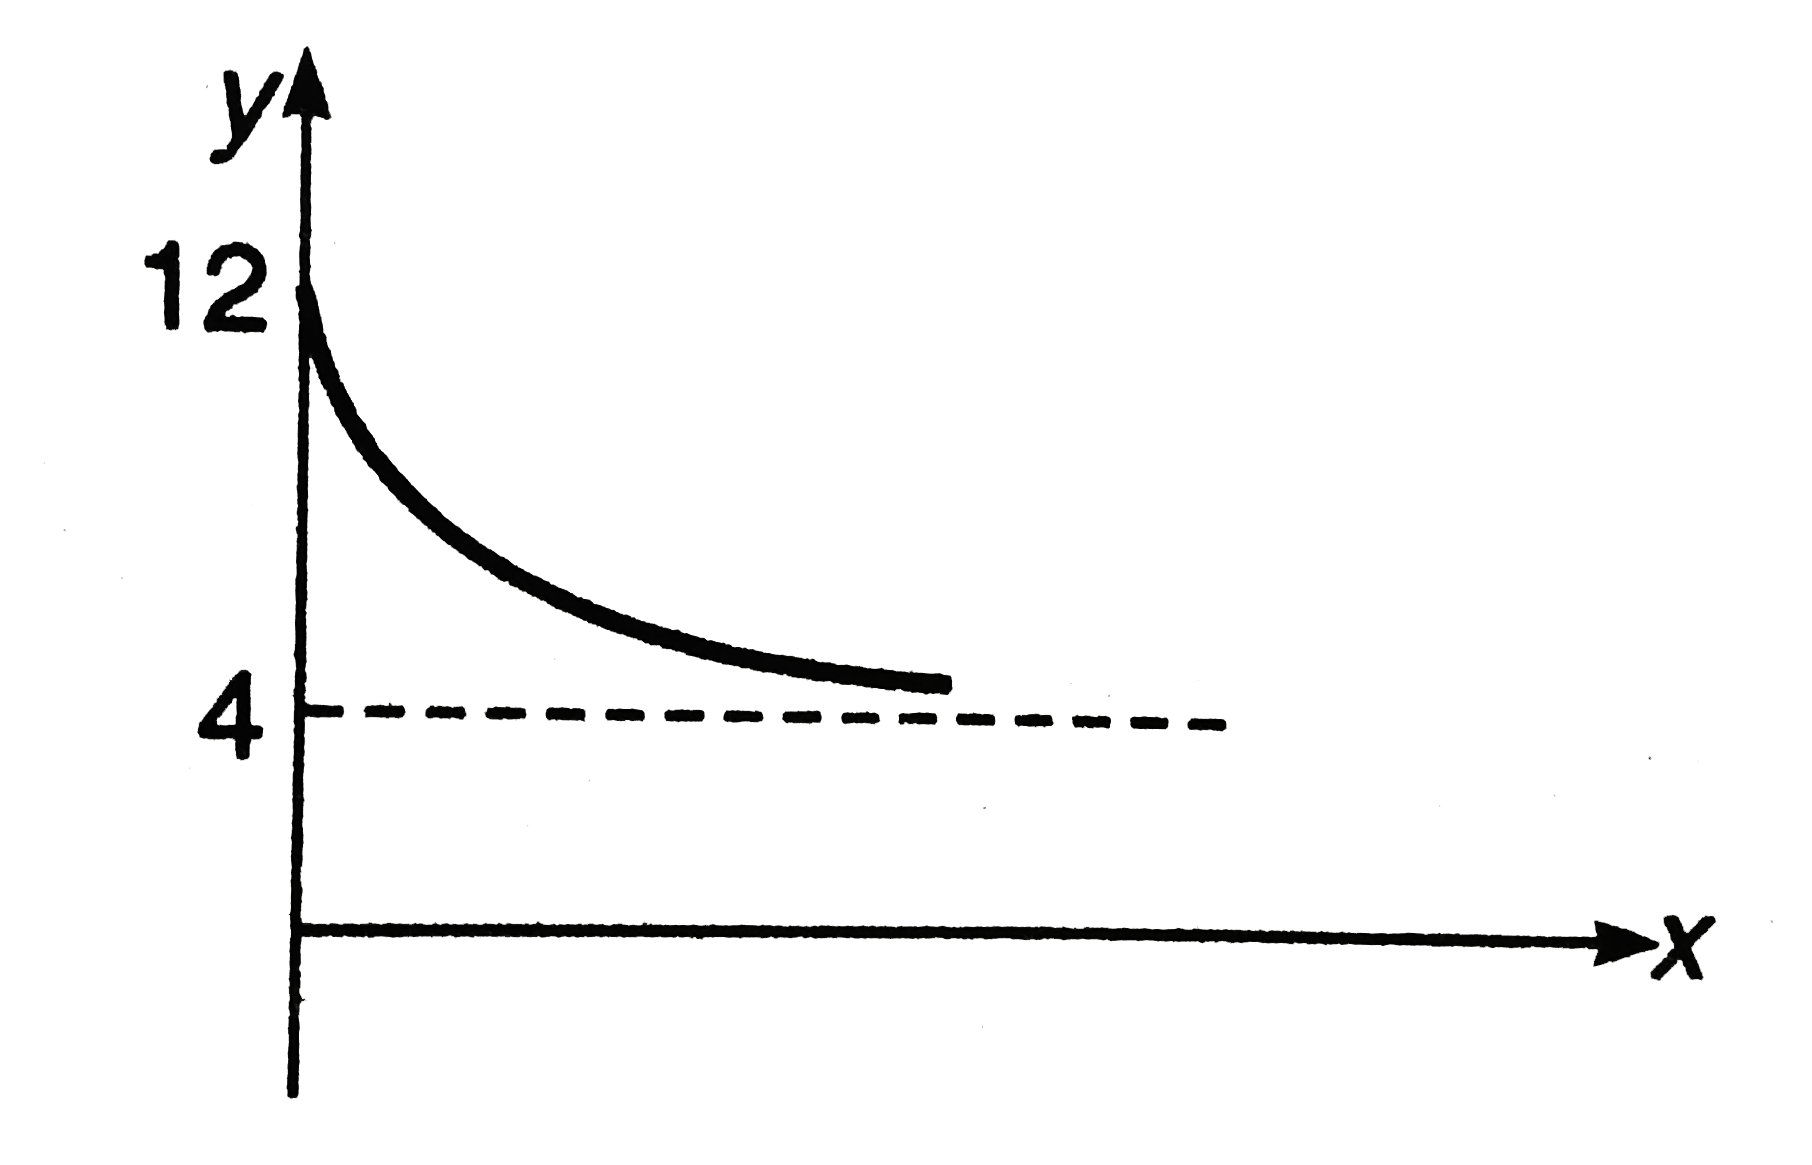
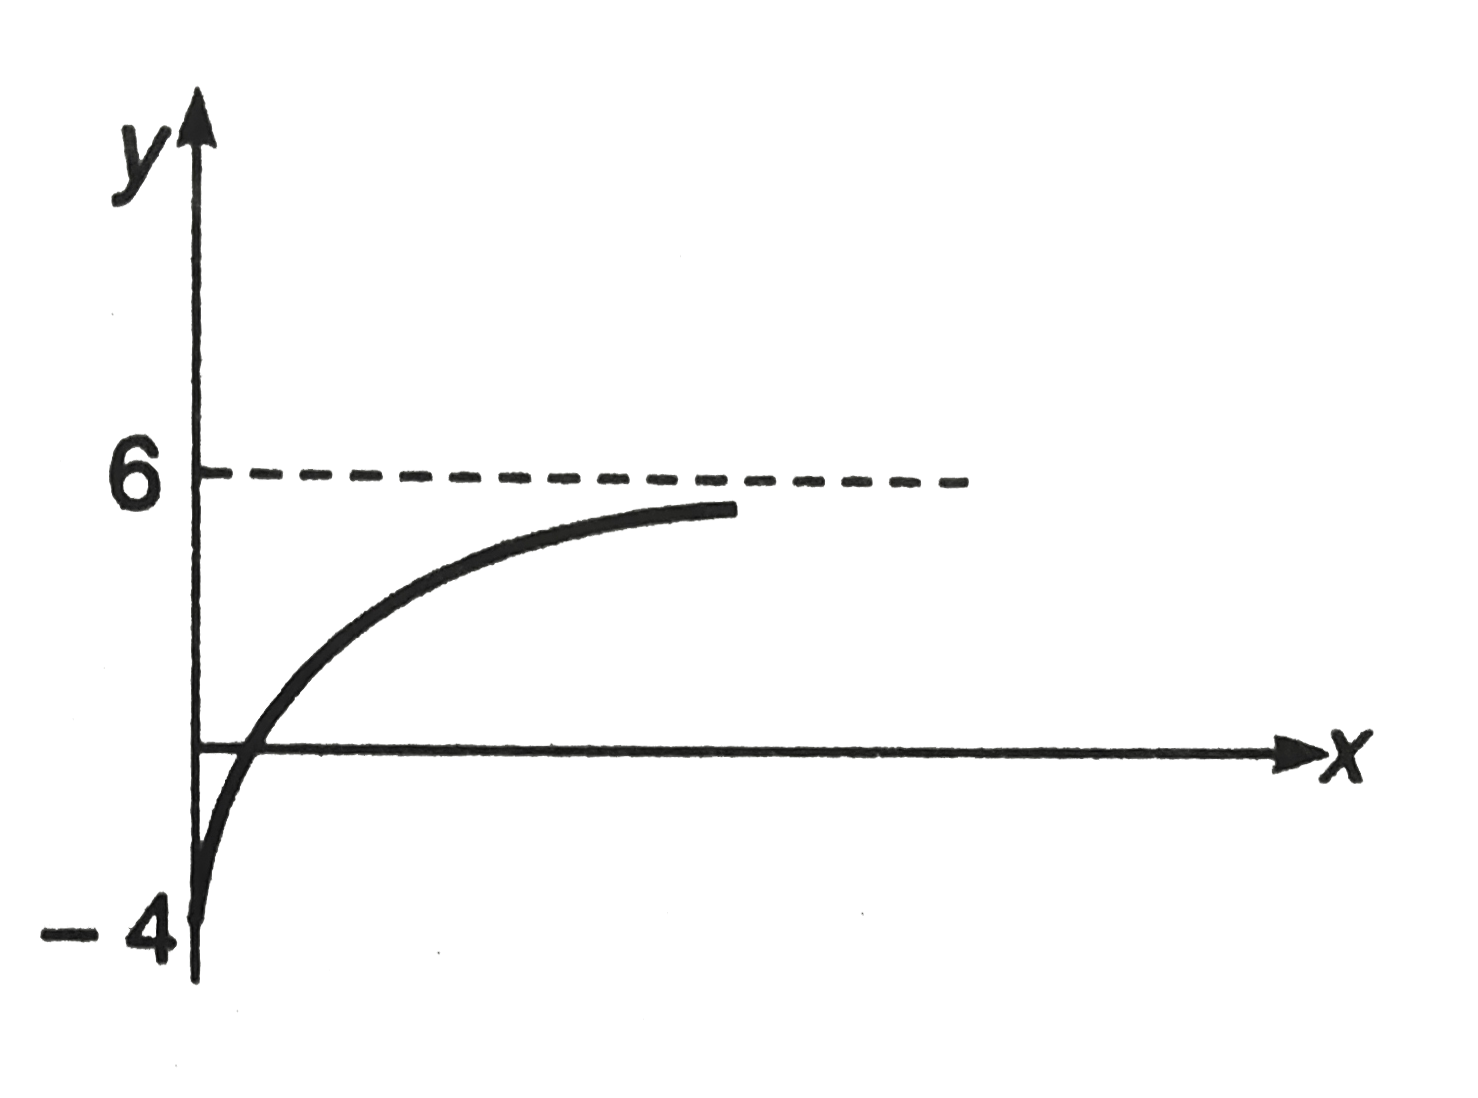
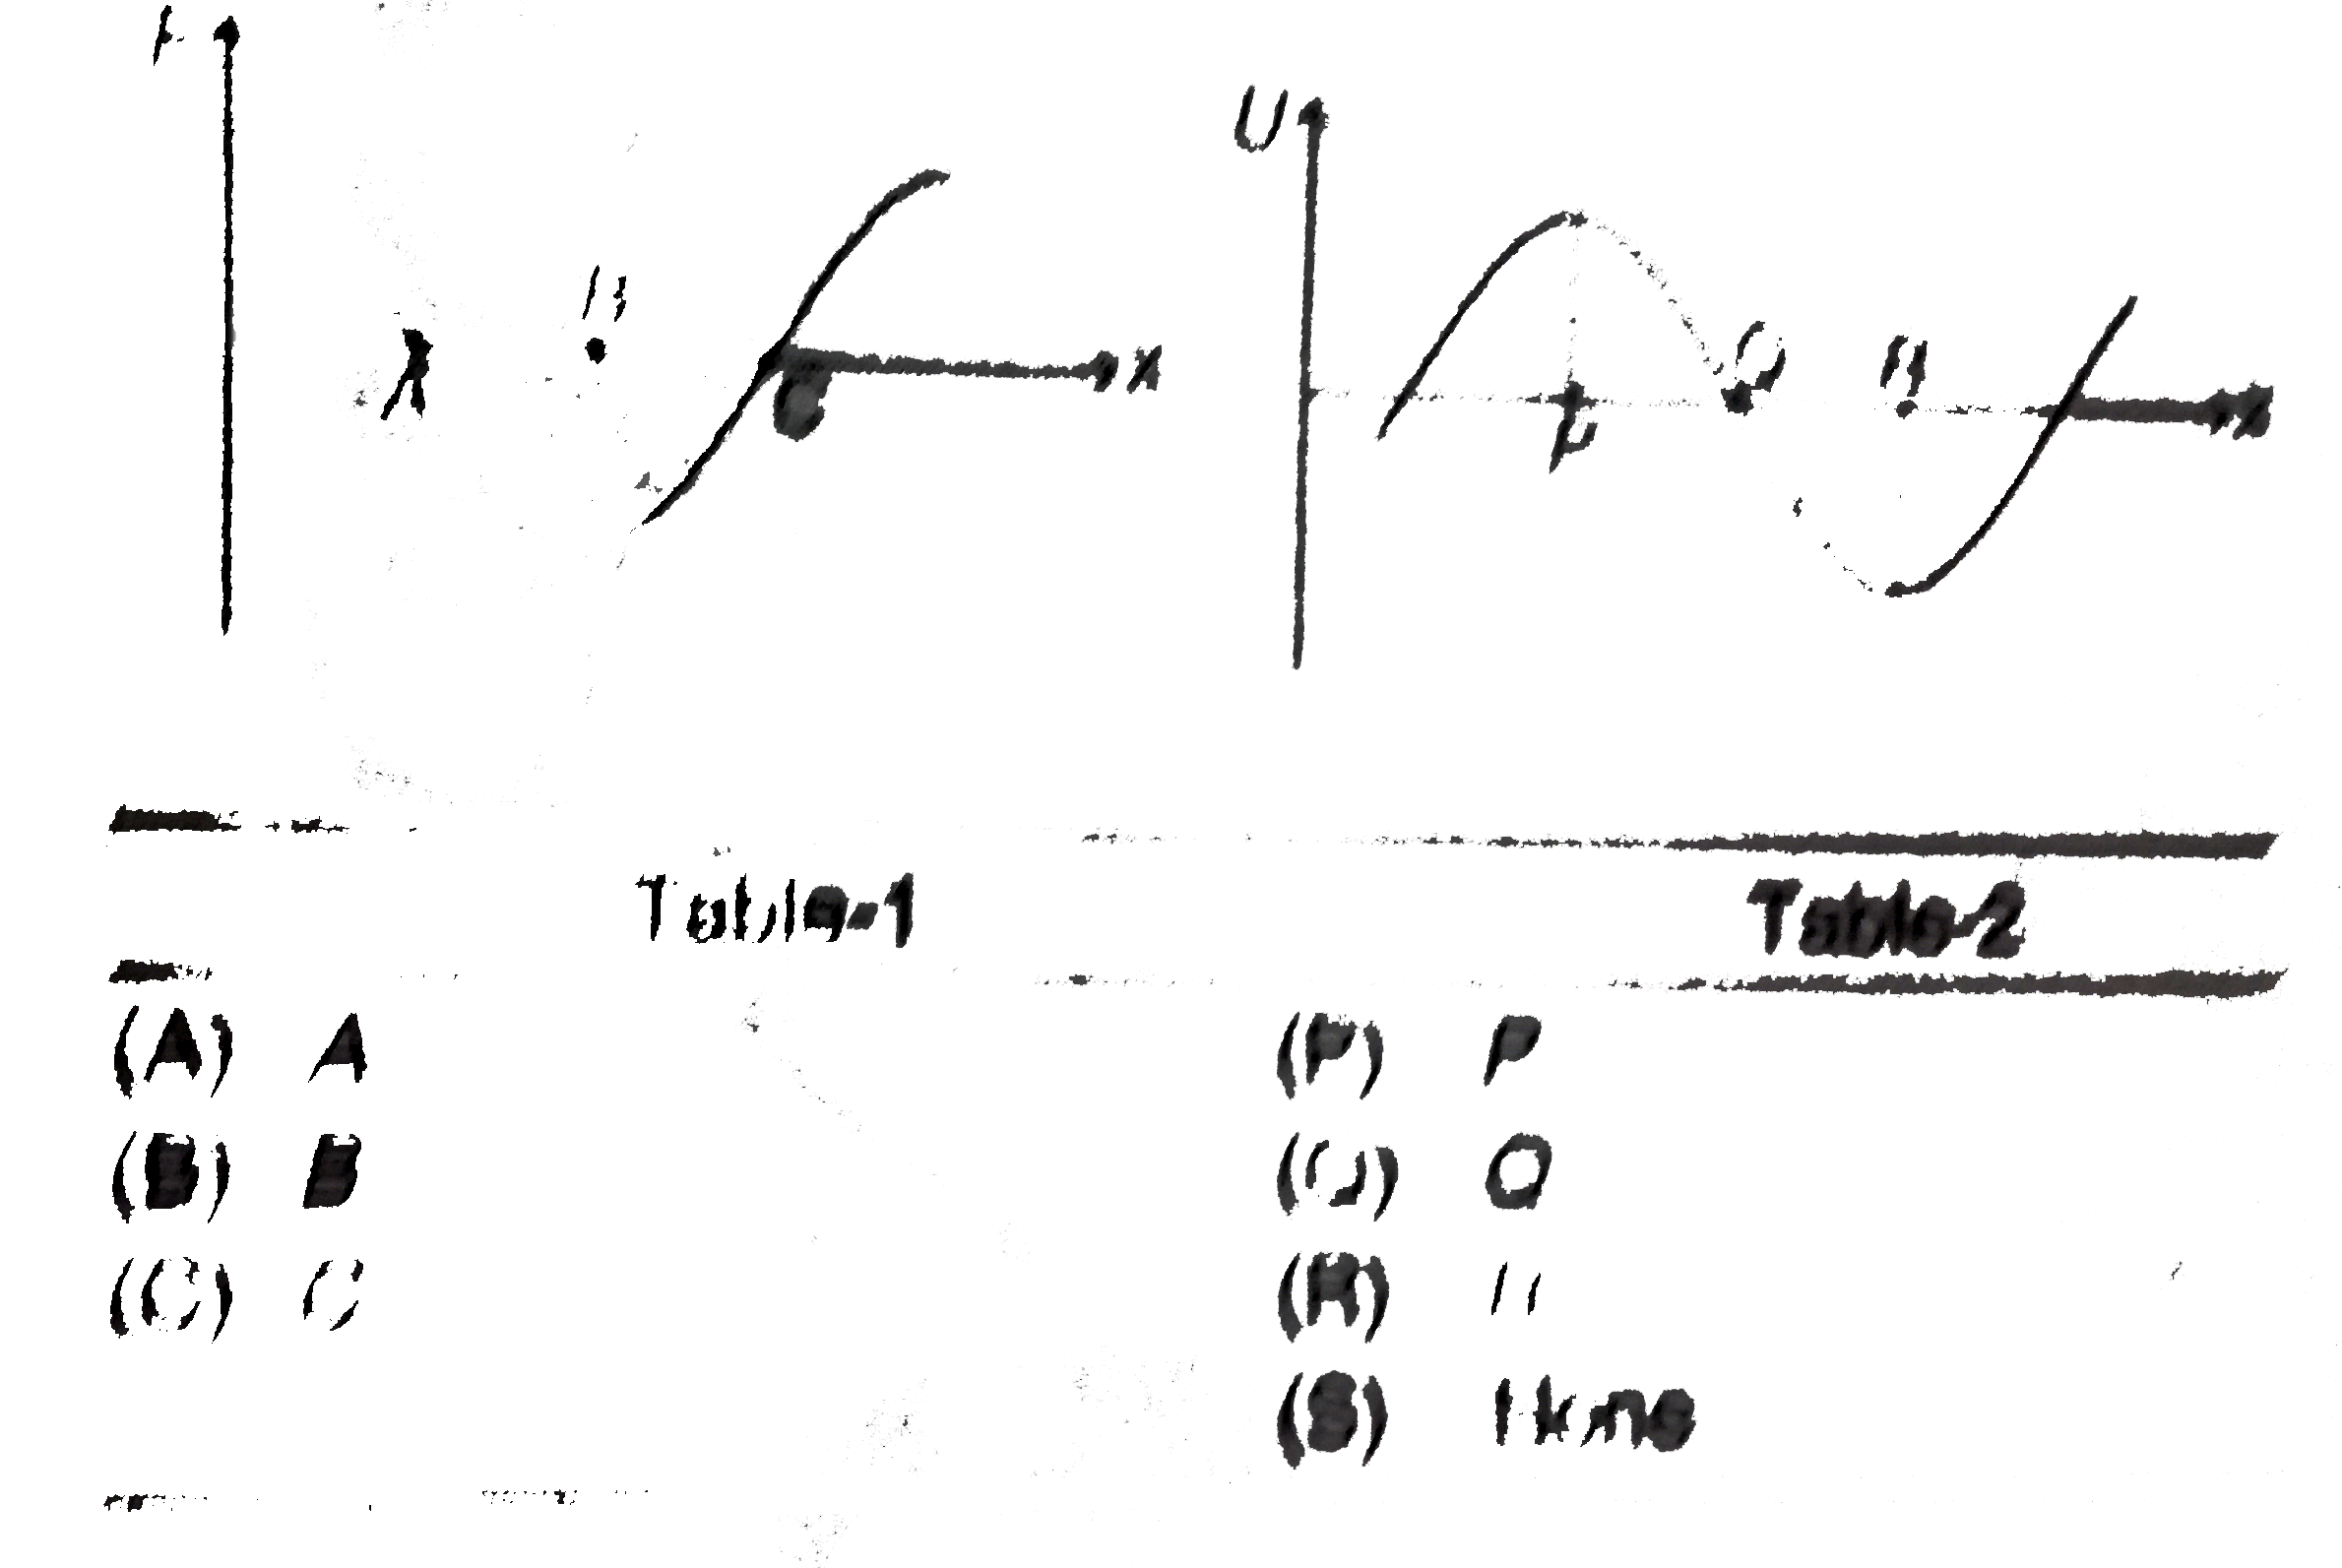
F-x and corresponding U-x graphs are as shown in figure. Three point A, B and C in F-x graph may be corresponding to P, Q and R in the U-x graph. Match the following
Video Solution
Text Solution
The correct Answer is:(A→r,B→s,C→p)
A is the point of stable equilibrium, so potential energy is minimum. Similarly, point C is the unstable equilibrium position, where potential energy should be maximum.
|
Topper's Solved these Questions
- WORK, ENERGY AND POWERBOOK - DC PANDEY ENGLISHCHAPTER - WORK, ENERGY AND POWEREXERCISE - MEDICAL ENTRACES GALLERY
33 Videos
- WORK, ENERGY AND POWERBOOK - DC PANDEY ENGLISHCHAPTER - WORK, ENERGY AND POWEREXERCISE - MEDICAL ENTRANCE SPECIAL QUESTIONS
16 Videos
- WORK, ENERGY & POWERBOOK - DC PANDEY ENGLISHCHAPTER - WORK, ENERGY & POWEREXERCISE - Level 2 Comprehension Based
2 Videos
- WORK, POWER AND ENERGYBOOK - DC PANDEY ENGLISHCHAPTER - WORK, POWER AND ENERGYEXERCISE - E Integer Type Questions
11 Videos
Similar Questions
Knowledge Check
The point (2,−1) on the graph y=f(x) is shifted to which point on the graph of y=f(x+2)?
A(4,1)B(4,−1)C(0,−1)D(0,−3)
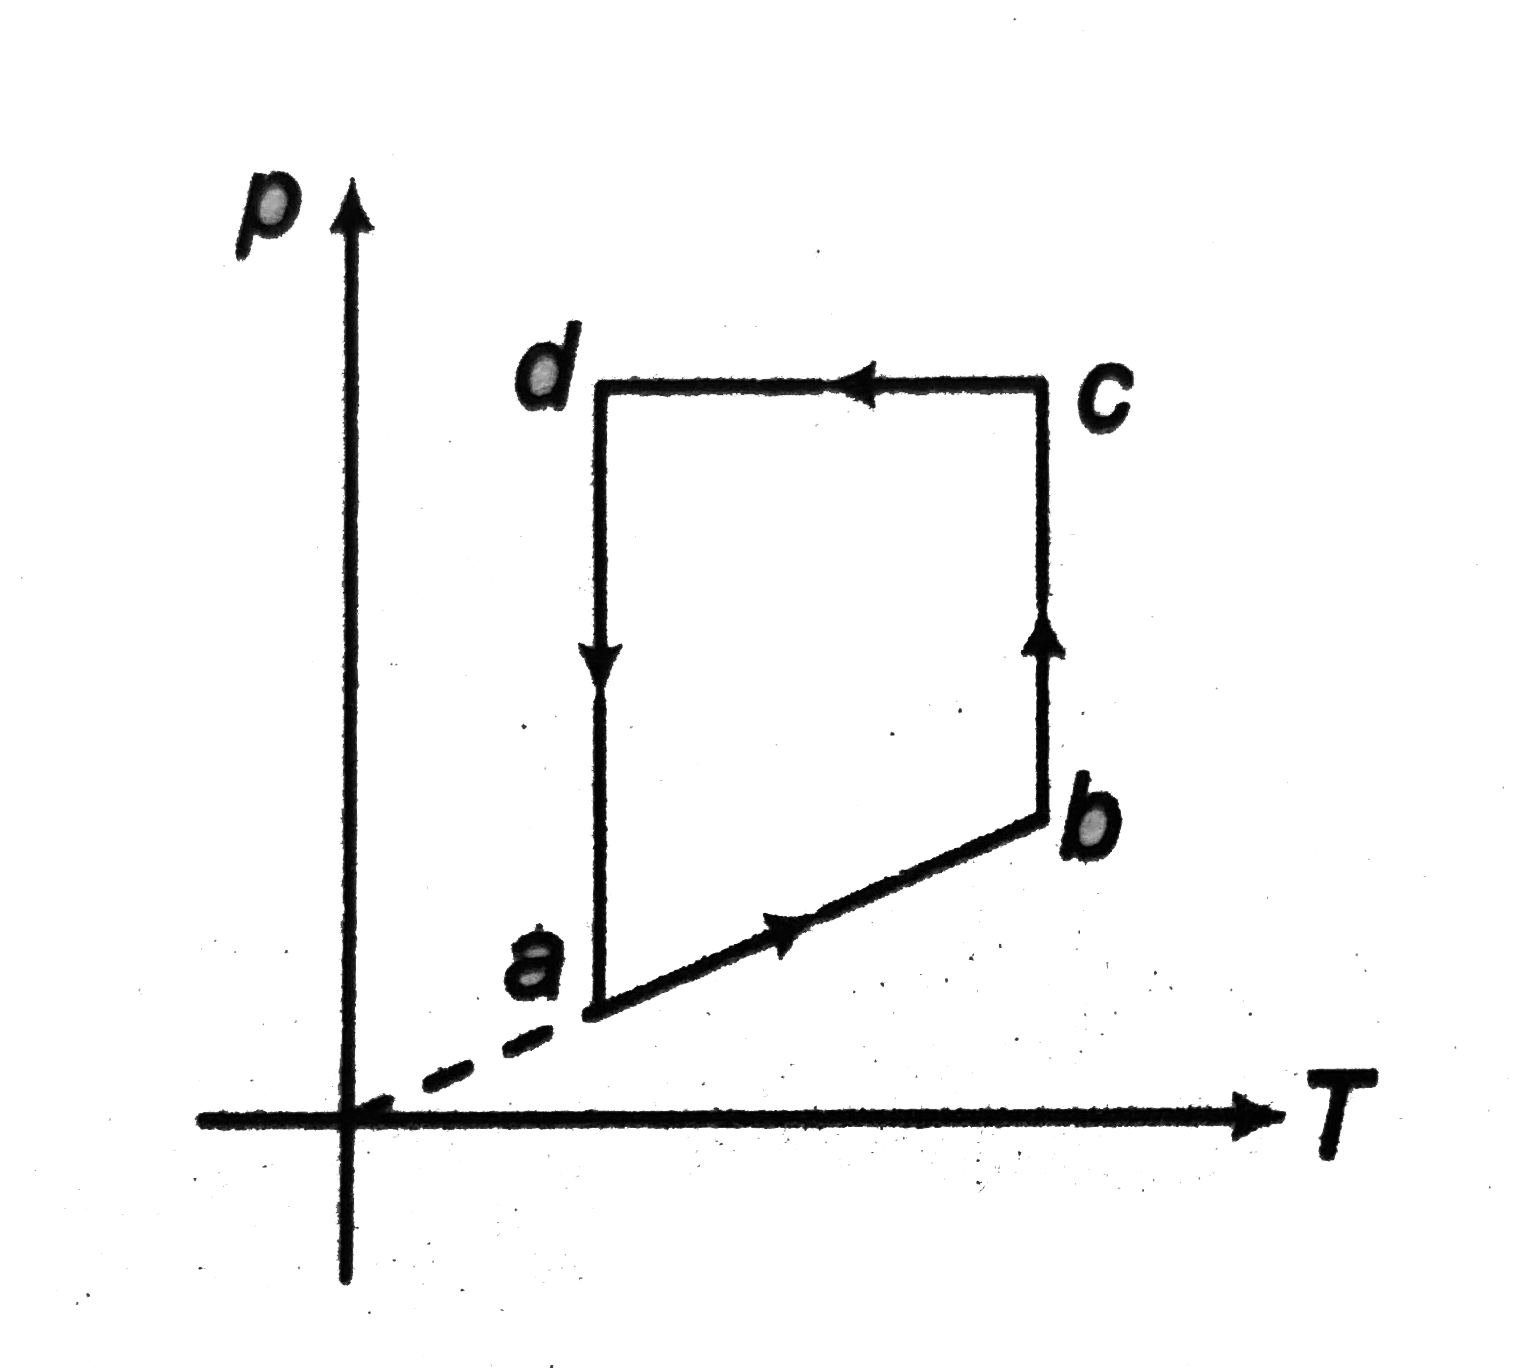
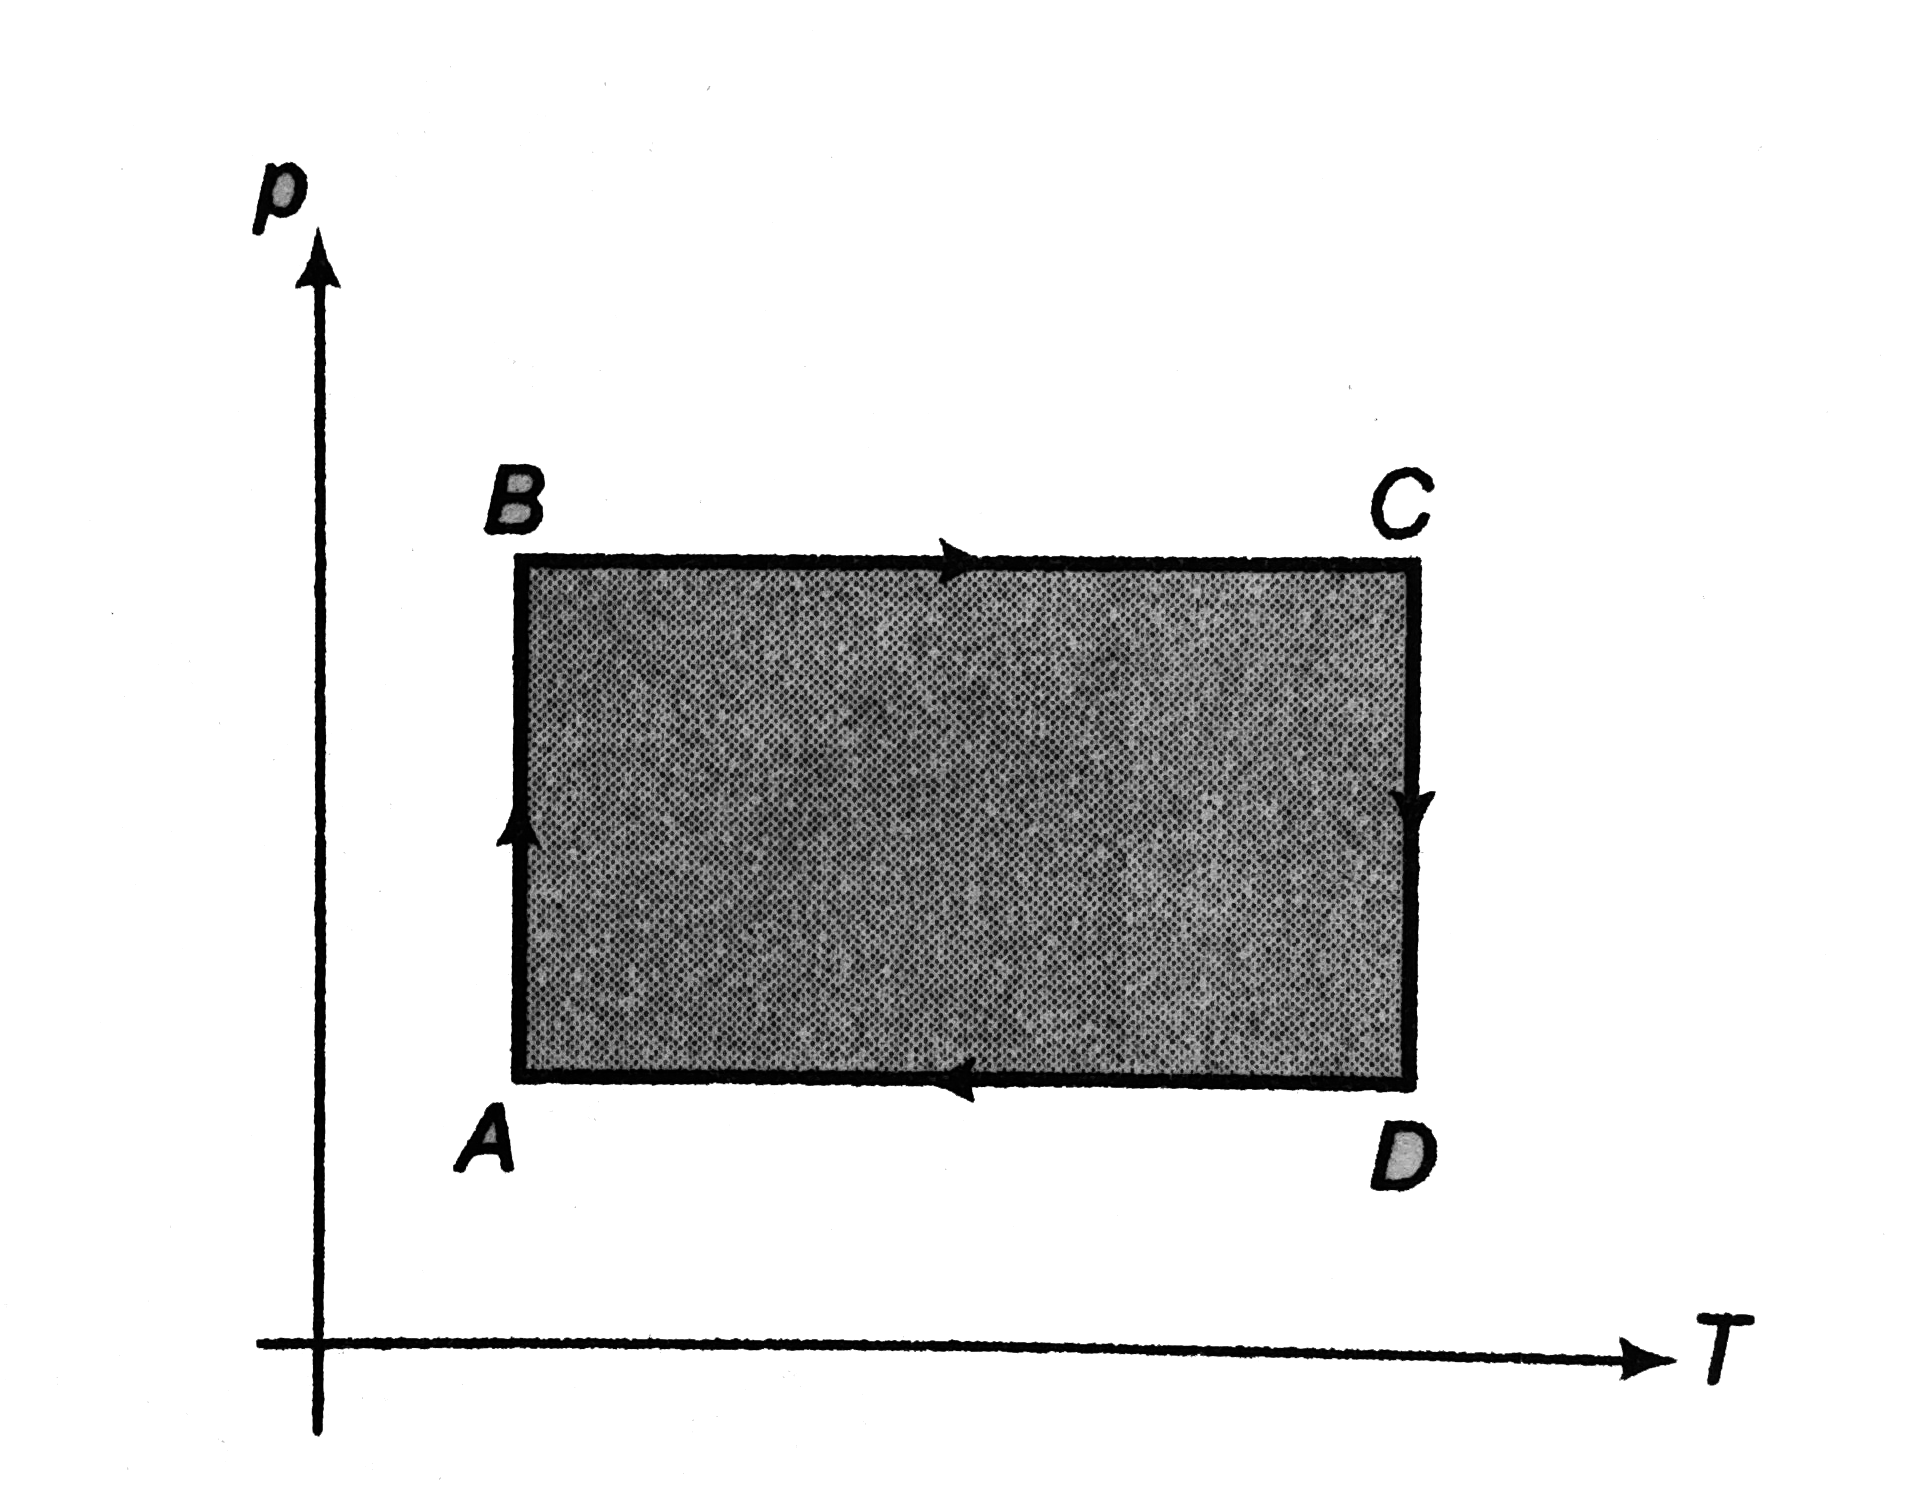
Corresponding to (p - T) graph as shown in figure, draw
(a) P - V graph
(b) V - T graph
( c) ρ - T graph and
(d) U - T graph.
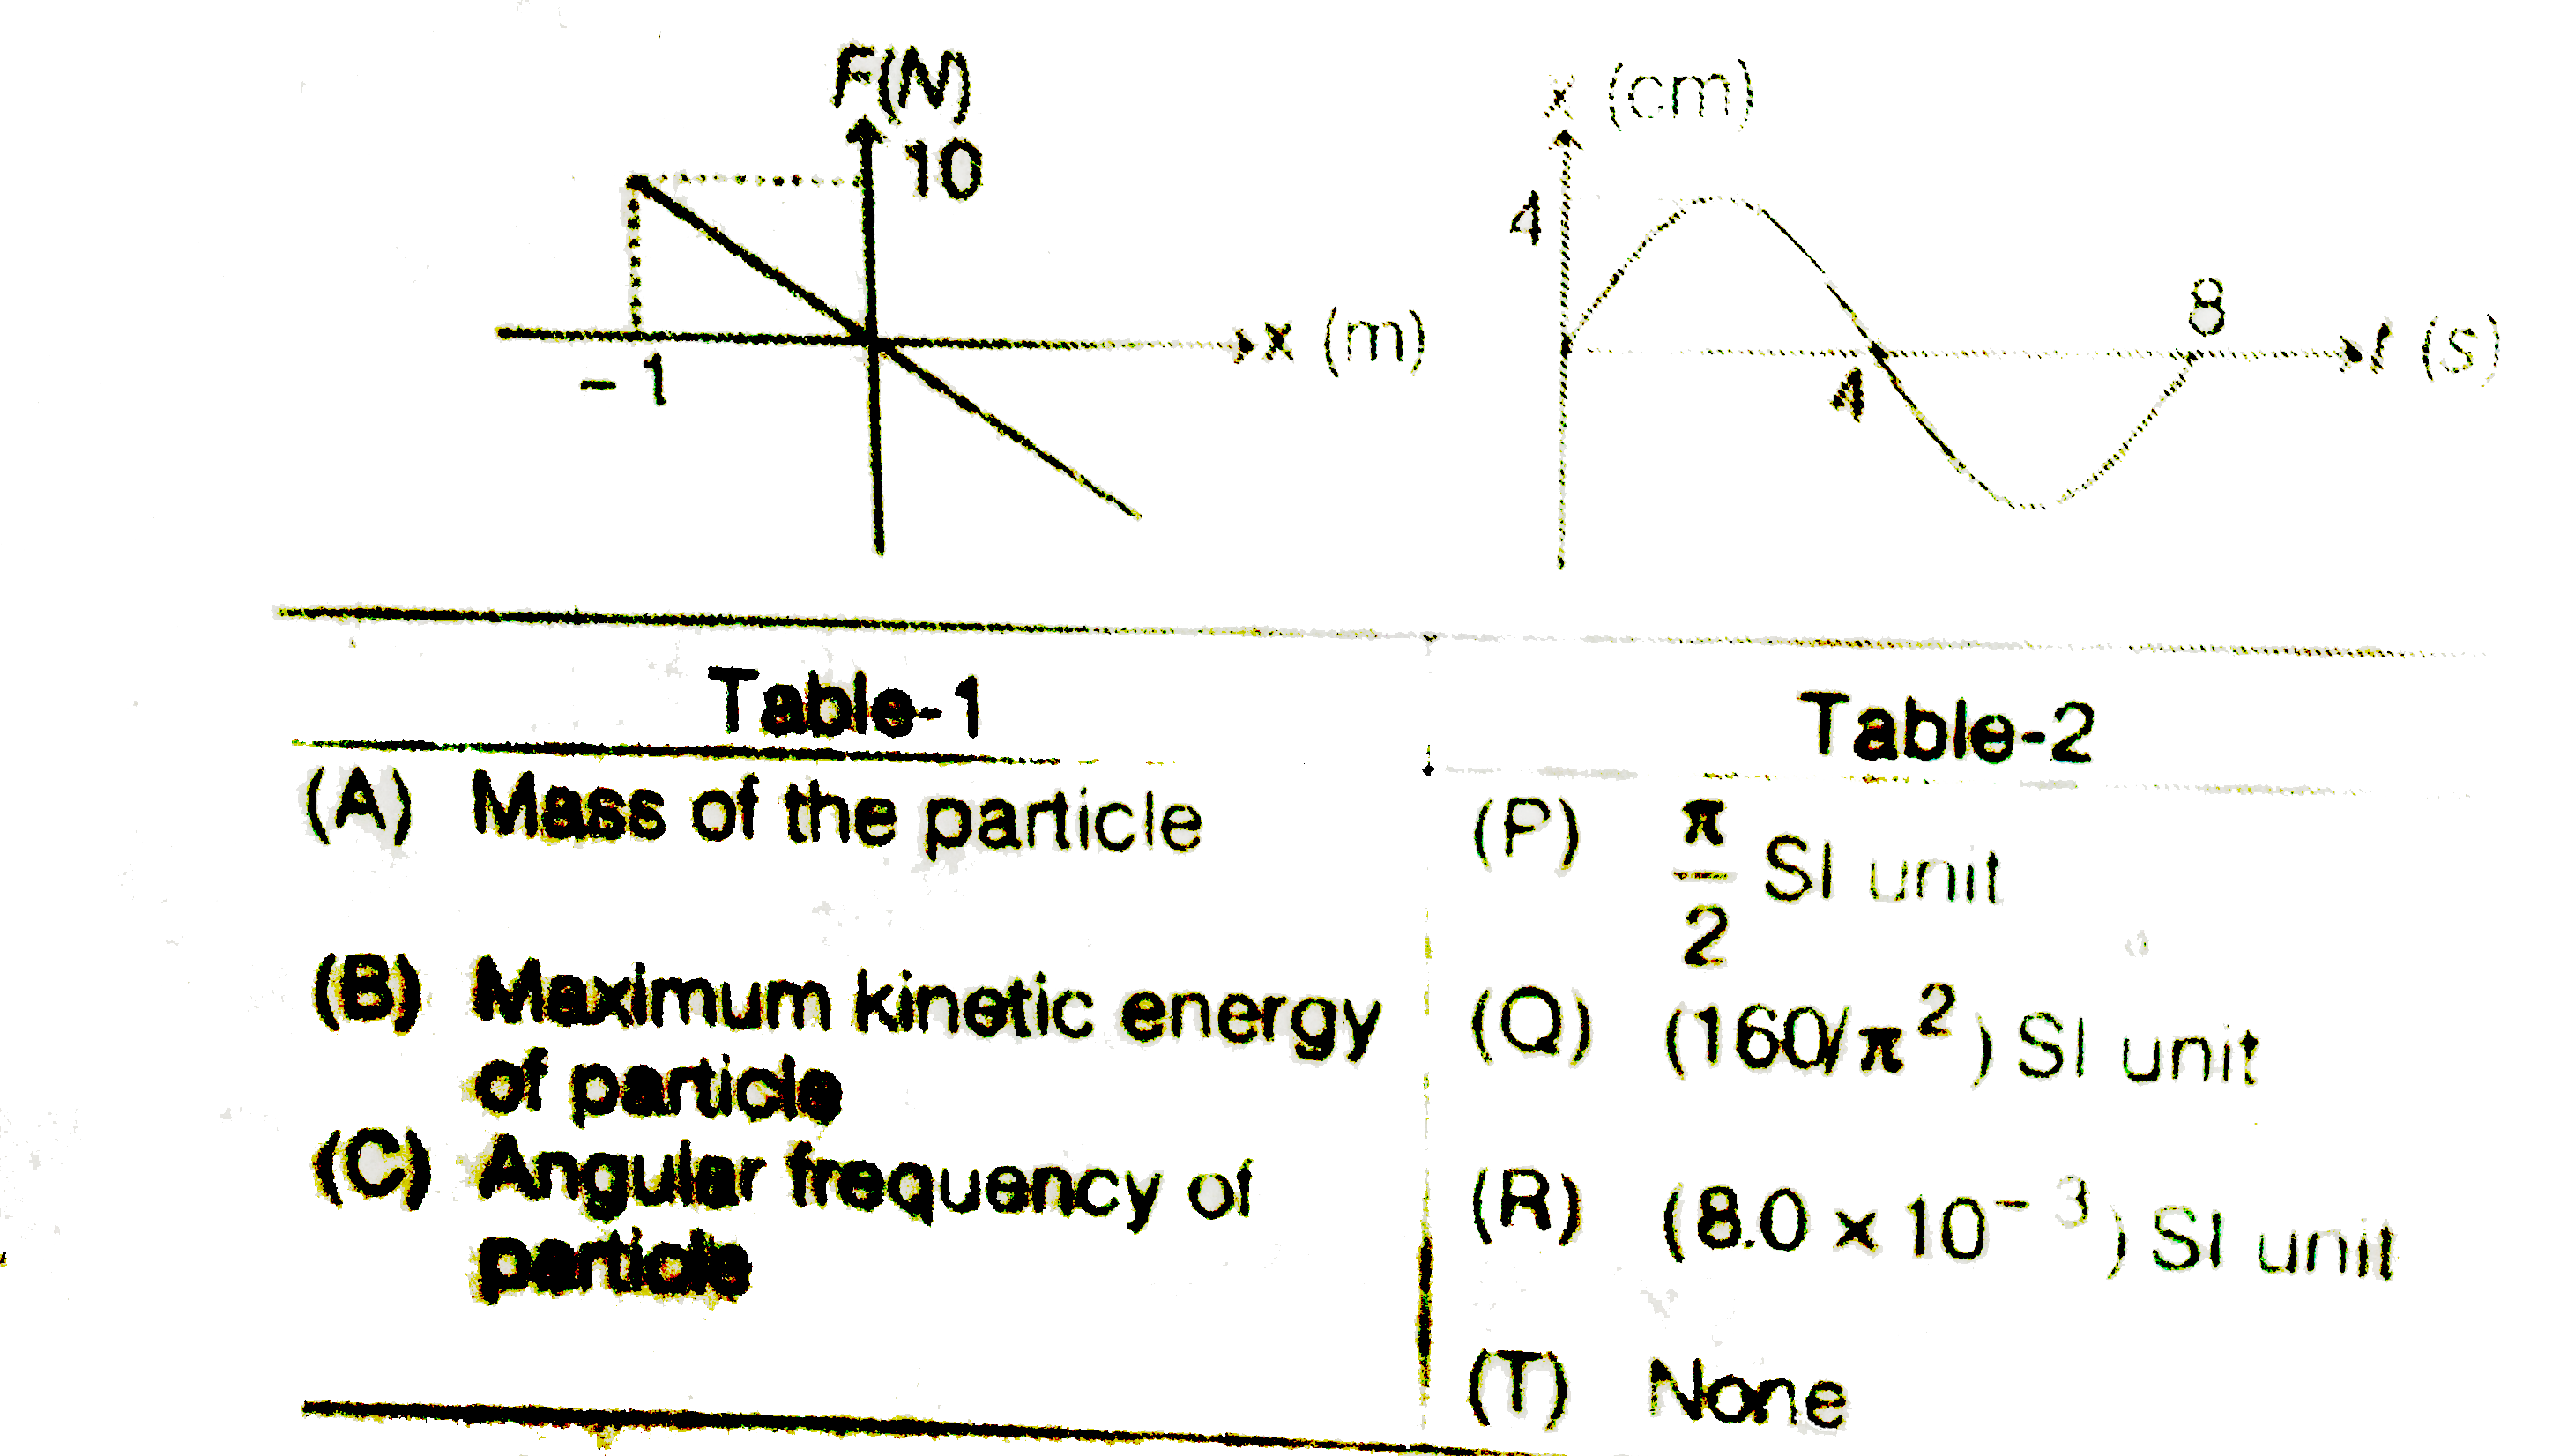
View SolutionF-x and x-t graph of a principle in SHM are as shown in figure. Match the following.
View SolutionIf the graph of y=|f(x)| is as shown in figure
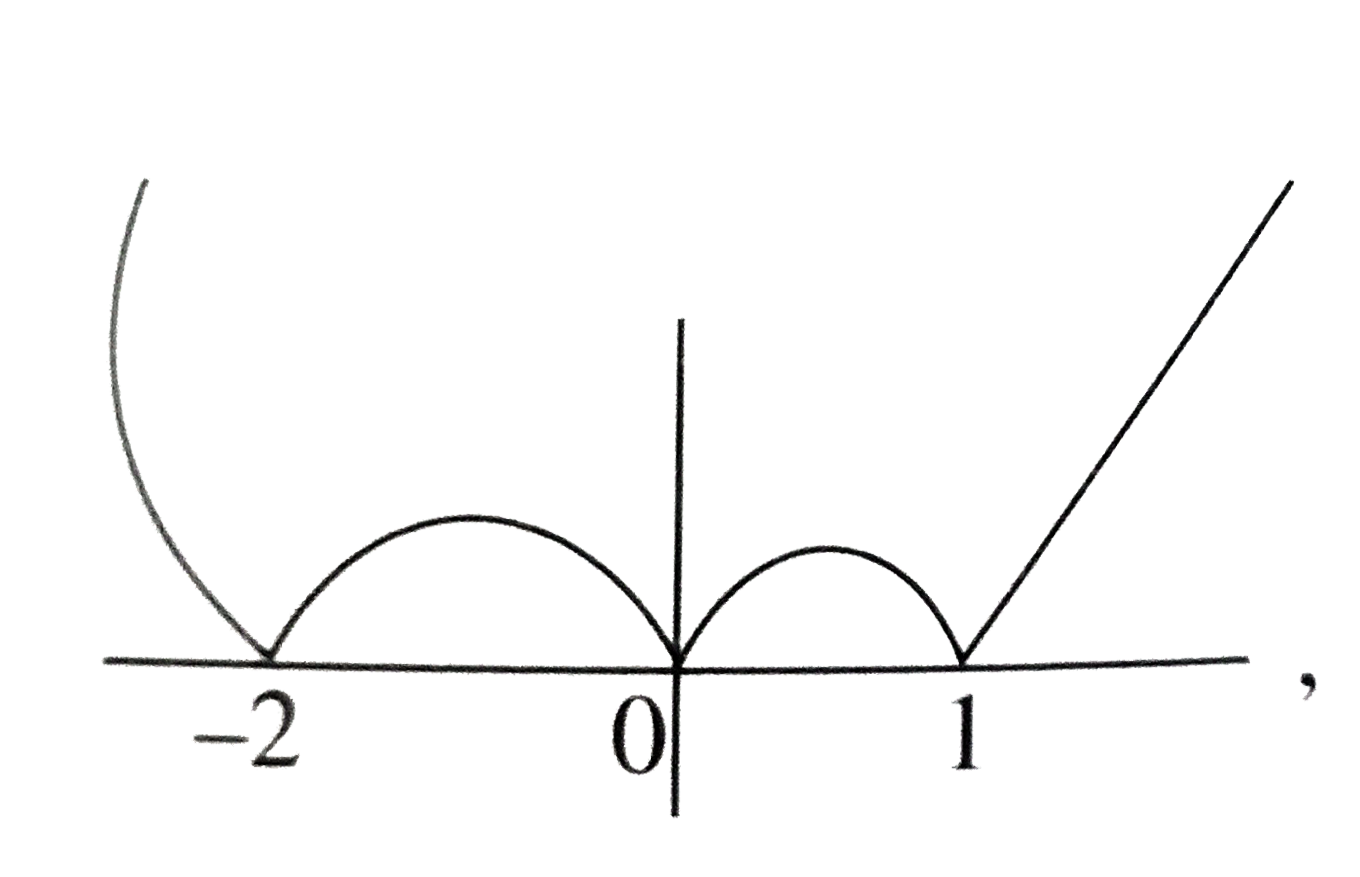 then the graph of y=f(x) may be
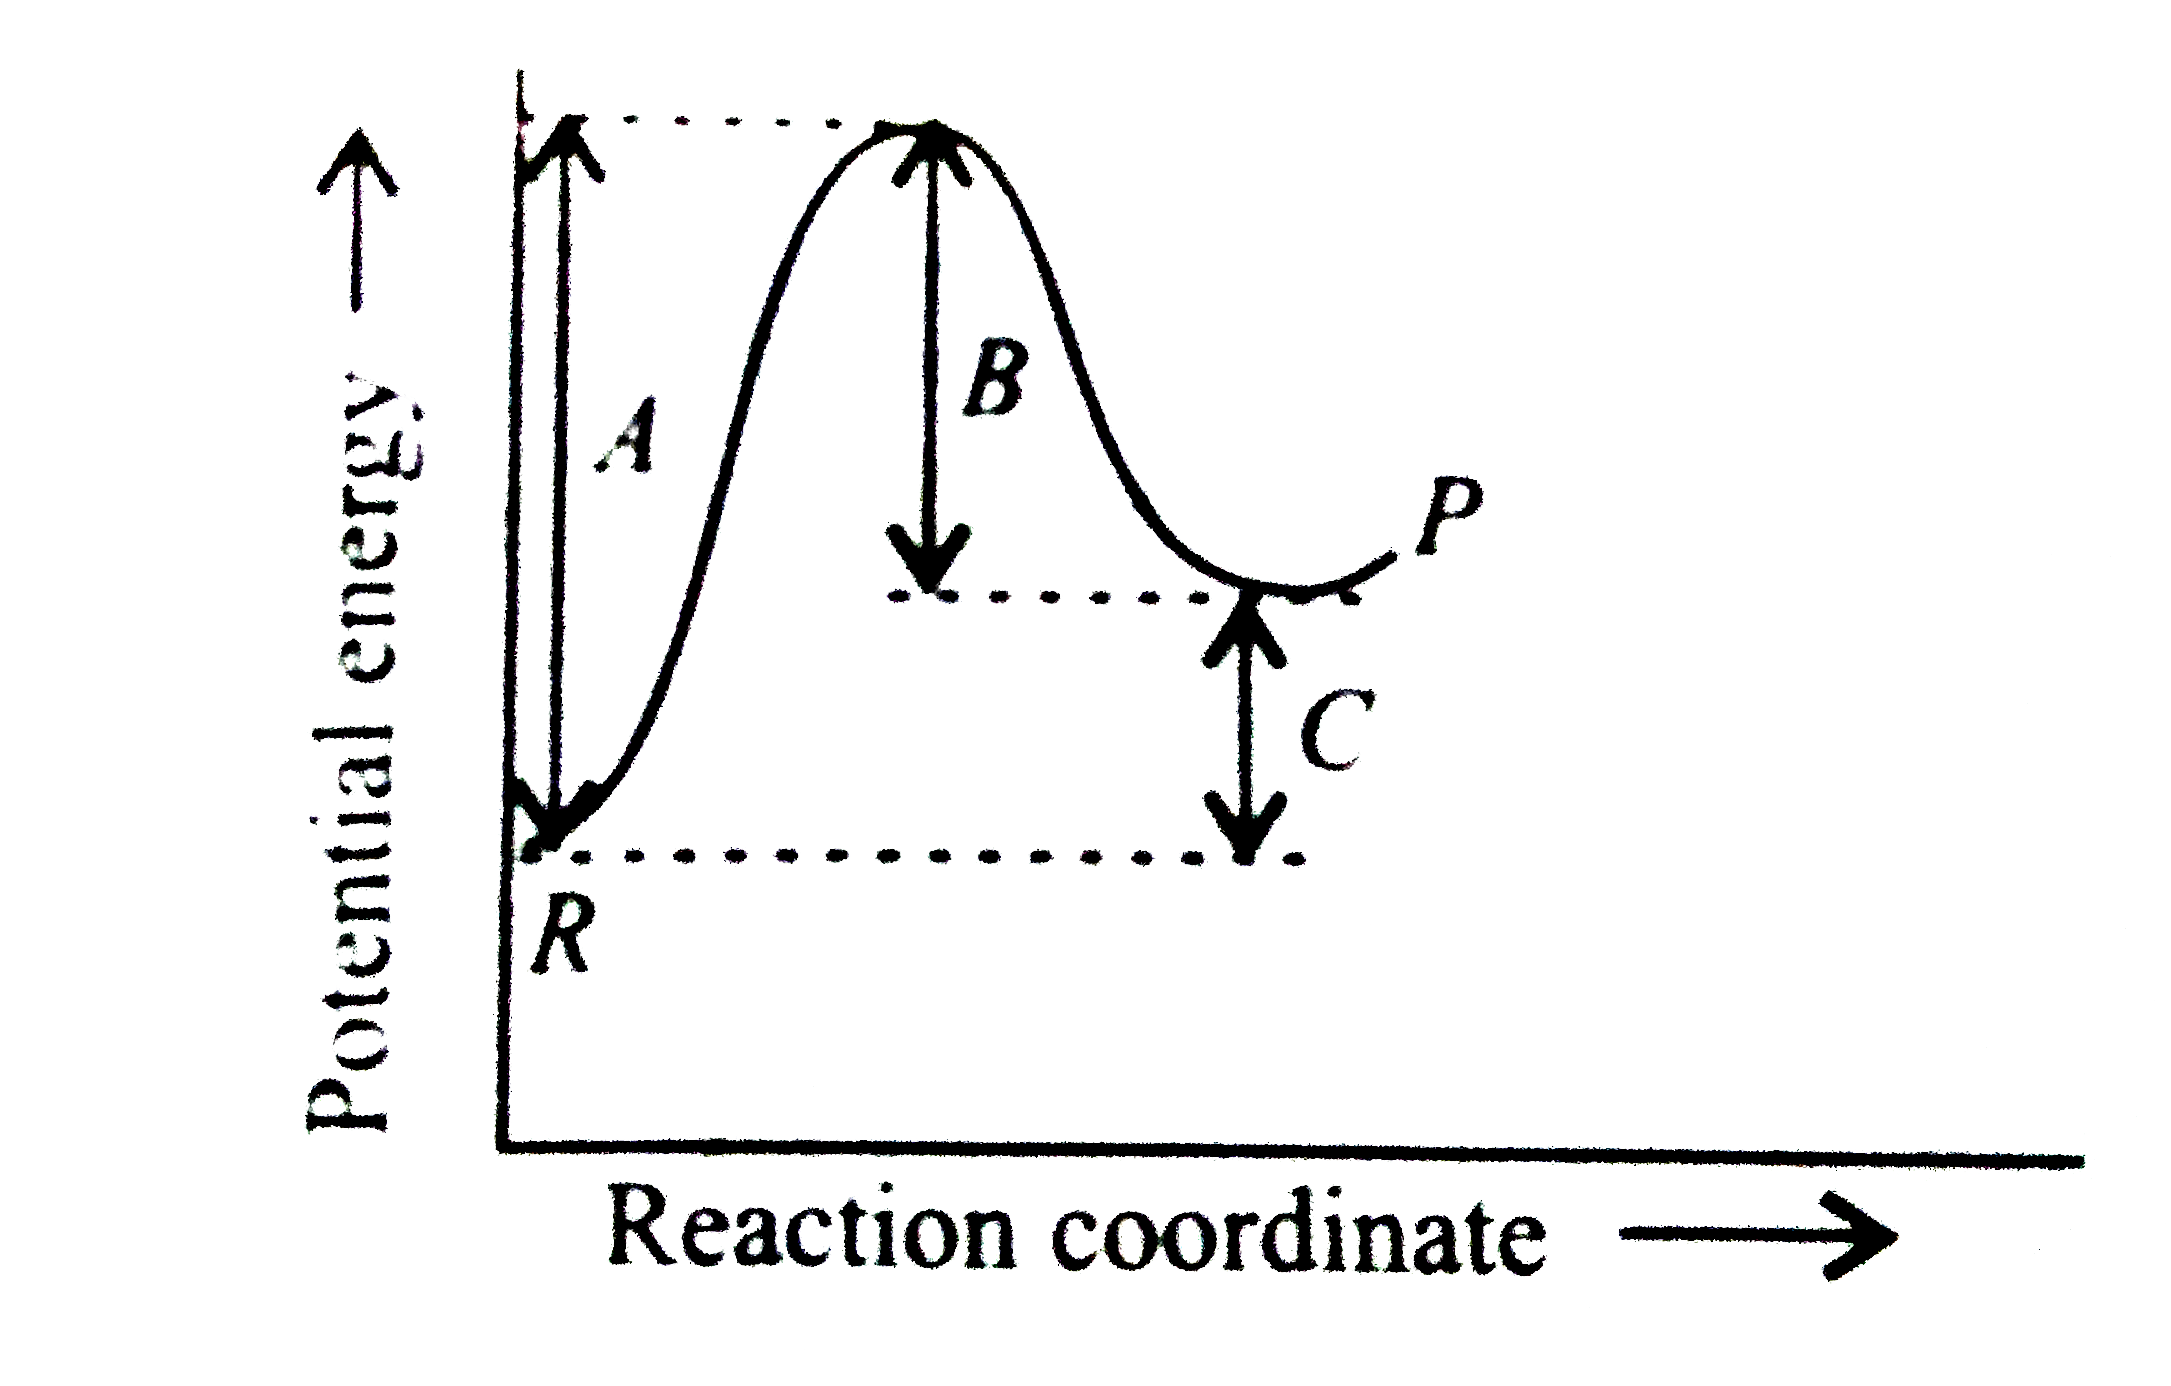
View SolutionThe potential energy diagram for a reaction X→Y is given. A and C in the graph corresponding to
View SolutionPlot (p - V),(V - T) and (ρ - T) graph corresponding to the (p - T) graph for an ideal gas shown in figure.
 .
.
View SolutionDraw the graph of the polynomial f(x)=x3 .
View SolutionIf graph of y= f(x) is as shown in figure, then which of the following options is/are correct?
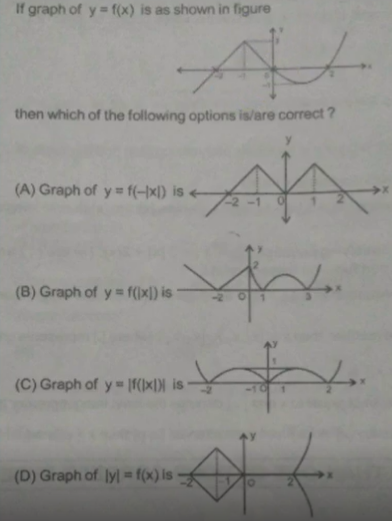
View Solution

