Which of the following plots may represent is impedence of a series LCR combination?
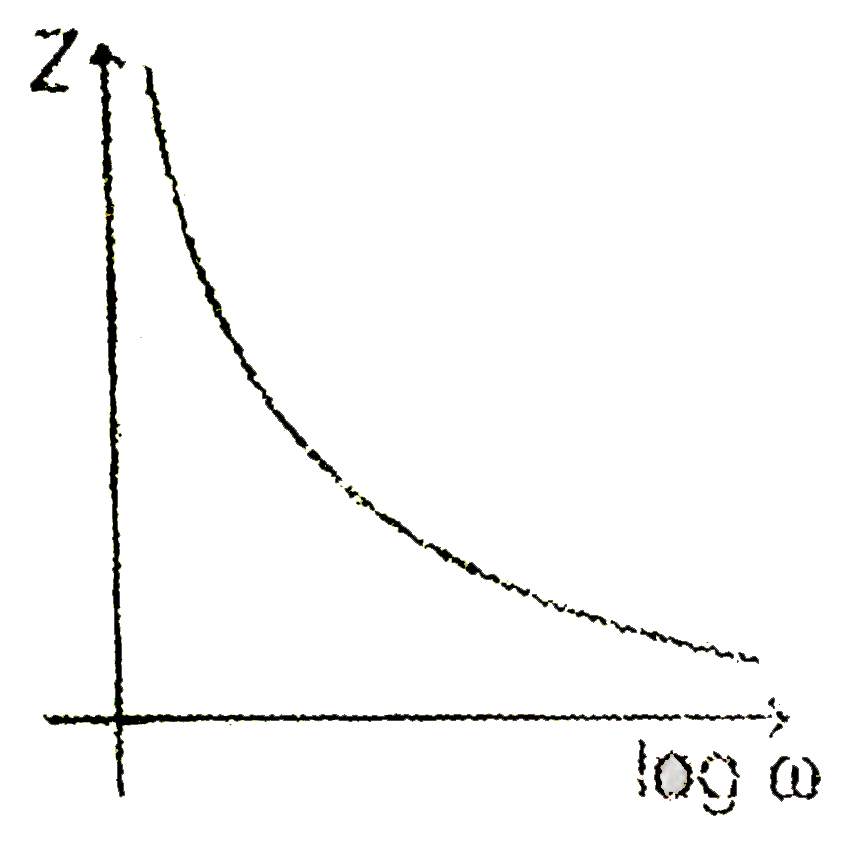
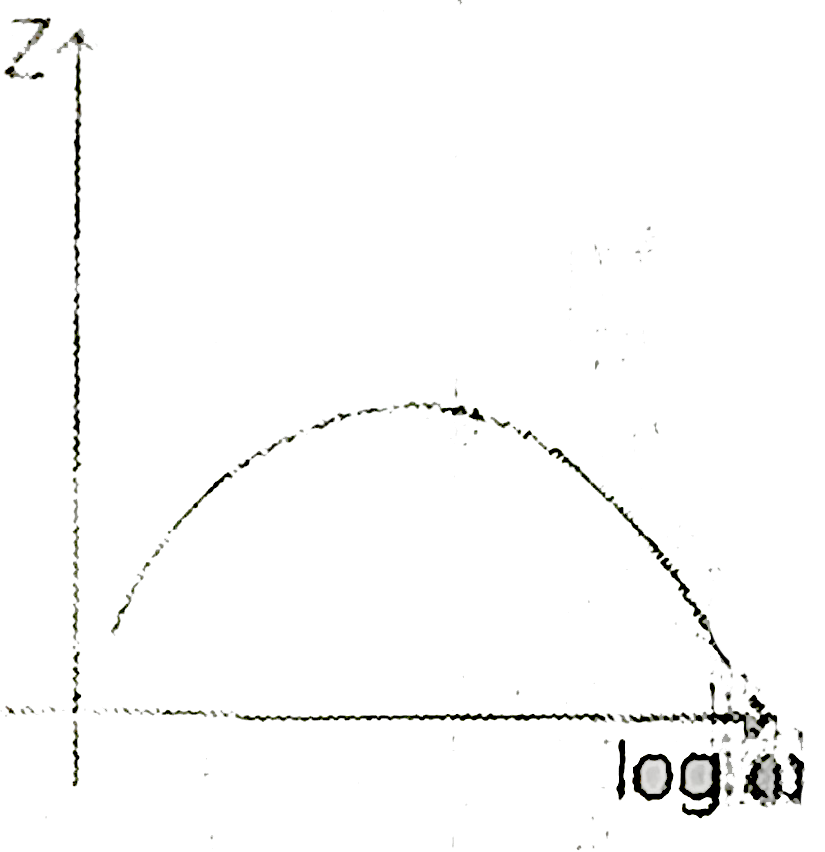
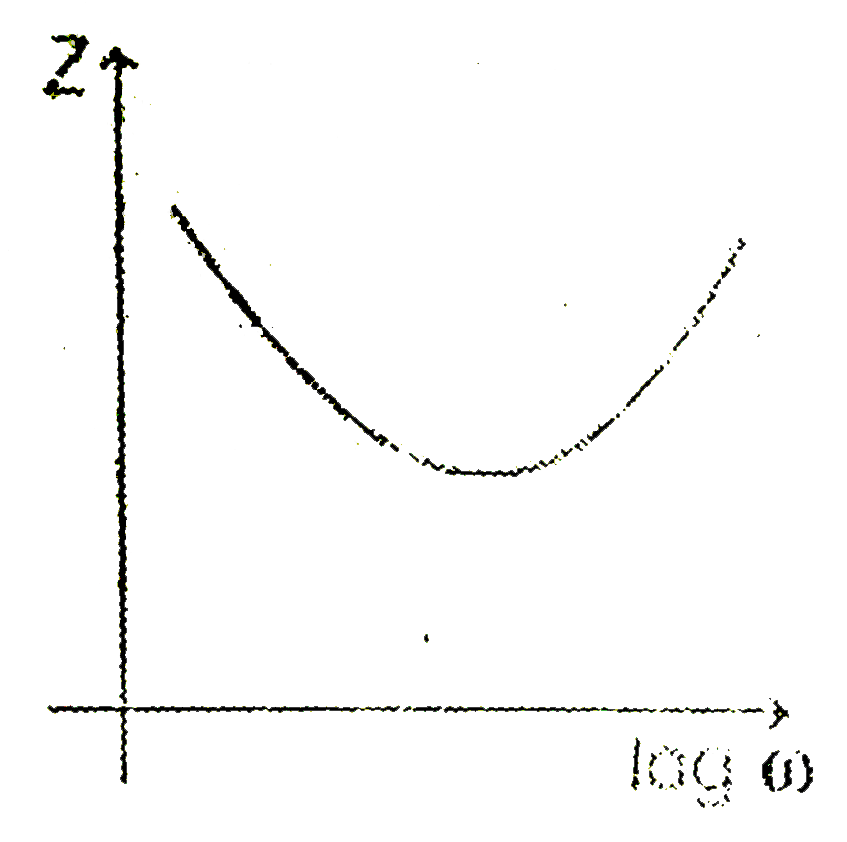
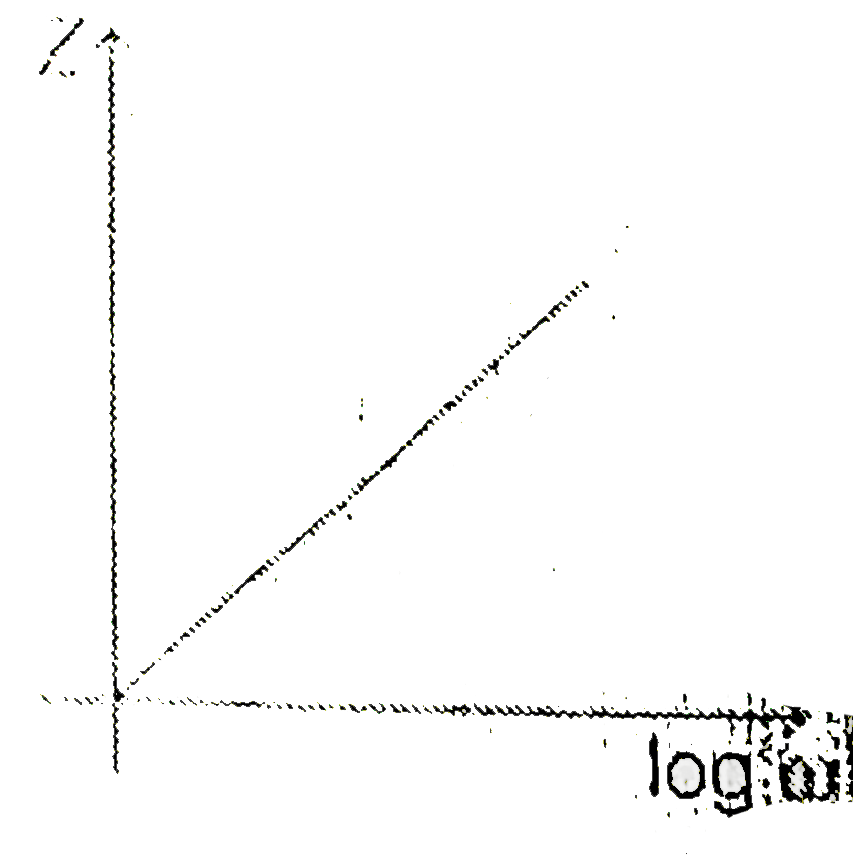
The correct Answer is:C
To determine which plot represents the impedance of a series LCR (Inductor-Capacitor-Resistor) combination, we can follow these steps:
1. Understand the Impedance Formula:
The impedance Z of a series LCR circuit is given by the formula:
Z=√R2+(XL−XC)2
where XL=ωL (inductive reactance) and XC=1ωC (capacitive reactance).
2. Identify the Conditions:
- Condition 1: When XL=XC (resonance condition), then Z=R.
- Condition 2: When XL>XC (inductive dominance), Z increases as frequency increases.
- Condition 3: When XC>XL (capacitive dominance), Z also increases but starts from a lower value.
3. Plot the Impedance:
- On the x-axis, we plot frequency ω.
- On the y-axis, we plot impedance Z.
- The graph will show:
- A minimum point at resonance (Z=R).
- An increase in impedance as we move away from resonance in both directions (either XL or XC dominating).
4. Analyze the Options:
- Check each option to see which one reflects the behavior described:
- A curve that dips to a minimum at the resonance frequency and rises on either side indicates the correct representation of impedance in a series LCR circuit.
5. Conclusion:
- After analyzing the provided options, the correct plot that represents the impedance of a series LCR combination is identified.
Final Answer:
The correct option is Option C.
The impedance Z of a series LCR circuit is given by the formula:
Z=√R2+(XL−XC)2
where XL=ωL (inductive reactance) and XC=1ωC (capacitive reactance).
- Condition 1: When XL=XC (resonance condition), then Z=R.
- Condition 2: When XL>XC (inductive dominance), Z increases as frequency increases.
- Condition 3: When XC>XL (capacitive dominance), Z also increases but starts from a lower value.
- On the x-axis, we plot frequency ω.
- On the y-axis, we plot impedance Z.
- The graph will show:
- A minimum point at resonance (Z=R).
- An increase in impedance as we move away from resonance in both directions (either XL or XC dominating).
- Check each option to see which one reflects the behavior described:
- A curve that dips to a minimum at the resonance frequency and rises on either side indicates the correct representation of impedance in a series LCR circuit.
- After analyzing the provided options, the correct plot that represents the impedance of a series LCR combination is identified.
The correct option is Option C.
Topper's Solved these Questions
Similar Questions
Which of the following plots may represent the reactance of a series LC combination?

View SolutionWhich of the following plots may represent the reactance of a series LC combination?
(##HCVVOL2C39E01020_Q01##)
View SolutionWhich of the shown graphs may represent the reactance of a series L-C combination?
View SolutionWhat do the following figures represent?

View SolutionWhich of the following plots represents an ideal binary mixture?
View SolutionWhich of the following plots does not represent Boyle's law?
View SolutionWhich of the following may represent the curve x = 2y+ 3?
View SolutionWhich of the following may represent the direction of →VAB?
View SolutionWhich of the following plots represents the behavior of an ideal binary liquid solution ?
View Solution
Which of the following is the only correct combination for Lyman series ?
View Solution
