Which of the following plots may represent the reactance of a series LC combination?
(##HCVVOL2C39E01020_Q01##)
To solve the question regarding the reactance of a series LC combination, we can follow these steps:
1. Understand Reactance in LC Circuits:
- The reactance of a capacitor XC is given by:
XC=1ωC
- The reactance of an inductor XL is given by:
XL=ωL
2. Calculate Total Reactance:
- In a series LC combination, the total reactance X is:
X=XL−XC=ωL−1ωC
3. Substitute Angular Frequency:
- Recall that angular frequency ω is related to frequency f as:
ω=2πf
- Substitute ω into the reactance equation:
X=2πfL−12πfC
4. Analyze Behavior at Extremes:
- As frequency f approaches 0:
- X approaches ∞ because 12πfC dominates and tends to infinity.
- As frequency f approaches ∞:
- X also approaches ∞ because 2πfL dominates and tends to infinity.
5. Determine the Reactance Behavior:
- At some intermediate frequency, there will be a point where X=0. This occurs when:
2πfL=12πfC
- Solving for f gives the resonant frequency where the inductive and capacitive reactances cancel each other out.
6. Identify the Correct Plot:
- The plot that represents this behavior will show that as frequency f goes from 0 to ∞, the reactance X starts from ∞, decreases to 0 at the resonant frequency, and then increases back to ∞.
- The only curve that satisfies this condition is curve D.
Final Answer:
The correct plot that represents the reactance of a series LC combination is curve D.
- The reactance of a capacitor XC is given by:
XC=1ωC
- The reactance of an inductor XL is given by:
XL=ωL
- In a series LC combination, the total reactance X is:
X=XL−XC=ωL−1ωC
- Recall that angular frequency ω is related to frequency f as:
ω=2πf
- Substitute ω into the reactance equation:
X=2πfL−12πfC
- As frequency f approaches 0:
- X approaches ∞ because 12πfC dominates and tends to infinity.
- As frequency f approaches ∞:
- X also approaches ∞ because 2πfL dominates and tends to infinity.
- At some intermediate frequency, there will be a point where X=0. This occurs when:
2πfL=12πfC
- Solving for f gives the resonant frequency where the inductive and capacitive reactances cancel each other out.
- The plot that represents this behavior will show that as frequency f goes from 0 to ∞, the reactance X starts from ∞, decreases to 0 at the resonant frequency, and then increases back to ∞.
- The only curve that satisfies this condition is curve D.
The correct plot that represents the reactance of a series LC combination is curve D.
Topper's Solved these Questions
- ALTERNATING CURRENTBOOK - RESONANCE ENGLISHCHAPTER - ALTERNATING CURRENTEXERCISE - Exercise -1 Part-1
64 Videos
- ALTERNATING CURRENTBOOK - RESONANCE ENGLISHCHAPTER - ALTERNATING CURRENTEXERCISE - Exercise -2 Part-1
14 Videos
- ATOMIC PHYSICSBOOK - RESONANCE ENGLISHCHAPTER - ATOMIC PHYSICSEXERCISE - Advanved level problems
17 Videos
Similar Questions
Which of the following plots may represent is impedence of a series LCR combination?
View SolutionWhich of the shown graphs may represent the reactance of a series L-C combination?
View SolutionWhich of the following may represent the curve x = 2y+ 3?
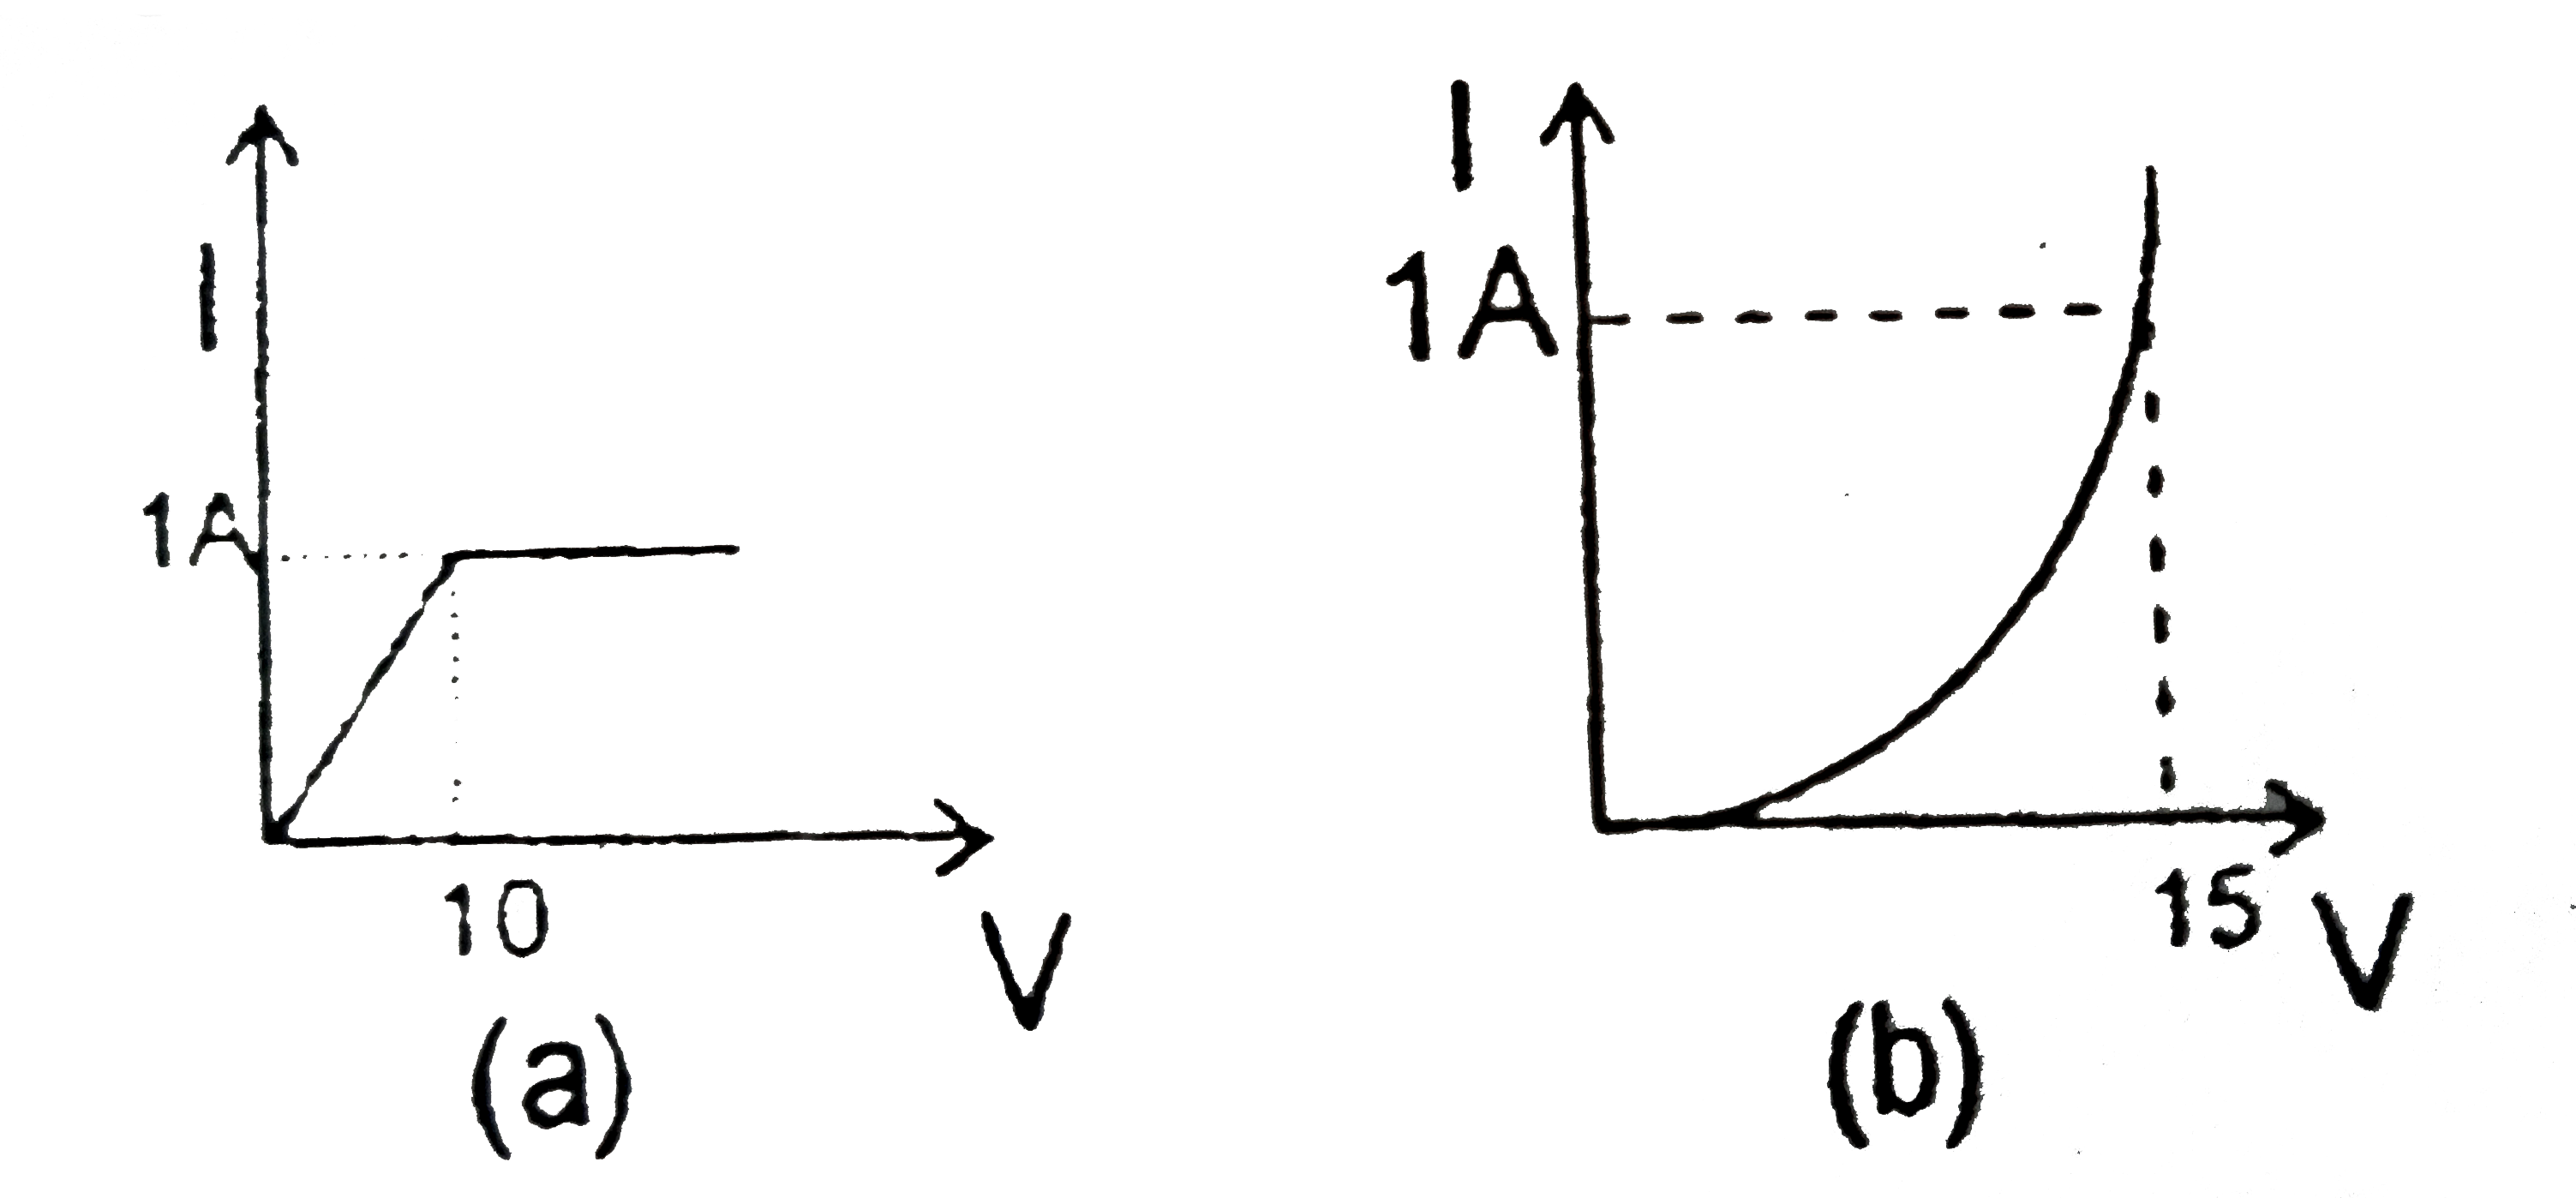
View SolutionCurrent-voltage characteristics of two elements A and B are as shown in Figs. (a) and (b)

Which of the following graphs represents current voltage characteristics for their series combinations ?
View SolutionCurrent-voltage characteristics of two elements A and B are as shown below in Figs. (a) and (b).
(a)
Which of the following graphs represents current voltage characteristics for their series combinations ?
View SolutionTwo short magnets of equal dipole moments M are fastened perpendicularly at their centres (figure). The magnitude of the magnetic field at a distance d from the centre on the bisector of the right angle is
(##HCV_VOL2_C36_E01_006_Q01##)
View SolutionA conducting square loop of side l and resistance R moves in its plane with a uniform velocity v perpendicular ot one of its sides. A uniform and constant magnetic field B exists along the perpendicualr ot the plane of the loop as shown in . The current induced in the loop is
(##HCV_VOL2_C38_E01_025_Q01##)
View SolutionWhich of the following graphs represent function whose derivatives have a maximum in the interval (0,1) ?
View SolutionA right angled triangle abc, made from a metallic wire, moves at a uniform speed v in its plane as shown in . A uniform magnetic field B exists in the perpendicular direction. Find the emf induced (a) in the loop abc, (b) in the segment bc, (c ) in the segment ac and (d) in the segment ab.
(##HCV_VOL2_C38_E01_066_Q01##)
View SolutionDifferent forms of a gene located at the same locus of chromosomes are called
View Solution
