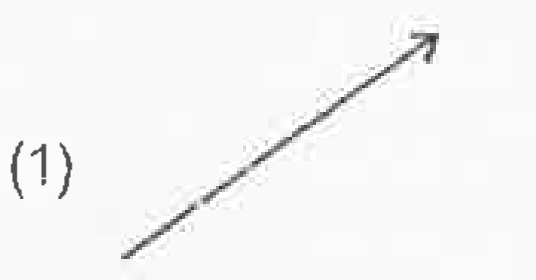
Which of the following plots may represent the reactance of a series LC combination?

The correct Answer is:D
Step by step video & image solution for Which of the following plots may represent the reactance of a series LC combination? by Physics experts to help you in doubts & scoring excellent marks in Class 12 exams.
Updated on:21/07/2023Topper's Solved these Questions
- ALTERNATING CURRENTBOOK - HC VERMA ENGLISHCHAPTER - ALTERNATING CURRENTEXERCISE - Objective 2
7 Videos
- ALTERNATING CURRENTBOOK - HC VERMA ENGLISHCHAPTER - ALTERNATING CURRENTEXERCISE - Exercise
19 Videos
- ALTERNATING CURRENTBOOK - HC VERMA ENGLISHCHAPTER - ALTERNATING CURRENTEXERCISE - Workder Examples
8 Videos
- BOHR'S MODEL AND PHYSICS OF THE ATOMBOOK - HC VERMA ENGLISHCHAPTER - BOHR'S MODEL AND PHYSICS OF THE ATOMEXERCISE - Short Answer
10 Videos
Similar Questions
Which of the following plots may represent is impedence of a series LCR combination?
View SolutionWhich of the shown graphs may represent the reactance of a series L-C combination?
View SolutionWhich of the following plots is/are correct?
View SolutionWhich of the following plots is/are correct?
View SolutionWhich of the following may represent the direction of →VAB?

View SolutionWhich of the following may represent the curve x = 2y+ 3?
View SolutionWhat do the following figures represent?

View SolutionWhich of the following plots does not represent Boyle's law?
View SolutionWhich of the following plots represents an ideal binary mixture?
View SolutionWhich of the following plots represents the behavior of an ideal binary liquid solution ?
View Solution
