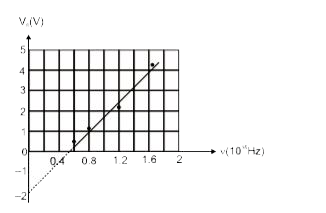
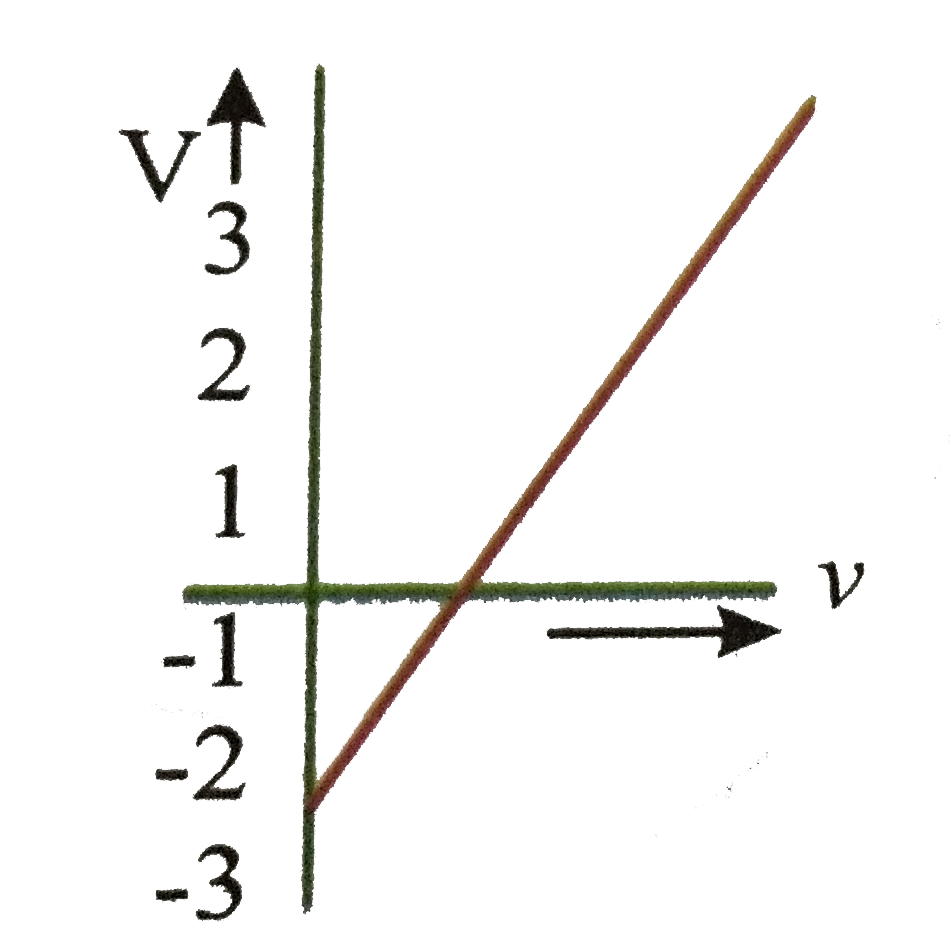
Elinstein got Nobal prize in physics in 1921 for hisw explanation of photo electric effect.Draw a graph to show the variation of stopping potential with frequency of incident radiation. How can the values of Planks constant be determined from the graph?
hV=hV0+12mv2
12mv2=h(V−V0)eV0=h(V−V0)
h=eV0V−V0from the graph, h=e×slope=e(V0V−V0)
Similar Questions
Draw a graph showing the variation of stopping potential with frequency of the incident on a metal plate. How can the value of Planck's constant be determined from this graph?
View SolutionDefine photoelectric effect. Draw a graph to show the variation of stopping potential with frequency of incident radiation on a metal plate.
View Solution
Knowledge Check
- Question 1 - Select One
In photo electric effect, the slope of the straight line graph between stopping potential and frequency of the incident light gives the ratio of Planck's constant to
Acharge of electronBwork functionCphoto electric currentDK.E. of electron - Question 2 - Select One
In a photocell circuit the stopping potential, V0, is a measure of the maximum kinetic energy of the photoelectrons. The following graph shows experimentally measured values of stopping potential versus frequency v of incident light.

The values of Planks constant and the work function as determined from the graph are (taking the magnitude of electronic charge to be e=1.6×10⁻¹⁹C)A6.4×10−34Js,2.0eVB6.0×10−34Js,2.0eVC6.4×10−34Js,3.2eVD6.0×10−34Js,3.2eV - Question 3 - Select One
Figure shows the graph of stopping potential verus that frequency of a photosensitive metal. The plank's constant and work funcation of the metal are
_S01_035_Q01.png) A(V2+V1v2+v2)e,(V2v1+V1v2v2+v1)eB(V2+V1v2−v1)e,(V2v1+V1v2v2−v1)eC(V2−V1v2+v1)e,(V2v1−V1v2v2+v1)eD(V2−V1v2−v1)e,(V2v1−V1v2v2−v1)e
A(V2+V1v2+v2)e,(V2v1+V1v2v2+v1)eB(V2+V1v2−v1)e,(V2v1+V1v2v2−v1)eC(V2−V1v2+v1)e,(V2v1−V1v2v2+v1)eD(V2−V1v2−v1)e,(V2v1−V1v2v2−v1)e
Draw and explain the graph showing the variation of stopping potential with frequency of incident radiation in relation to photoelectric effect.
View SolutionPlot a labelled graph of maximum kinetic energy of photo electrons versus frequency of incident radiation. State how you will obtain the value of Planck.s constant h from the graph.
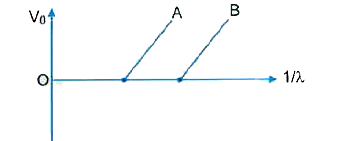
View SolutionFigure shows the stopping potential (V0) for the photo electron vers (1λ) graph, for two metals A and B, λ being the wavelength of incident light.

How is the value of Planck's constant determined from the graph ?View SolutionFigure shows the graph of stopping potential verus that frequency of a photosensitive metal. The plank's constant and work funcation of the metal are
_S01_035_Q01.png) View Solution
View SolutionFrom the graph shown, the value of work function if the stopping potential (V), and frequency of the incident light vare on y and x-axes respectively is
 View Solution
