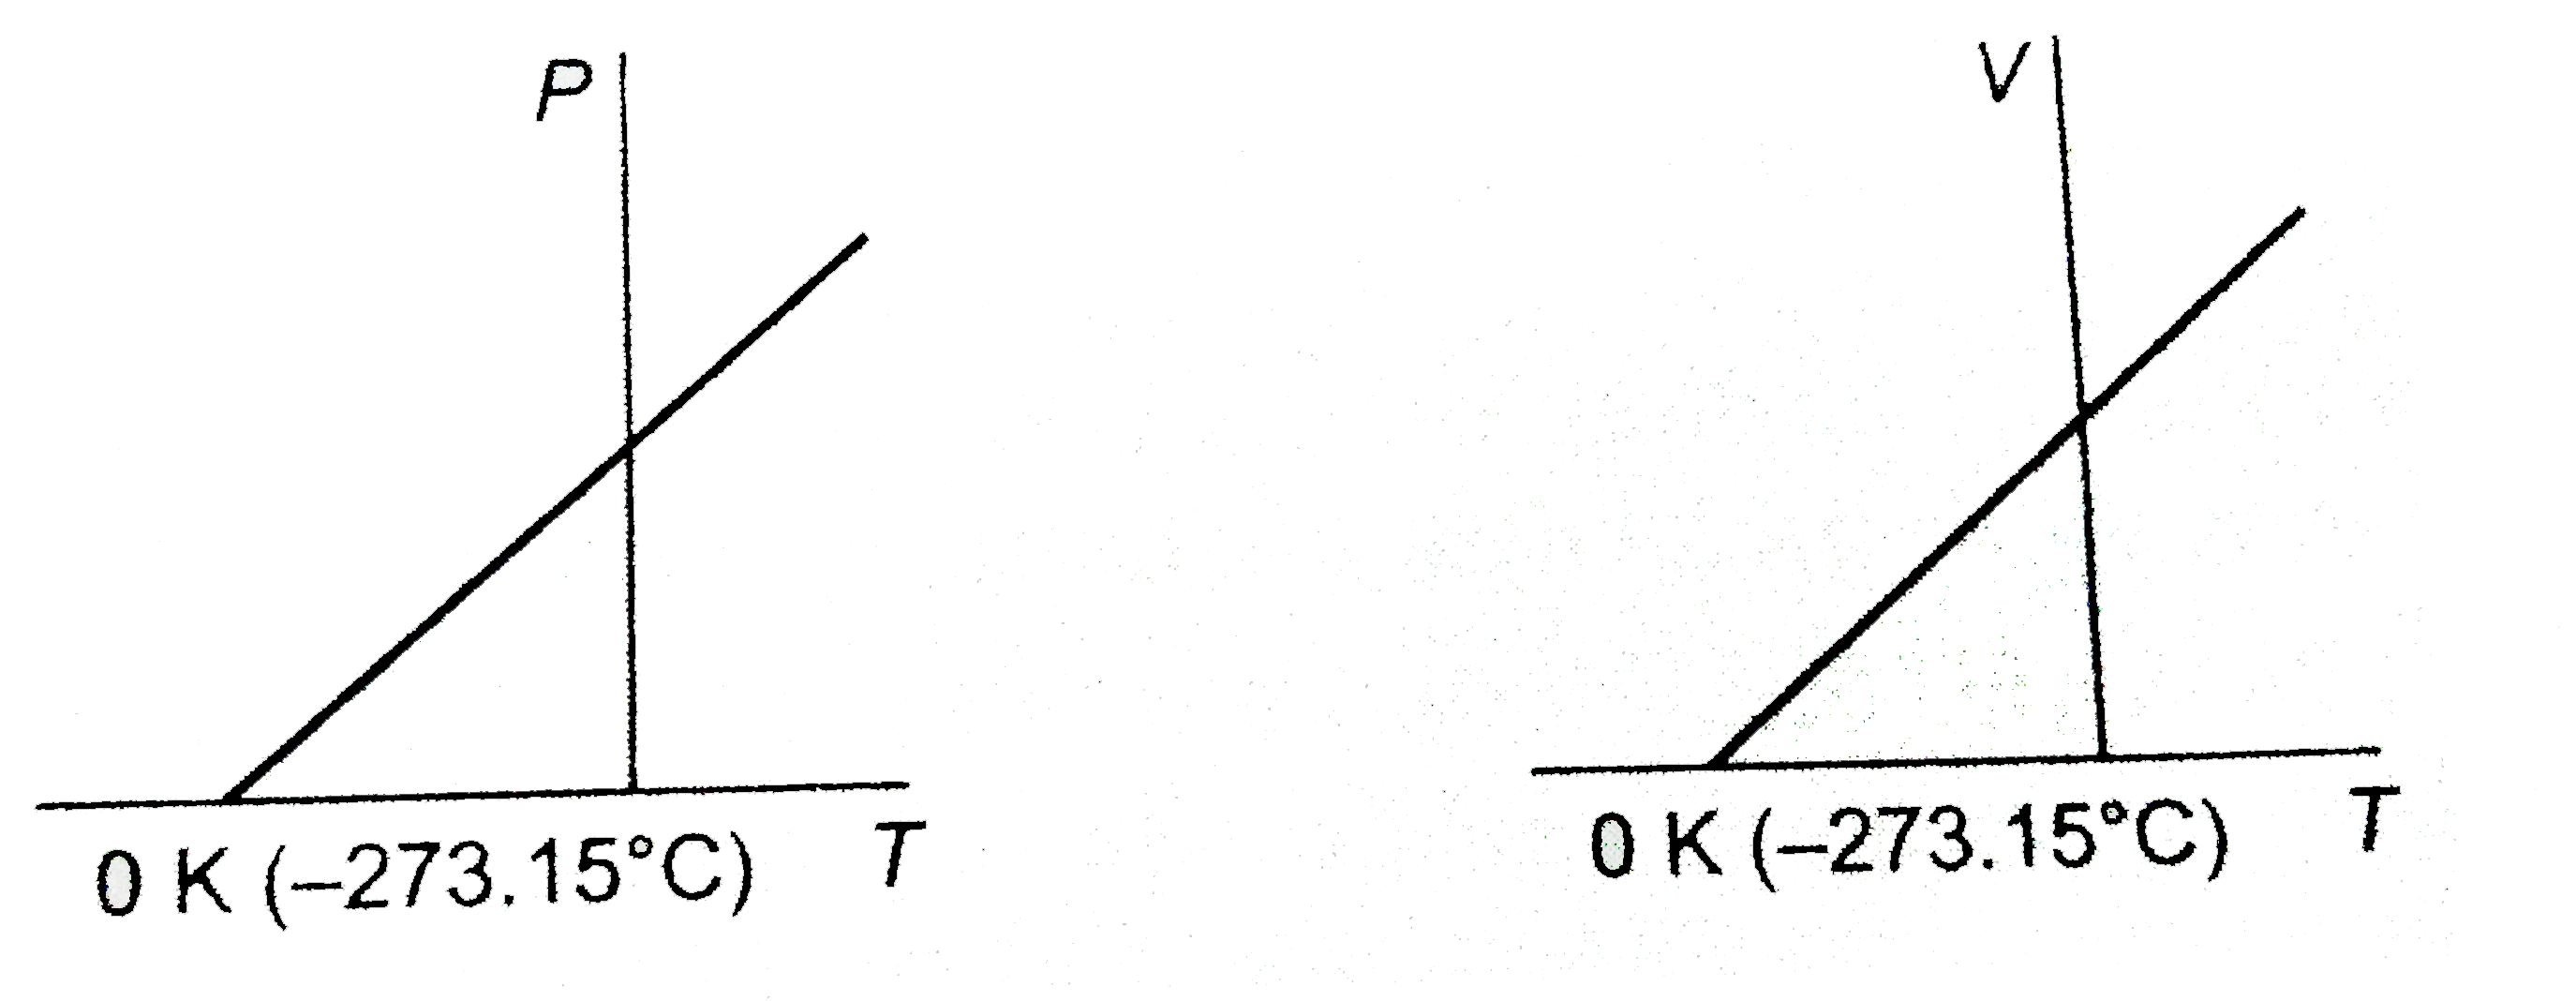
Draw two graphs showing the ideal gas equation. Solution in Telugu
Step by step video & image solution for Draw two graphs showing the ideal gas equation. by Chemistry experts to help you in doubts & scoring excellent marks in Class 11 exams.
Updated on:21/07/2023Topper's Solved these Questions
- STATES OF MATTERBOOK - AAKASH SERIESCHAPTER - STATES OF MATTEREXERCISE - SUBJECTIVE EXERCISE -1 ( NUMERICALS)
38 Videos
- STATES OF MATTERBOOK - AAKASH SERIESCHAPTER - STATES OF MATTEREXERCISE - SUBJECTIVE EXERCISE -2 ( SHORT ANSWER QUESTIONS)
17 Videos
- STATES OF MATTERBOOK - AAKASH SERIESCHAPTER - STATES OF MATTEREXERCISE - SUBJECTIVE EXERCISE -1 ( SHORT ANSWER QUESTIONS)
13 Videos
- SATURATED HYDROCARBONSBOOK - AAKASH SERIESCHAPTER - SATURATED HYDROCARBONSEXERCISE - QUESTIONS FOR DESCRIPTIVE ANSWERS
10 Videos
- STOICHIOMETRYBOOK - AAKASH SERIESCHAPTER - STOICHIOMETRYEXERCISE - QUESTIONS FOR DESCRIPTIVE ANSWERS
59 Videos
Similar Questions
Calculate the volume occupied by 25g. of carbon dioxide at 303K and 0.974 atm. Pressure
View SolutionWrite the postulates of kinetic molecular theory of gases .
View SolutionState and explain Gay-Lussac's law of combining volumes.
View SolutionWhy boiling and melting points of hydrocarbons are low ?
View SolutionDistinguish between element and compound?
View SolutionFigure shows graphs of pressure versus density for an ideal gas at two temperatures T_(1) and T_(2) Which is correct ? .
View SolutionWhat conclusion would you draw from the following graphs for an ideal gas?
View SolutionDraw z vs PO graph for an ideal gas, and CO_(2) gas
View SolutionFigure shows graphs of pressure versus density for an ideal gas at two temperatures T1 and T2 Then

View Solutionनिम्न में से कौनसा ग्राफ एक आदर्श गैस के व्यवहार को दर्शाता है
View SolutionDiagram shows a graph between pressure and density for an ideal gas at two temperatures T1andT2 which is correct

View SolutionDiagram shows a graph between pressure and density for an ideal gas at two temperatures T1andT2 which is correct

View SolutionDraw two graphs showing the ideal gas equation.
View SolutionWhat conclusion would you draw from the following graphs for an ideal gas?

View Solutionनिम्न में से कौन-सा ग्राफ एक आदर्श गैस के व्यव्हार को प्रदर्शित करता है !
View SolutionDraw a graph showing the relationship between volume and temperature of an ideal gas at a constant pressure.
View Solution
