The table below gives the number of students who took part in the various items of the talent show as part of the annual school gathering. Make a bar graph to show this data :

Step by step video & image solution for The table below gives the number of students who took part in the various items of the talent show as part of the annual school gathering. Make a bar graph to show this data : by Maths experts to help you in doubts & scoring excellent marks in Class 6 exams.
Topper's Solved these Questions
Similar Questions
This table shows the number of students studying in various streams in different colleges. What is the average of the number of students in the arts stream in all the colleges taken together?
 View Solution
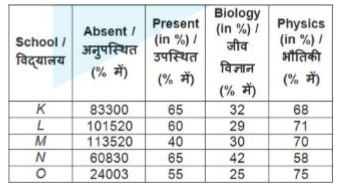
The table given below shows the number of students who were absent and percentage of students who were present in the given two examinations from five different schools. The table also shows the percentage of students who were present in the Biology and Physics examination respectively.

The number of students who were present in Physics examination from school M is what per cent of number of students who were absent from schools M, L and O?View Solution
Knowledge Check
- Question 1 - Select One
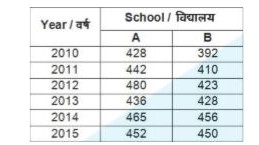
The table given below shows the number of students who have taken admission in school A and B from the years 2010 to 2015.

If the total student intake capacity for School B was 500 then what percentage of seats remained vacant in school B in 2015?Aa)1Bb)5Cc)10Dd)20
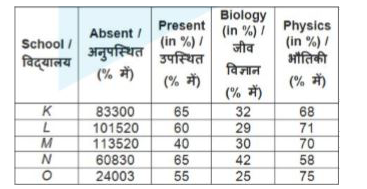
The table given below shows the number of students who were absent and percentage of students who were present in the given two examinations from five different schools. The table shows the percentage of students who were present in the Biology and Physics examination respectively.

If the number of students who were present in the Physics examination from school A is 250% of the difference of the number of the students who were present in Physics and Biology examination, from school K, then what is the ratio of the number of students who were present from school L to number of students who were present in Physics examination from school A?View SolutionThe table given below shows the number of students who were absent and percentage of students who were present in the given two examinations from five different schools. The table also shows the percentage of students who were present in the Biology and Physics examination respectively.

If the number of students who were present in the Physics examination from school A is 250% of the difference of the number of the students who were present in Physics and bilogy examination, from school K, then what is the ratio of the number of students who were present from school L to number of students who were present in Physics examination from school A?View SolutionThe table given below shows the number of students who were absent and percentage of students who were present in the given two examinations from five different schools. The table also shows the percentage of students who were present in the Biology and Physics examination respectively.

What is the average of the number of the students who were of the students who were present in Physics examination from schools N. K and L?View SolutionThe table given below shows the number of students who were absent and percentage of students who were present in the given two examinations from five different schools. The table also shows the percentage of students who were present in the Biology. And Physics examination respectively.
 What is the average of the number of the students who were present in Physics examination from school N, K and L?View Solution
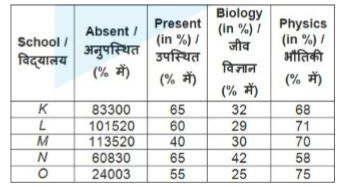
The table given below shows the number of students who were absent and percentage of students who were present in the given two examinations from five different schools. The table also shows the percentage of students who were present in the Biology and Physics examination respectively.

What is the difference between the number of students who were present in Physics and that in Biology examination from school N?View SolutionThe following table shows the marks obtained by Sumit in the annual examination.

Draw a bar graph to show the above information.View SolutionThe table given below shows the number of students who were abset and percentage of students who were present in the given two examination from five different of students who were present in the Biology and Physics examination respectively.

Number of students who were present in Physics examination from school M is what percent of number of students who were absent from school M, L and O?View Solution

