Yeshwant allocates different duration of time as shown below, to different exercises he does during the week. Draw a bar show the details of his schedule using an appropriate scale :

Step by step video & image solution for Yeshwant allocates different duration of time as shown below, to different exercises he does during the week. Draw a bar show the details of his schedule using an appropriate scale : by Maths experts to help you in doubts & scoring excellent marks in Class 6 exams.
Topper's Solved these Questions
Similar Questions
The following data shows the number of students who attended the school on weekdays. Draw a bar graph to represent information by using appropriate scale.
 View Solution
The given table shows the number of tourists who visited Taj Mahal during different months. Month

Draw a bar graph to represent the above information by using appropriate scale.View Solution
Knowledge Check
- Question 1 - Select One
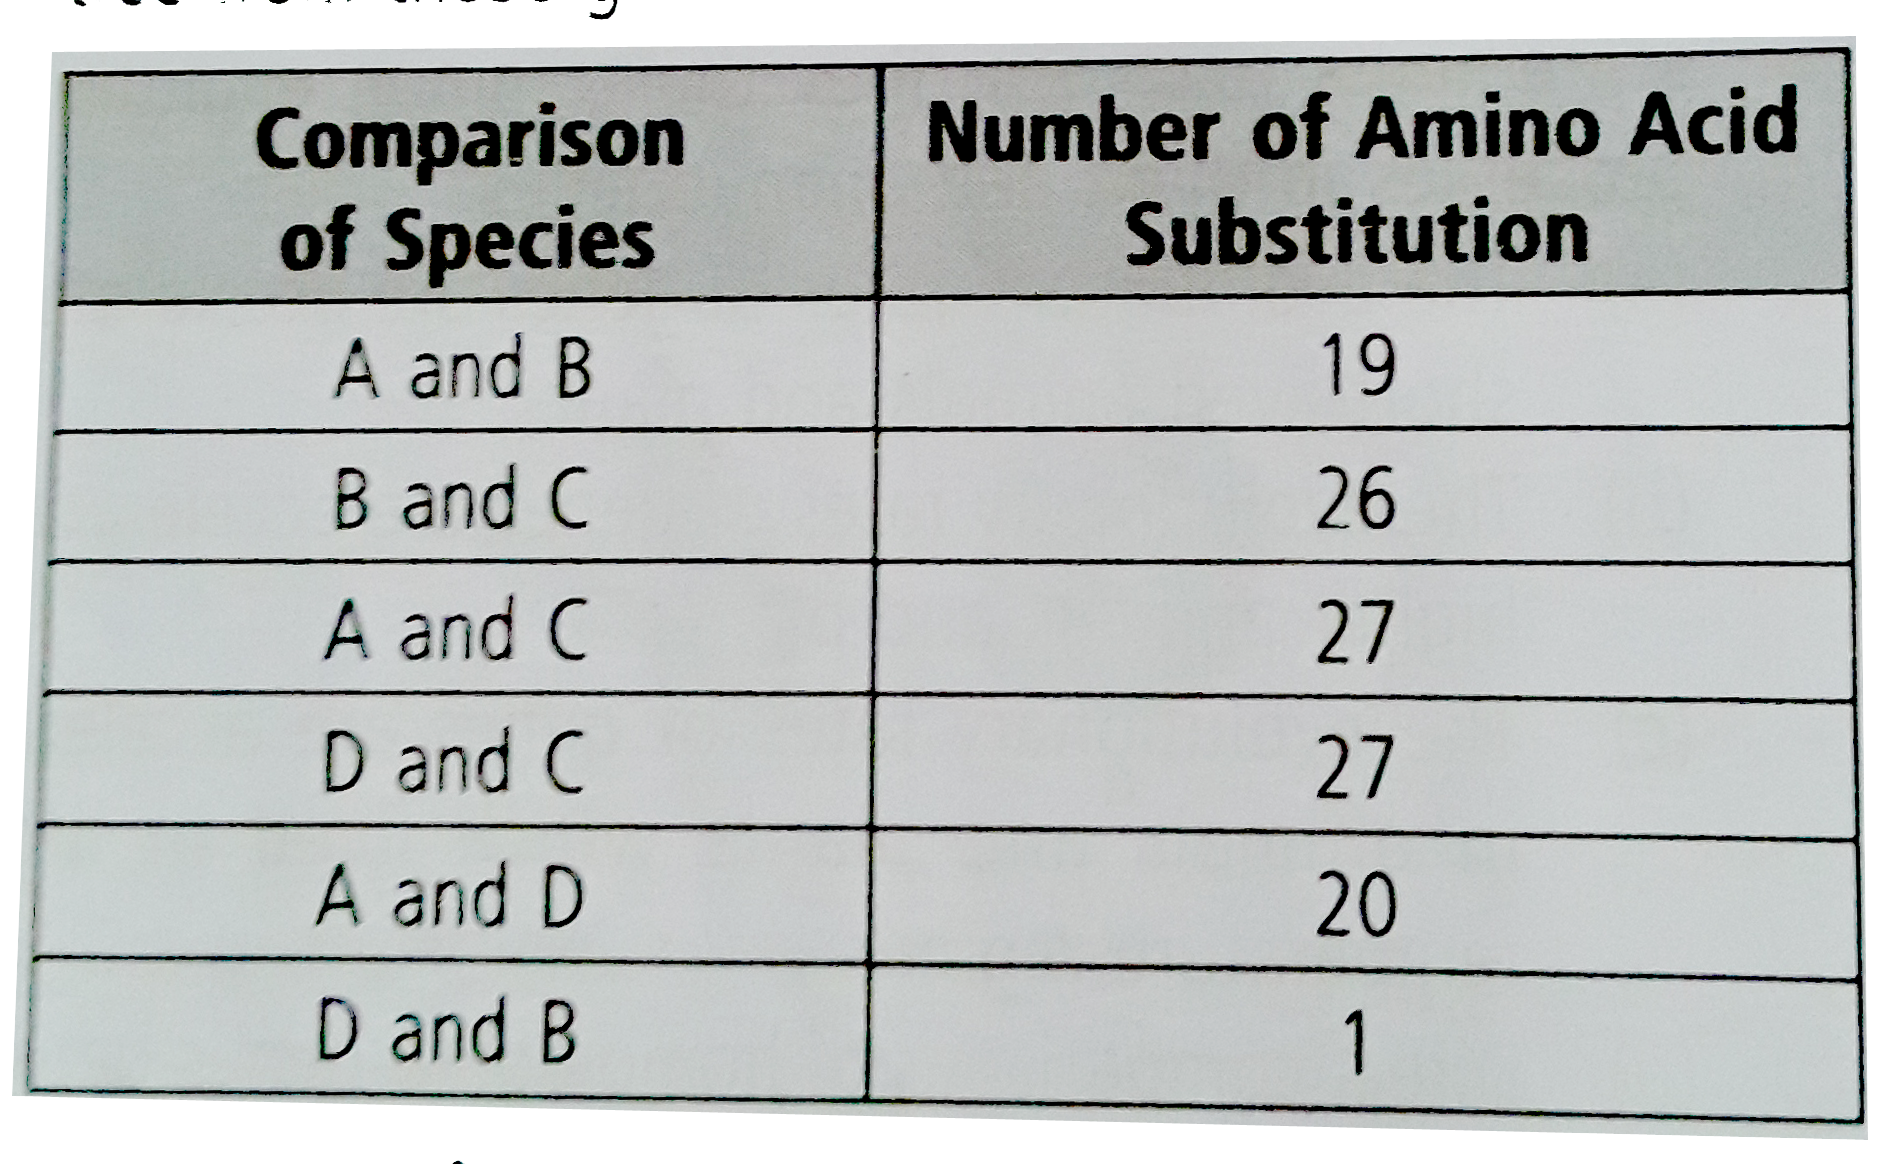
Following table shows data on amino acid substitution in the α chain of haemoglobin in four different mammalian species A,B,C and D on the basis of the data shown in the table. Choose the most appropriate evolutionary tree from those given below.
 A
A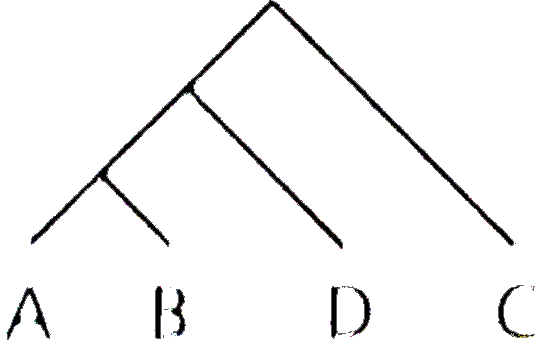 B
B C
C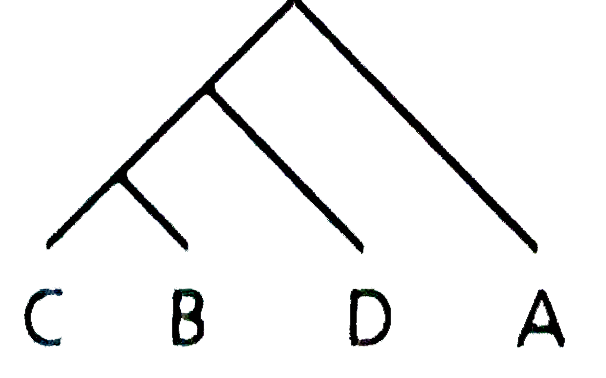 D
D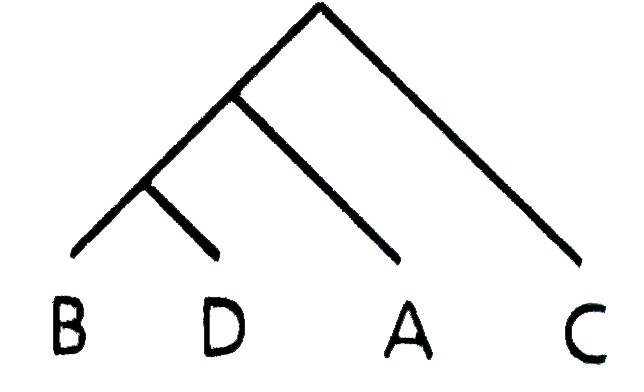
In the time table of a school, periods allotted per week to different teaching subjects are given below:

Draw a pie chart for this data.View SolutionThe number of ATMs of different banks in a city is shown below:
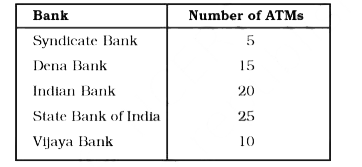
Draw a bar graph to represent the above information by choosing the scale of your choice.View SolutionThe table below compares the population (in hundreds) of 4 towns over two years:

Study the table and answer the following questions:
(a) Draw a double bar graph using appropriate scale to depict the above information.
(b) In which town was the population growth maximum?
(c) In which town was the population growth least?View Solution(a) A student cannot see clearly a chart hanging on a wall placed at a distance of 3m from his eyes. Name the defect of vision he is suffering from. Draw a ray diagram to illustrate this defect. List its two possible causes.
(b) Draw a ray diagram to show how this defect may be corrected using a lens of appropriate focal length.
(c) What do you mean by the 'Power of Accommodation' of human eye?View Solution70 students from a locality use different modes of transport to go to school as given below:

Draw the bar graph representing the above data.View Solution70 students from a locality use different modes of transport to go to school as given below:
 Draw the bar graph representing the above data.View Solution
A courter-person cycles from a town to a neighbouring suburban area to deliver a parcel to a merchant. His distances from the twon at different times are shown by the given graph.
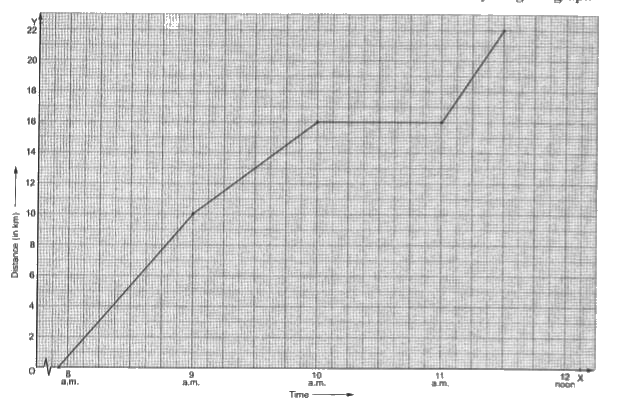
Study the above graph carefully and answer the questions given below:
(i) What is the scale taken for the time-axis?
(ii) How much time did the person take for the travel ?
(iii) How far is the place of the merchant from the town ?
(iv) Did the person stop on his way ? Explain.
(v) During which period did he ride fastest ?View Solution

