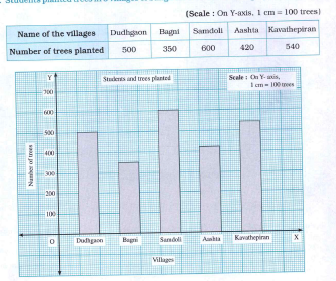
Students planted trees in 5 villages of Sangli district. Make a bar graph of this data.

Step by step video & image solution for Students planted trees in 5 villages of Sangli district. Make a bar graph of this data. by Maths experts to help you in doubts & scoring excellent marks in Class 6 exams.
Updated on:21/07/2023Topper's Solved these Questions
Similar Questions
The table below gives the number of students who took part in the various items of the talent show as part of the annual school gathering. Make a bar graph to show this data :

View SolutionIn a school, there are five sections of class IX. The number of students in each section is given below. Construct a bar graph representing this data: Section: A B C D E No. of Students 40 48 52 45 30
View SolutionIn a school, there are five sections of class VII. The number of students in each section is given below. Construct a bar graph representing this data: Section, A, B, C, D, E No. of Students, 40, 48, 52, 45, 30
View SolutionPrepare a bar graph of the data given in question 28.
View SolutionThe names of the heads of some families in village and the quantity of drinking water their family consumes in one day are given below. Draw a bar graph for this data :

View SolutionMake a multiple bar diagram of the following data

View SolutionIn a tree plantation programme, 40 students planted various number of plants . 8 students planted 5 saplings each. What is the percenteage of these students ? What is the percentage of the remaining students ?
View SolutionThe following data shows the number of students who attended the school on weekdays. Draw a bar graph to represent information by using appropriate scale.

View SolutionThe table represents number of tourists visiting a zoo for 5 months.

Make a bar graph representing the above information.
View SolutionThe following table gives the average temperatures, during the year 2006 and 2007. Draw a double bar graph for the given data.

View Solution
