The Number of Customers Who Came to a Juice Centre for One Week is Given in the Table Below. Make Two Different Bar Graphs to Show this Data.

Step by step video & image solution for The Number of Customers Who Came to a Juice Centre for One Week is Given in the Table Below. Make Two Different Bar Graphs to Show this Data. by Maths experts to help you in doubts & scoring excellent marks in Class 6 exams.
Topper's Solved these Questions
Similar Questions
The table below gives the number of students who took part in the various items of the talent show as part of the annual school gathering. Make a bar graph to show this data :
 View Solution
The given table shows the quantity of petrol and its cost.

Plot a graph to show the data.View SolutionDraw a bar graph using the data given in the following table.
 View Solution
The table given below shows the number of students who were absent and percentage of students who were present in the given two examinations from five different schools. The table also shows the percentage of students who were present in the Biology and Physics examination respectively.

The number of students who were present in Physics examination from school M is what per cent of number of students who were absent from schools M, L and O?View SolutionThe table given below shows the number of students who were absent and percentage of students who were present in the given two examinations from five different schools. The table also shows the percentage of students who were present in the Biology and Physics examination respectively.

What is the difference between the number of students who were present in Physics and that in Biology examination from school N?View SolutionThe daily maximum and minimum temperature of a city during one week in the month a April is given below. Construct a double bar graph using this data
 View Solution
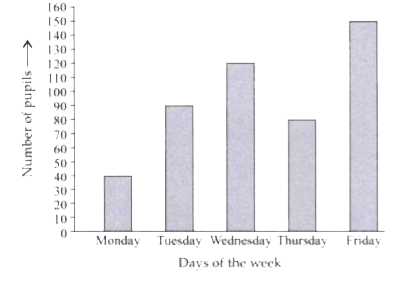
the given bar graph shows the numbers of puspils who participated in the fitness test in different days of the week .

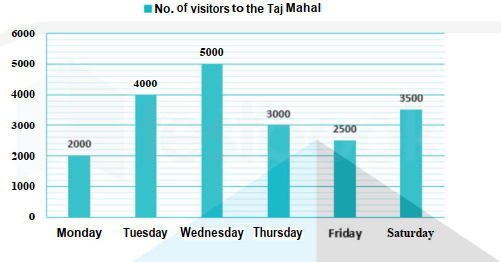
what percentage of the total number of puipil had their test on Wednesday ?View SolutionDirection: Read the following Bar graph carefully and answer the following questions: The following bar graph shows the number of visitors to the Taj Mahal in the first week of January.

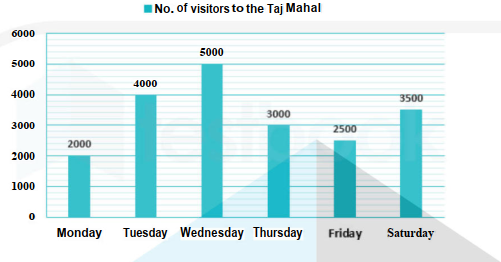
The number of visitors on Saturaday is what percentage more than that of FridayView SolutionDirection: Read the following Bar graph carefully and answer the following questions: The following bar graph shows the number of visitors to the Taj Mahal in the first week of January.

Find on which day the number of vistiros to the Taj Mahal is the highest?View SolutionThe names and numbers of animals in a certain zoo are given below. Use the data to make a bar graph :
 View Solution

