The numbers of Science, Arts and Commerce graduates working in a company are 30, 70 and 50 respectively. If these 'figures are represented by a pie chart, then what by a pie chart, then what is the angle corresponding to Science graduates ?
36∘
72∘
120∘
168∘
The correct Answer is:B
Step by step video, text & image solution for The numbers of Science, Arts and Commerce graduates working in a company are 30, 70 and 50 respectively. If these 'figures are represented by a pie chart, then what by a pie chart, then what is the angle corresponding to Science graduates ? by Maths experts to help you in doubts & scoring excellent marks in Class 12 exams.
Updated on:21/07/2023Topper's Solved these Questions
Similar Questions
Knowledge Check
In an examination, 40% of candidates got second class. When the data are represented by a pie chart, what is the angle corresponding to second class?
A40∘B90∘C144∘D320∘In an examination, 40% of candidates got second class. When the data are represented by a pie chart, what is the angle corresponding to second class?
(a)40∘
(b)90∘
(c)144∘
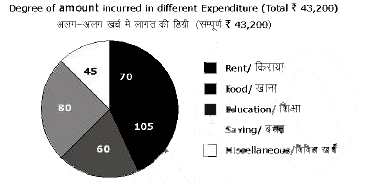
(d)320∘A40∘B90∘C144∘D320∘If red part in the following pie chart in 40, what is white part ?
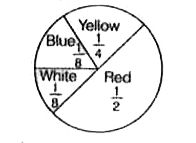 A20B5C10D12
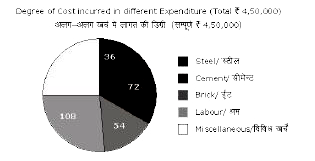
In the given pie chart what is the total expenditure (in percent) on labour charges ?
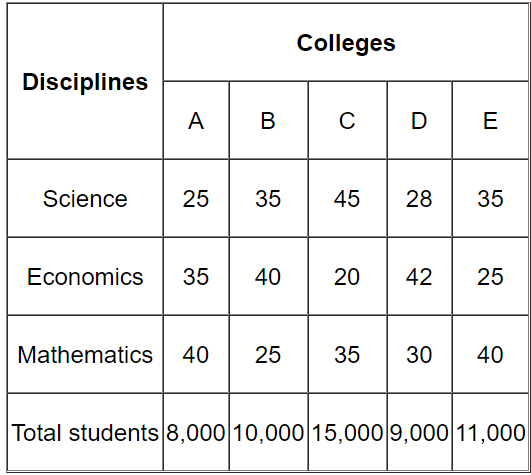
View SolutionIF the data of the total students college wise, is represented by a pie chart, what is the central angle of the sector representing college E.
View SolutionIn a test in Mathematics, 20% of the students obtained ''first class''. If the data are represented by a Pie - chart, what is the central angle corresponding to ''first class''?
View SolutionIn a test in Mathematics 20% of the students obtained first class If the data are represented by a Pie Chart, what is the central angle corresponding to "first class''?
(a)20∘
(b)36∘
(c)72∘
(d)144∘
View Solution
In the given pie-chart. what is the number of employees working in department A?
View Solution

