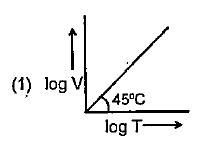
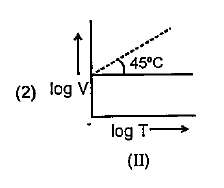
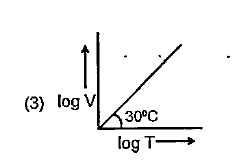
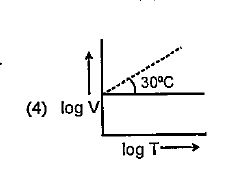
Ten moles of an ideal gas are filled In a closed vessel. The vessel has cylinder and piston type arrangement and pressure of the gas remains constant at 0.821 atm. Which of the following graph represents correct variation of log V vs log T ? (V = volume in litre and T = temperature in Kelvin)Solution in Bengali


The correct Answer is:A
Step by step video, text & image solution for Ten moles of an ideal gas are filled In a closed vessel. The vessel has cylinder and piston type arrangement and pressure of the gas remains constant at 0.821 atm. Which of the following graph represents correct variation of log V vs log T ? (V = volume in litre and T = temperature in Kelvin) by Chemistry experts to help you in doubts & scoring excellent marks in Class 11 exams.
Topper's Solved these Questions
Similar Questions
Based upon Boyle's law draw the plot of P vs V and also PV vs P.
02:47View SolutionWhich of the following statement is incorrect?
02:46View SolutionFor a closed container containing 100 mol of an ideal gas fitted with movable, frictionless, weightless piston operating such that pressure of gas remain constant at 8.21 atm, which graph repsents correct variation of log V v//s log T where V is in litre and T is in Kelvin ? (R = 0.0821 (atmL)/(molK))
View SolutionFor a closed container containing 10 moles of an ideal gas, at constant pressure of 0.82 atm, which graph correctly represent, variation of log V us log T where volume is in litre and temp. in kelvin :
02:46View SolutionWhich of the following volume (V)-temperature (T) plots represents the behaviour of one mole of an ideal gas at one atmoshperic pressure?
03:40View SolutionFor an ideal gas, under isobaric condition, a graph between log V vs log T :
05:10View SolutionTen moles of an ideal gas are filled in a closed vessel. The vessel has cylinder and piston type arrangement and pressure of the gas remains constant at 0.821 atm. Which of the following graph represents correct variation of log V vs log T?
(V = Volume in litre and T = temperature in Kelvin)View Solutionস্থির উষ্ণতায় নির্দিষ্ট ভরের আদর্শ গ্যাসের logP বনাম logV লেখচিত্রটি আঁকো এবং নতির মান নির্দেশ করাে ।
View SolutionFor 1 mol ofan ideal gas at a constant temperature T, the plot of (log P) against (log V) is a (P: Pressure, V: Volume)
02:18View SolutionIf a graph is plotted between log V and log T for 2 moles of a gas of constant pressure of 0.0821 atm, then which of the following statements are correct?
02:18View SolutionA graph is ploted between log V and log T for two moles of gas at constant pressure of 0.0821 atm. [V and T are in litres and kelvin]. Then which of the following is/are correct
03:42View SolutionA graph is ploted between log V and log T for two moles of gas at constant pressure of 0.0821 atm. [V and T are in litres and kelvin]. Then which of the following is/are correct
03:37View SolutionFor a closed container containing 100 mol of an ideal gas fitted with movable, frictionless, weightless piston operating such that pressure of gas remain constant at 8.21 atm, which graph repsents correct variation of log Vv/s log T where V is in litre and T is in Kelvin ? (R=0.0821atmLmolK)
05:16View SolutionFor a closed container containing 10 moles of an ideal gas, at constant pressure of 0.82 atm, which graph correctly represent, variation of log V us log T where volume is in litre and temp. in kelvin :
05:08View SolutionWhich of the following volume-temperature (V−T) plots represents the behaviour of 1mole of an ideal gas at the atmospheric pressure?
05:26View Solution

