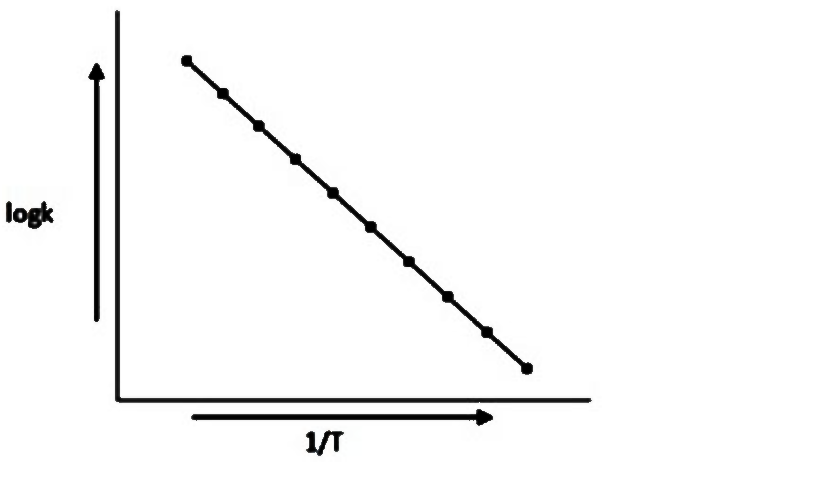
The graph of logK vs X is linear with a slop = −E2.303R. What is X?Solution in Assamese
Step by step video & image solution for The graph of logK vs X is linear with a slop = -E/(2.303R). What is X? by Chemistry experts to help you in doubts & scoring excellent marks in Class 12 exams.
Updated on:21/07/2023Topper's Solved these Questions
Similar Questions
Mention the hydrolysis products of sucrose.
View SolutionWhat is the composition of tincture of iodine?
View SolutionWhat does the slops of stress versus strain graph indicate?
View SolutionWhat is the average value of shaded portion of the graph of E vs t ?
View SolutionWhich among the following plots are linear (a -x) is the concentration of reactant remaining after time , t (a) (a - x) vs t , for a first order reaction (b) (a - x) vs t , for a zero order reaction (c) (a - x) vs t , for a second order reaction (d) 1/(a - x) vs t , for a second order reaction
View SolutionGraphs: s vs t, v vs t and a vs t
View Solutionकौन-सा ग्राफ रेखीय होगा ?
P vs. V अथवा Pvs.1V
View SolutionA graph of x/m vs pressure at constant temperature is called adsorption isotherm.Explain
View SolutionWhen a plot between logk and 1/T is plotted we get the graph as shown.

What is the value of slope in the graph?
View SolutionWhich of the following graph between (x//m) vs P is correct?
View SolutionRate constant k of a reaction varies with temperature T according to the following Arrhenius equation.
logklogAEa2.303R(1T) where Ea is the activation energy . When a graph is plotted is or logk Vs 1T a straight line with a slope of −400K is obtained . Calculate the activation energy .
View Solutionফ্রয়েন্ডলিশ অধিশোষণ সমতাপীয়-এর ক্ষেত্রে log(XM) বনাম logp-এর যে সরলরৈখিক লেখচিত্র পাওয়া যায় সেই সংক্রান্ত নীচের বক্তব্যগুলির কোটি সঠিক? (k ও n হল ধ্রুবক)
View SolutionIn an adsorption experiment a graph between log x/m vs. log p is found to be linear with a slope of 45∘ . The intercept on the log x/m axis was found to be 0.3010. What is x/m if pressure is 0.6 bar
View SolutionWhich of the following graph between (x/m) vs P is correct?
View SolutionPotential Due to Point Charges||V vs X Graph
View Solution
