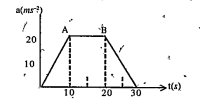
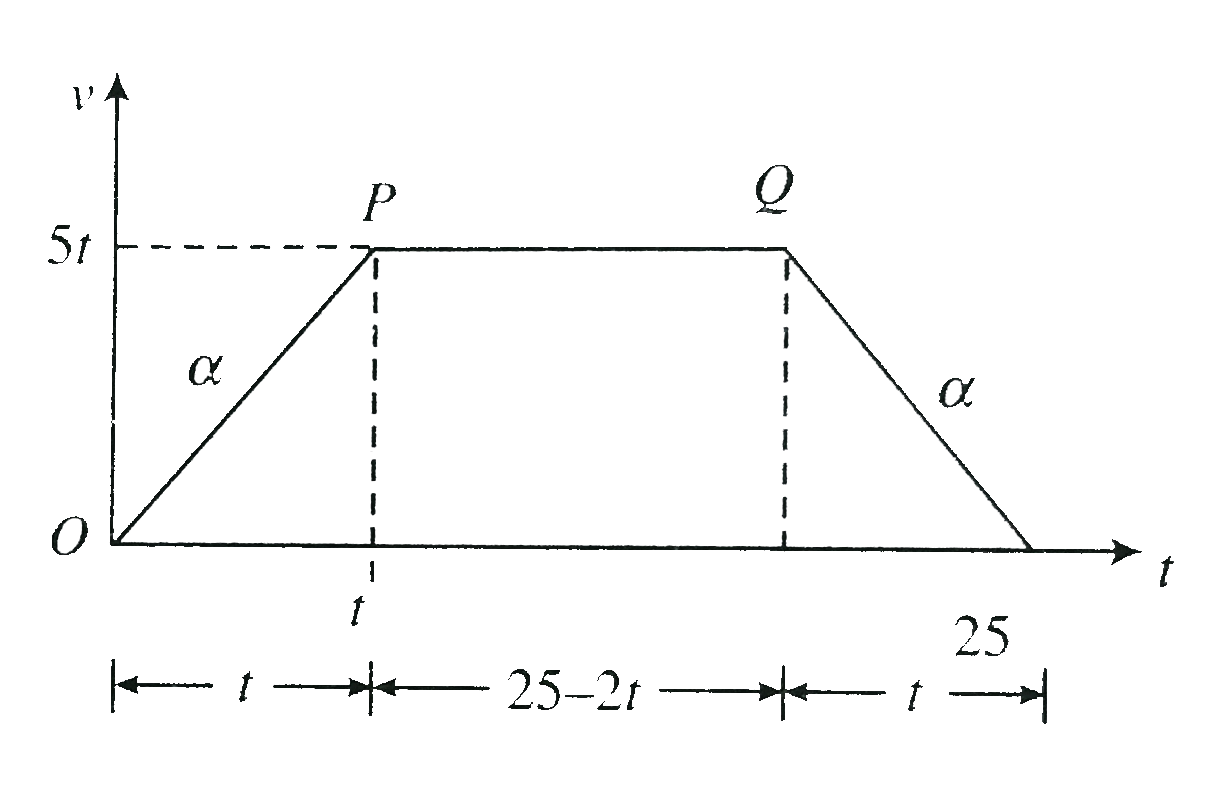
From the graph calculate the average acceleration in first twenty sec.
 Solution in Assamese
Step by step video & image solution for From the graph calculate the average acceleration in first twenty sec. by Physics experts to help you in doubts & scoring excellent marks in Class 11 exams.
Updated on:21/07/2023Topper's Solved these Questions
Similar Questions
What is vector product of two vectors ? Give two examples .
View SolutionAt what position, velocity of a particle in SHM is maximum?
View SolutionThe average of twenty-five numbers is 18, the average of first twelve is 14 and that of last twelve is 17. The thirteenth number is
View SolutionThe speed time graph of a body is shown in Figure. Observer the graph carefully and answer the following : (i) What kinds of motion are represented by OP, PQ and QR ? (ii) Calculate acceleration of the body for the first 2 sec . (iii) Calculate retardation of body from 8 s to 14 s .
View SolutionFig. 2 (b) .16 shows the time-acceleration graph for a particle in rectillinear motion. Find the averate acceleration in first twenty seconds. .
View SolutionFig. 3.39 shows the acceleration - time graph for a particle in rectilinear motion. Find the average acceleration in first 20 s.
View SolutionDuring one dimensional motion on x-axis Velocity time graph for particle is given.
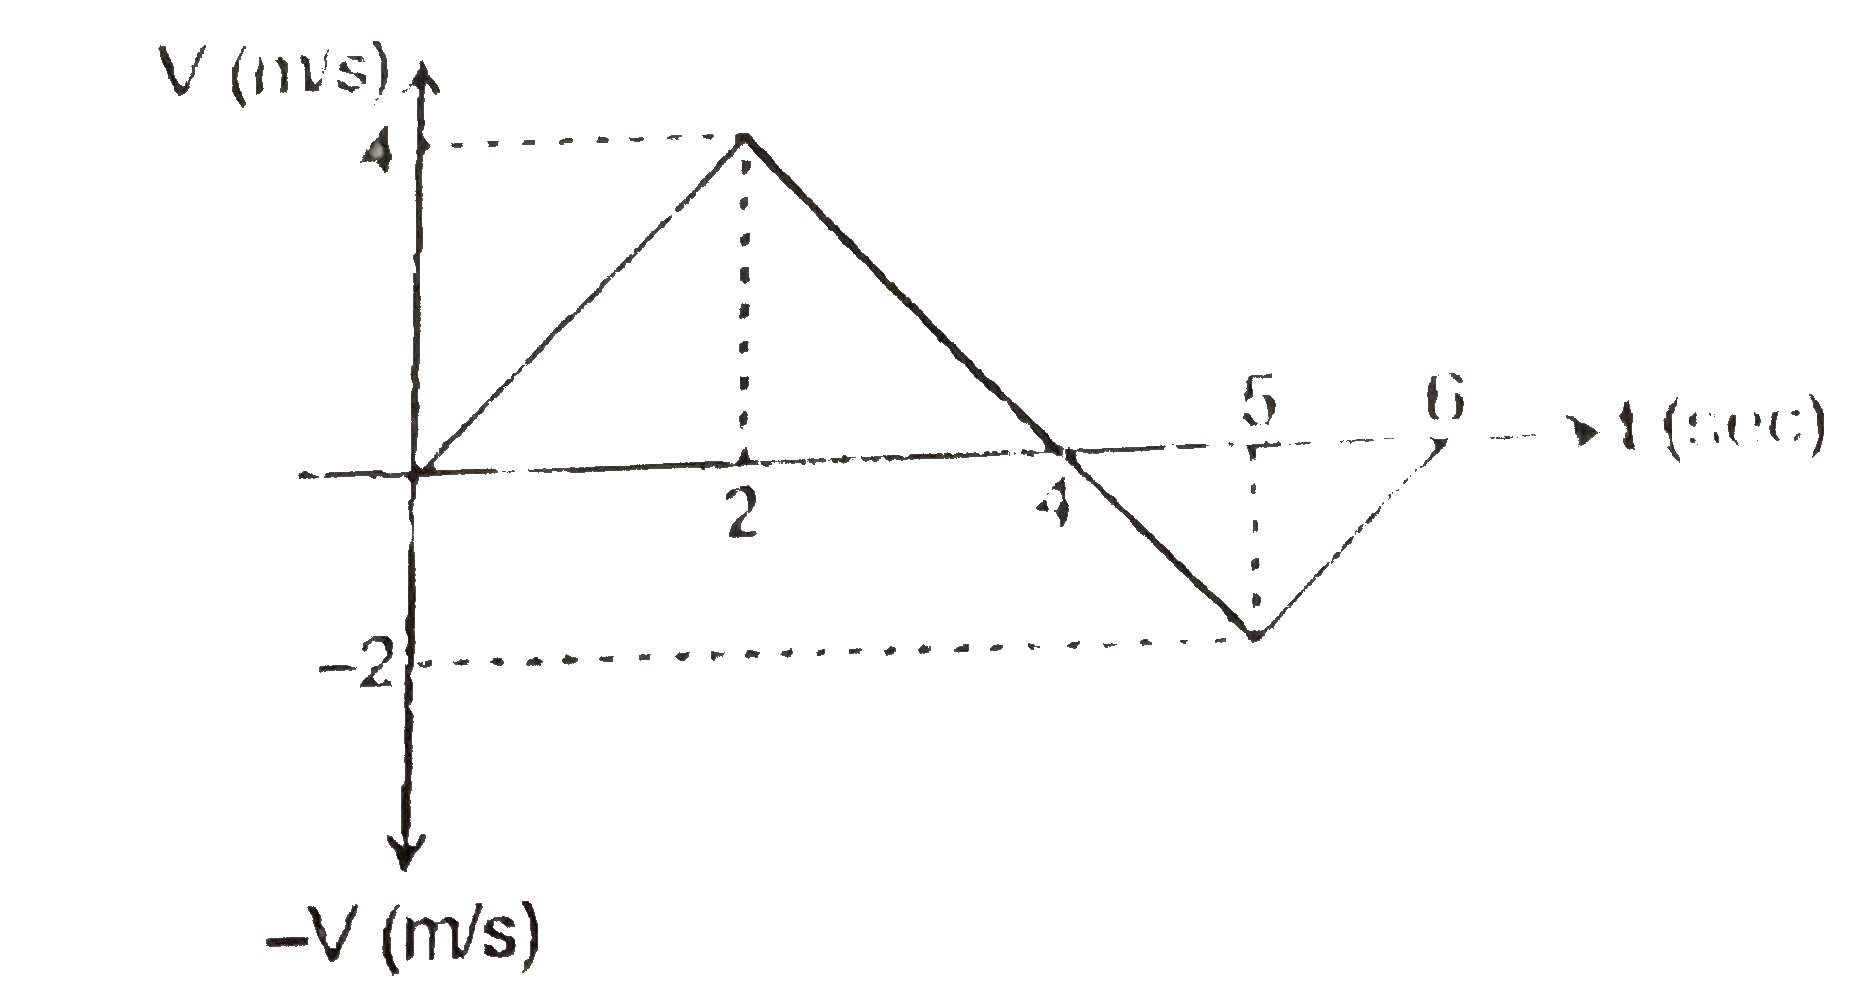
Average acceleration between (t = 0 sec) to (t = 6 sec)
View SolutionThe velocity-time graph of an object is given below. Calculate the average acceleration of the object in the time interval of 4 s to 6 s.
View SolutionIf Electric-current 'i' time (t) graph shown in figure. The average current in first 6 sec. is :-
View Solutionएक वस्तु विराम से एक सरल रेखा के अनुदिश 8मी/से2 के त्वरण से गतिशील है । इस वस्तु का समय-वर्ग ग्राफ अनुदिश बनाइए तथा इस ग्राफ से निम्नलिखित की गणना कीजिए :
(i) वस्तु का 5 सेकण्ड बाद वेग ।
(ii) प्रथम 5 सेकण्ड में वस्तु द्वारा चली दूरी ।
(iii) इस अन्तराल में वस्तु का औसत वेग ।
View SolutionThe velocity time graph of a body moving in a straight line is shown. Find its (a) instantaneous velocity at t = 1.5 sec (b) average acceleration from t = 1.5 sec. to t = 2.5 sec (c) draw its acceleration time graph from t = 0 to t = 2.5 sec
View Solutionदिये गये चित्र में एक सीधी रेखा में गति करने वाली वस्तु का समय त्वरण ग्राफ दिया गया है| ग्राफ से ज्ञात कीजिये
(i ) प्रथम 20 सेकण्ड से औसत त्वरण
(ii ) वस्तु पर किस समय से किस समय तक बल अचर रहा ?
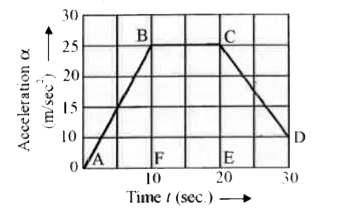
View SolutionFind the modulus of average acceleration (in m/s2) of the block from time t = 2 sec to t = 4 sec.
View SolutionFrom the adjoining acceleration-time graph for a particle, find the average acceleration in initial 30s.
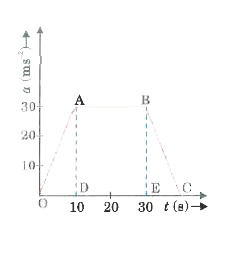
View SolutionFind the average acceleration in first 20s. (Hint: Area under a−t graph is equal to the change in velocity).
 .
.
View Solution
