(i) What are matter waves ?
(ii) Show with the help of a labelled graph how their wavelength a varies with their linear momentum (p).
Step-by-Step Solution
1. Definition: Matter waves are waves associated with particles that are in motion. This concept was introduced by the French physicist Louis de Broglie in 1924.
2. De Broglie Hypothesis: De Broglie proposed that every moving particle or object has an associated wave. This wave-like behavior is a fundamental aspect of quantum mechanics.
3. Wave-Particle Duality: Matter waves illustrate the wave-particle duality of matter, meaning that particles such as electrons exhibit both particle-like and wave-like properties.
4. Mathematical Representation: The wavelength (λ) of matter waves can be calculated using the de Broglie equation:
λ=hp
where:
- λ = wavelength of the matter wave
- h = Planck's constant (approximately 6.626×10⁻³⁴Js)
- p = linear momentum of the particle (given by p=mv, where m is mass and v is velocity)
(ii) Graphical Representation of Wavelength vs. Linear Momentum
1. Understanding the Relationship: From the de Broglie equation λ=hp, we can see that wavelength (λ) is inversely proportional to momentum (p). This means that as momentum increases, the wavelength decreases.
2. Labeling the Axes:
- On the x-axis, we will plot the linear momentum (p).
- On the y-axis, we will plot the wavelength (λ).
3. Graph Behavior:
- When p=0 (the particle is at rest), λ approaches infinity. This indicates that a stationary particle has an infinitely long wavelength.
- As p increases, λ decreases, showing an inverse relationship.
4. Sketching the Graph:
- Start by marking the origin (0,0).
- Draw a curve that approaches the y-axis as it moves left (indicating that as momentum approaches zero, wavelength approaches infinity).
- The curve should slope downwards, indicating that as momentum increases, wavelength decreases.
5. Final Graph: The graph will show an exponential decay curve, starting from the point where p=0 (λ = ∞) and decreasing as p increases.
λ=hp
where:
- λ = wavelength of the matter wave
- h = Planck's constant (approximately 6.626×10⁻³⁴Js)
- p = linear momentum of the particle (given by p=mv, where m is mass and v is velocity)
- On the x-axis, we will plot the linear momentum (p).
- On the y-axis, we will plot the wavelength (λ).
- When p=0 (the particle is at rest), λ approaches infinity. This indicates that a stationary particle has an infinitely long wavelength.
- As p increases, λ decreases, showing an inverse relationship.
- Start by marking the origin (0,0).
- Draw a curve that approaches the y-axis as it moves left (indicating that as momentum approaches zero, wavelength approaches infinity).
- The curve should slope downwards, indicating that as momentum increases, wavelength decreases.
Similar Questions
Show with the help of a labelled graph how their wavelength (λ) varies with their linear momentum (p).
View SolutionState how de-Broglie wavelength (λ) of moving particles varies with their linear momentum (P).
View Solution(i) State how de - Broglie wavelength (λ) of moving particles varies with their linear momentum (p).
(ii) State any one phenomenon in which moving particles exhibit wave nature.
View SolutionShow, with the help of a labelled graph, how thermo emf .e. developed by a thermocouple varies with θ, the temperature difference between the two junctions. On the graph, mark neutral temperature as θN and temperature of inversion as θ1.
View SolutionWhat is a particle or matter wave and how it is different from electro-megnetic wave?
View SolutionWhat is the photoelectric effect? With the help of suitable graph show the variation of photocurrent with (i) the intensity of incident radiation. (ii) the voltage applied between cathode and anode. (iii) the frequency of incident radiation.
View SolutionThe graph between deBroglie wavelength (λ) and (λp) is (p is the linear momentum of the particle)
View Solution(i) State Hook's law.
(ii) Draw a labelled graph of tensile stress against tensile strain for a metal wire upto the breaking point. Shhow on your graph the region in which Hooke's law is obeyed.
What is the significance of the area between the graph and the strain axis withing the Hooke's law region?
View Solution(i) How and at what stage does Plasmodium enter into a human body ?
(ii) With the help of a flow-chart only show the stages of asexual reproduction in the life-cycle of the parasite in the infected human.
(iii) Why does the victim show symptoms of high fever ?
View Solution
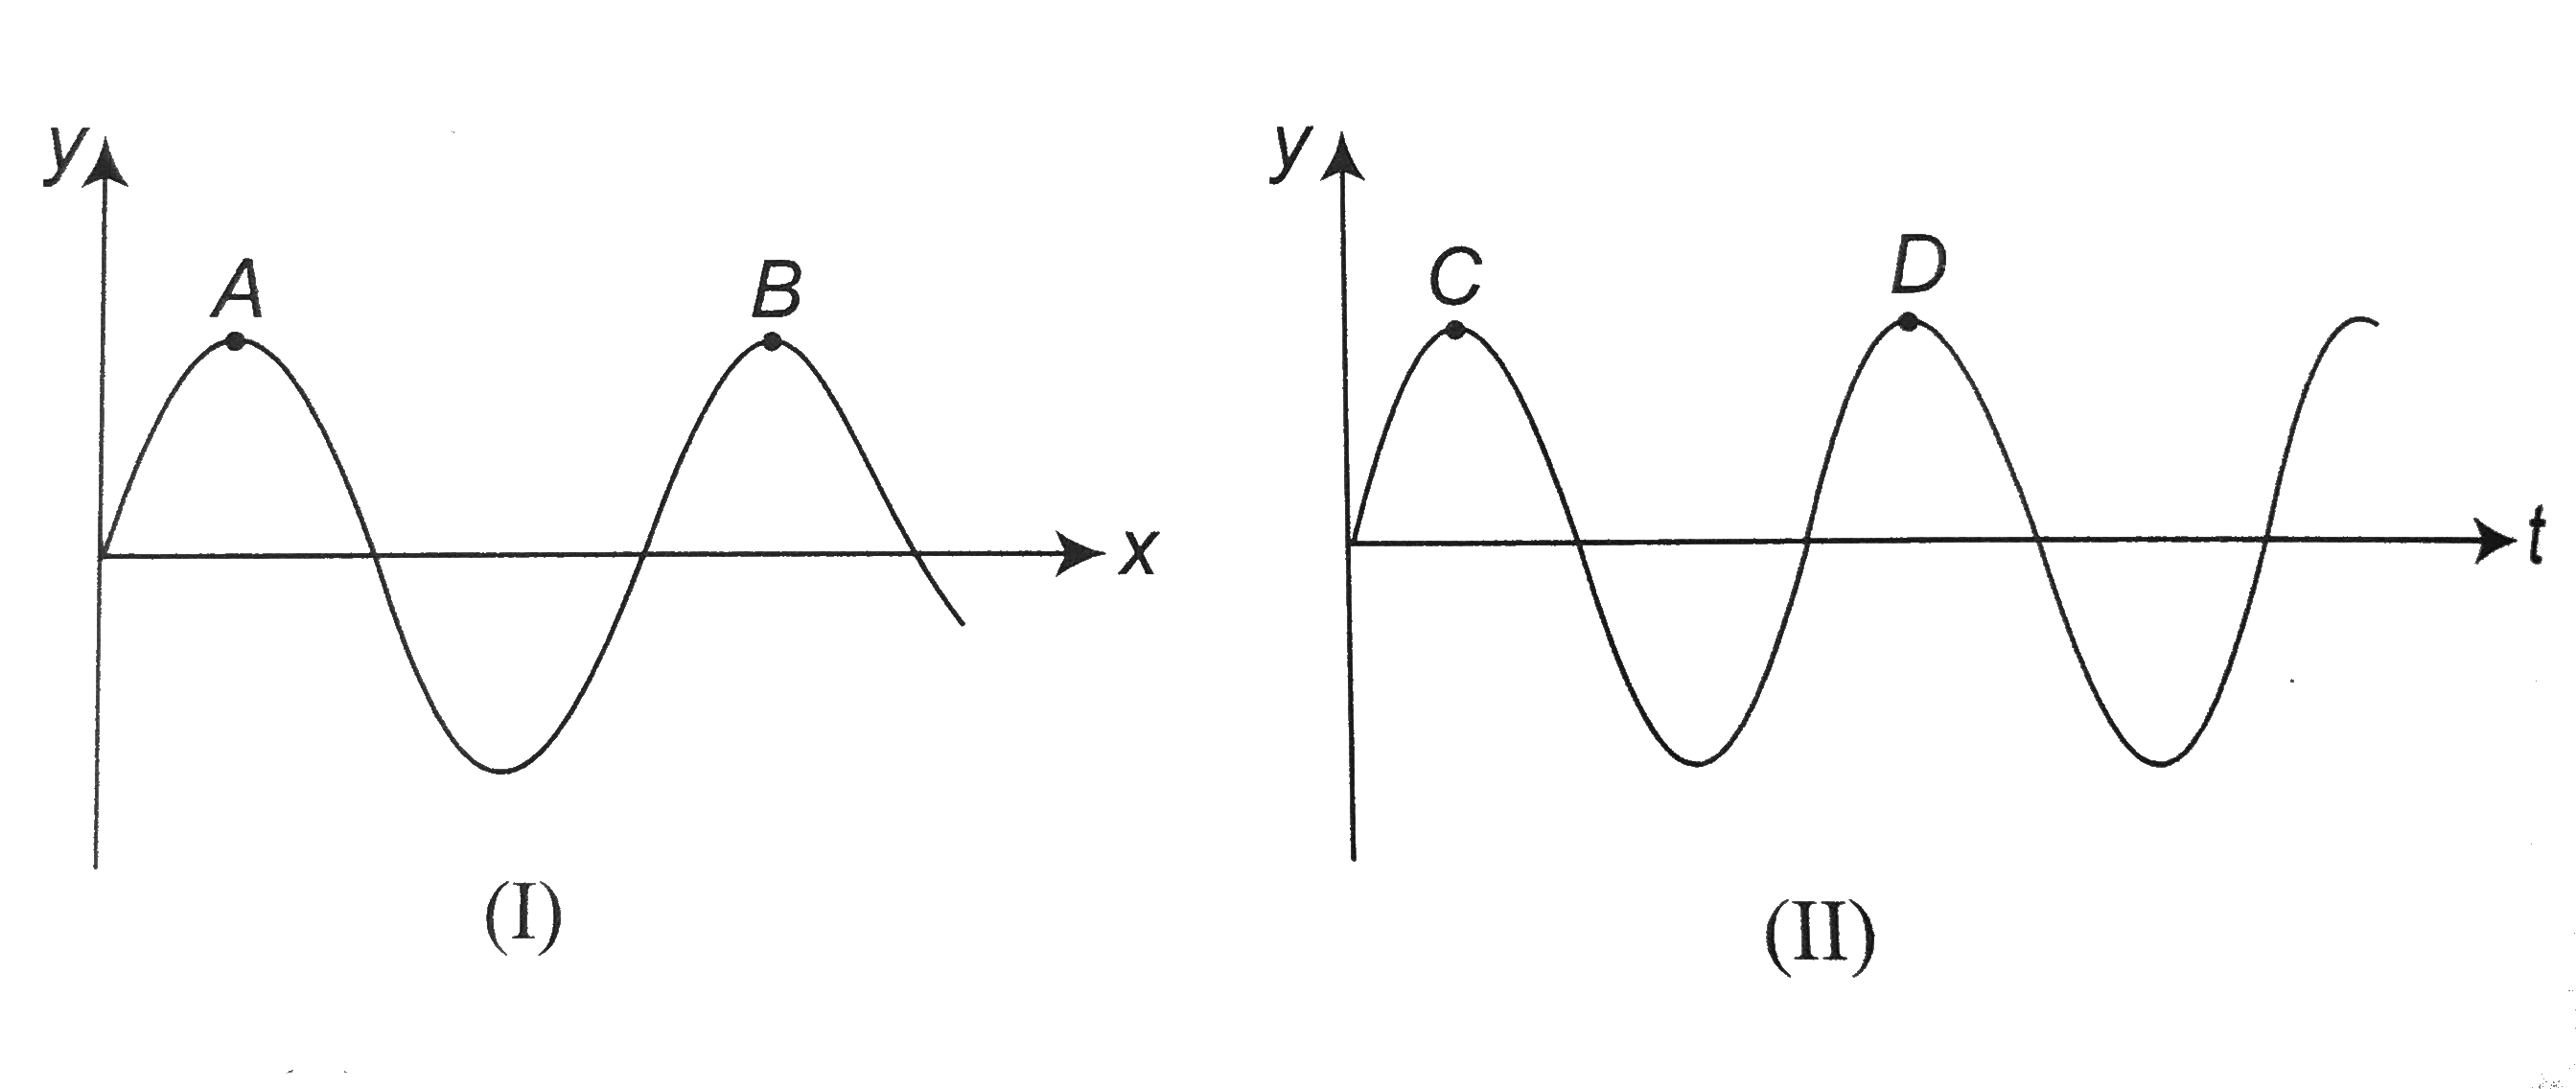
The same progressive wave is represented by two graphs I and II. Graph I shows how the displacement y varies with the distance x along the wave at a given time. Graph II shows how y varies with time t at a given point on the wave. The ratio of measurements AB to CD, marked on the curves represents:
View Solution
