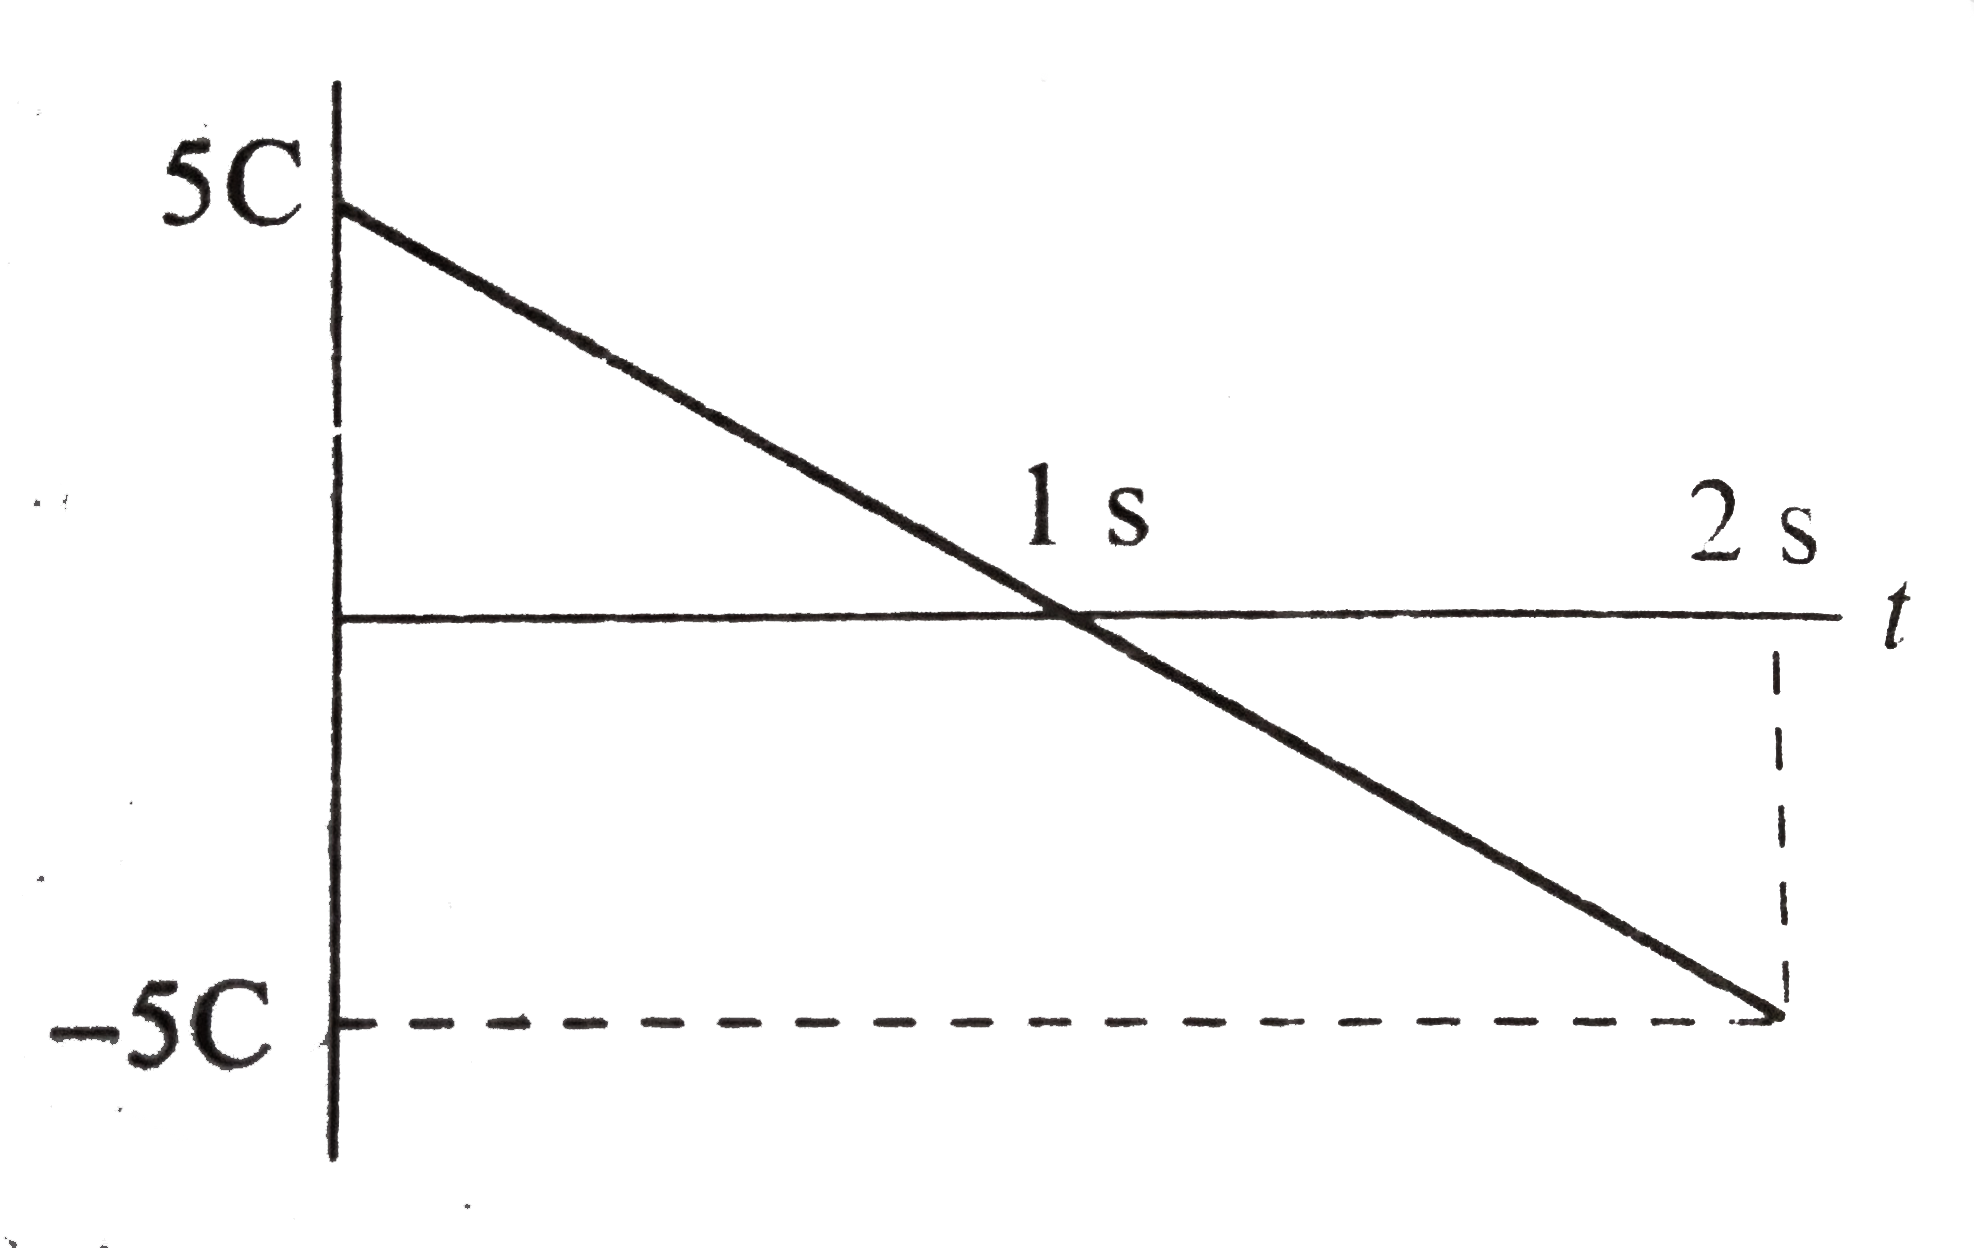
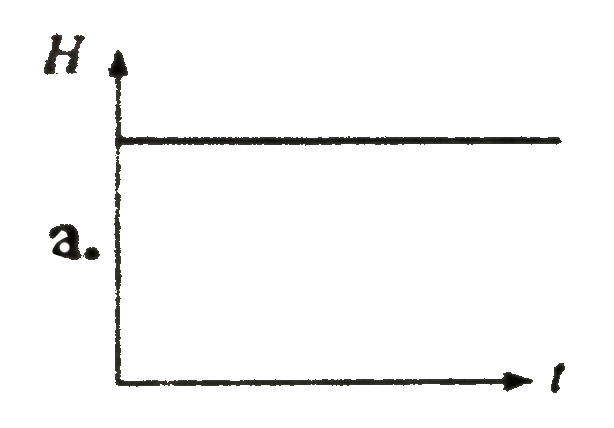
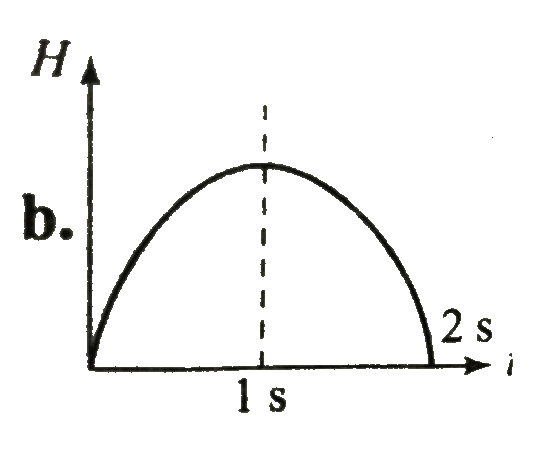
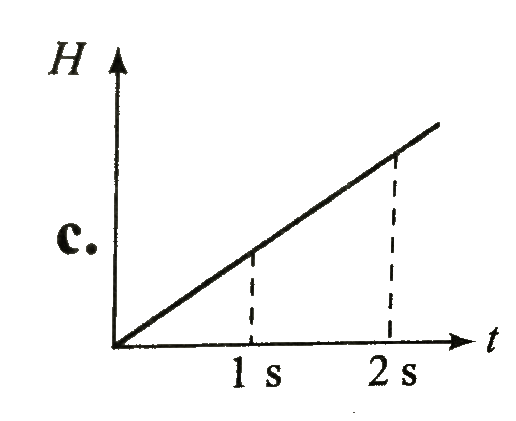
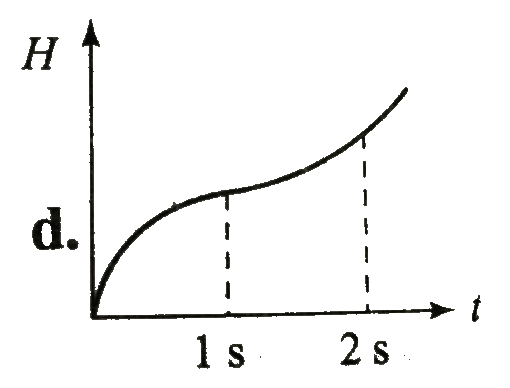
A charge passing through a resistor varies with time as shown in the figure. The amount of heat generated in time t is best represented (as a function of time ) by
The correct Answer is:C
c. i=dqdt= slope of q-t graph
= (-5) (which is constant)
Amount of heat generated in time t=(i2RT)∝t.
Similar Questions
Current passing through a resistor of resistance 5Ω varies with time as shown in the graph.Heat generated in the resistance during 3s is equal to
_PHY_E05_283_Q01.png) View Solution
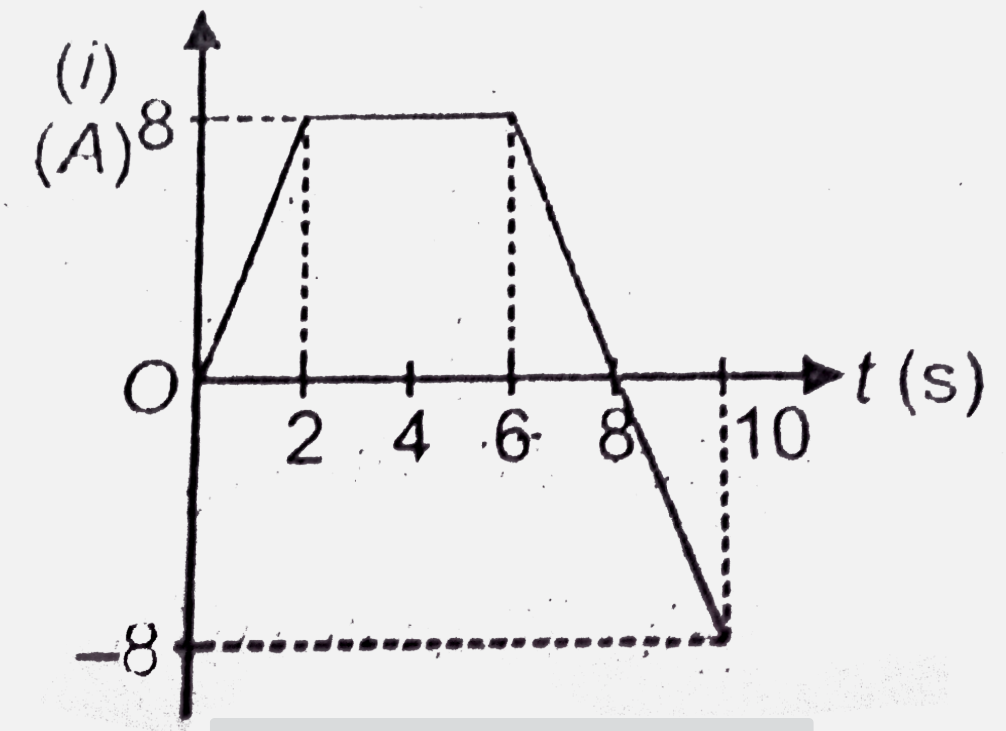
View SolutionThe current I through a conductor varies with time t as shown in figure. The average electric current during t=0 to t=10 s will be
 View Solution
Knowledge Check
- Question 1 - Select One
The charge flowing through a resistance R varies with time t as Q=at−bt2. The total heat produced in R is
Aa3RbBa3R2bCa3R3bDa3R6b
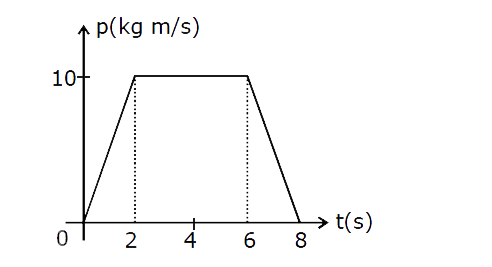
The momentum p of an object varies with time (t) as shown in figure. The corresponding force (F)- time (t) graph is -
 View Solution
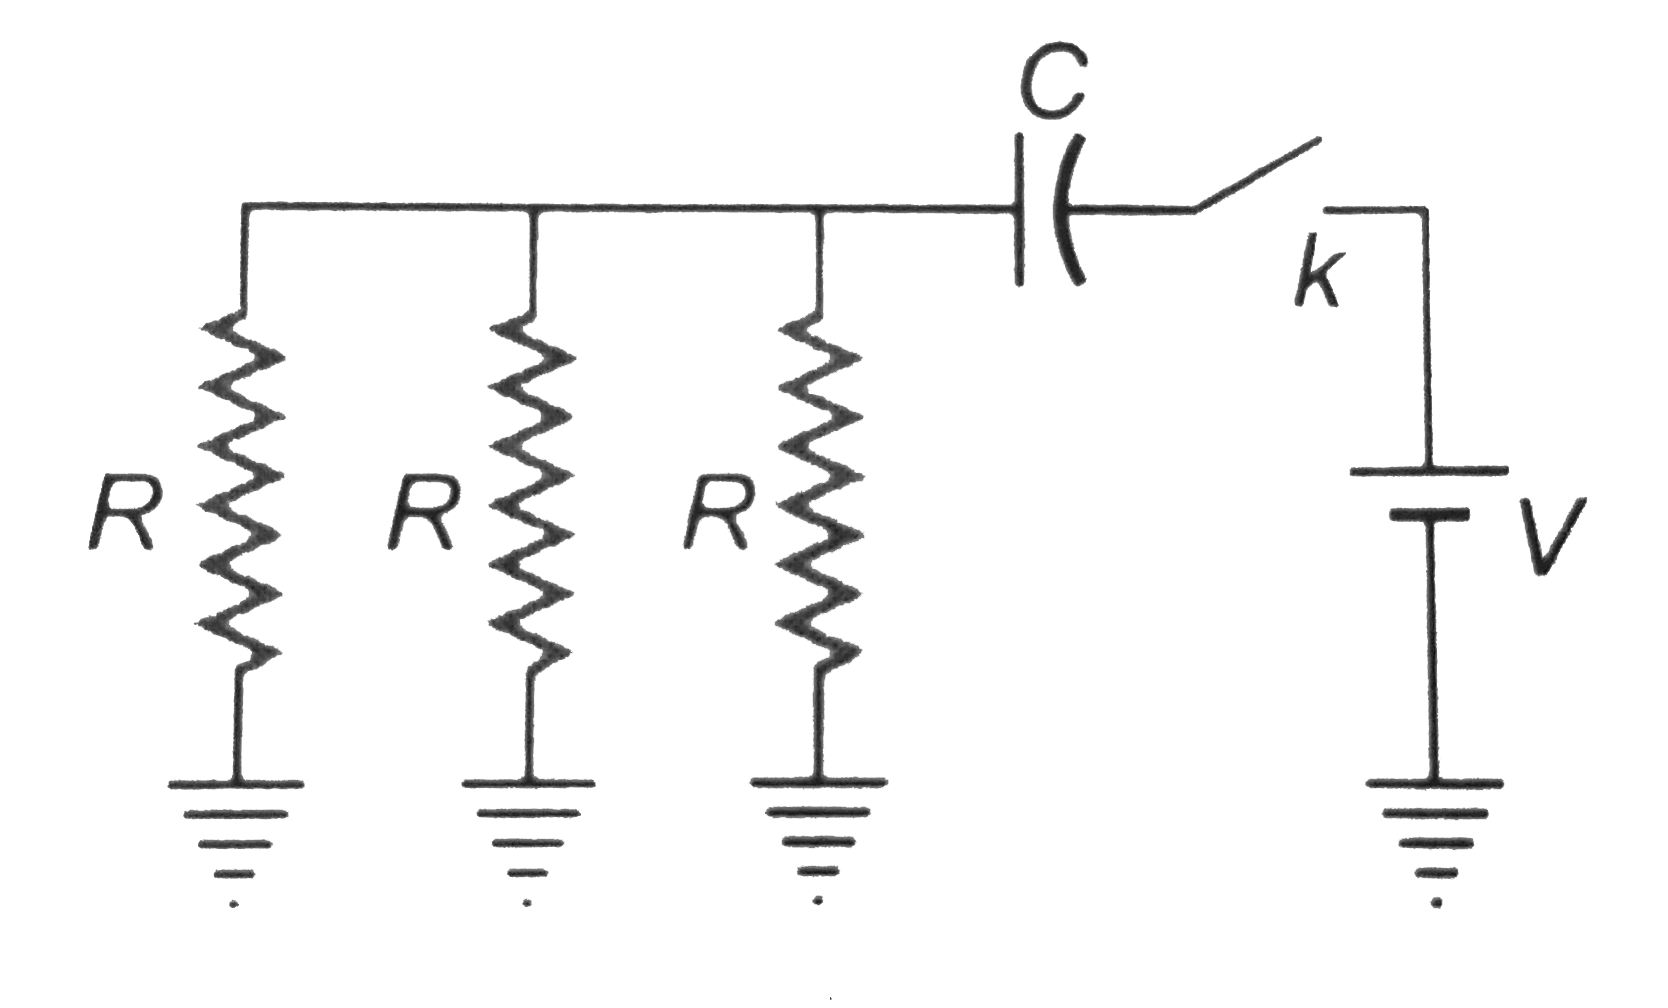
The switch shown n the figure is closed at t=0. The charge on the capacitor as a function of time is given by
 View Solution
If velocity v varies with time(t) as v=2t−3, then the plot between v and t is best represented by :
View SolutionThe magnetic flux through a coil varies with timet as shown in the diagram. Which graph best represents the variation of the e.m.f. E induced in the coil with time t?
View SolutionThe displacement of a particle as a function of time is shown in the figure. The figure shows that
 View Solution
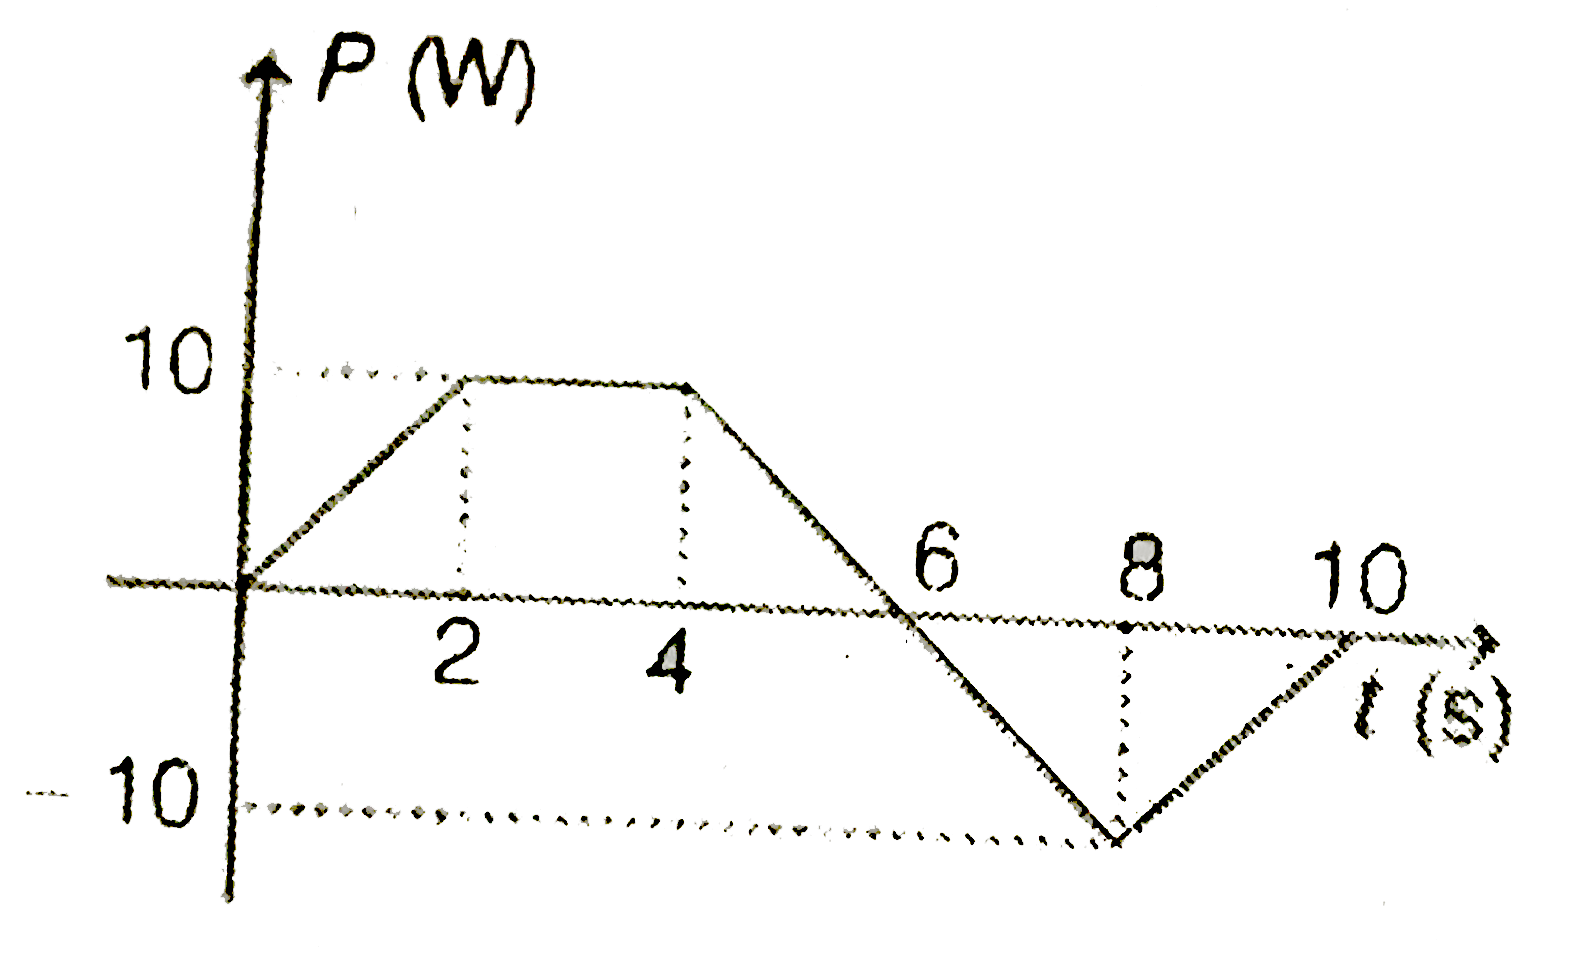
Power of a force acting on a block varies with time t as shown in figure. Then, angle between force acting on the block and its velocity is
 View Solution
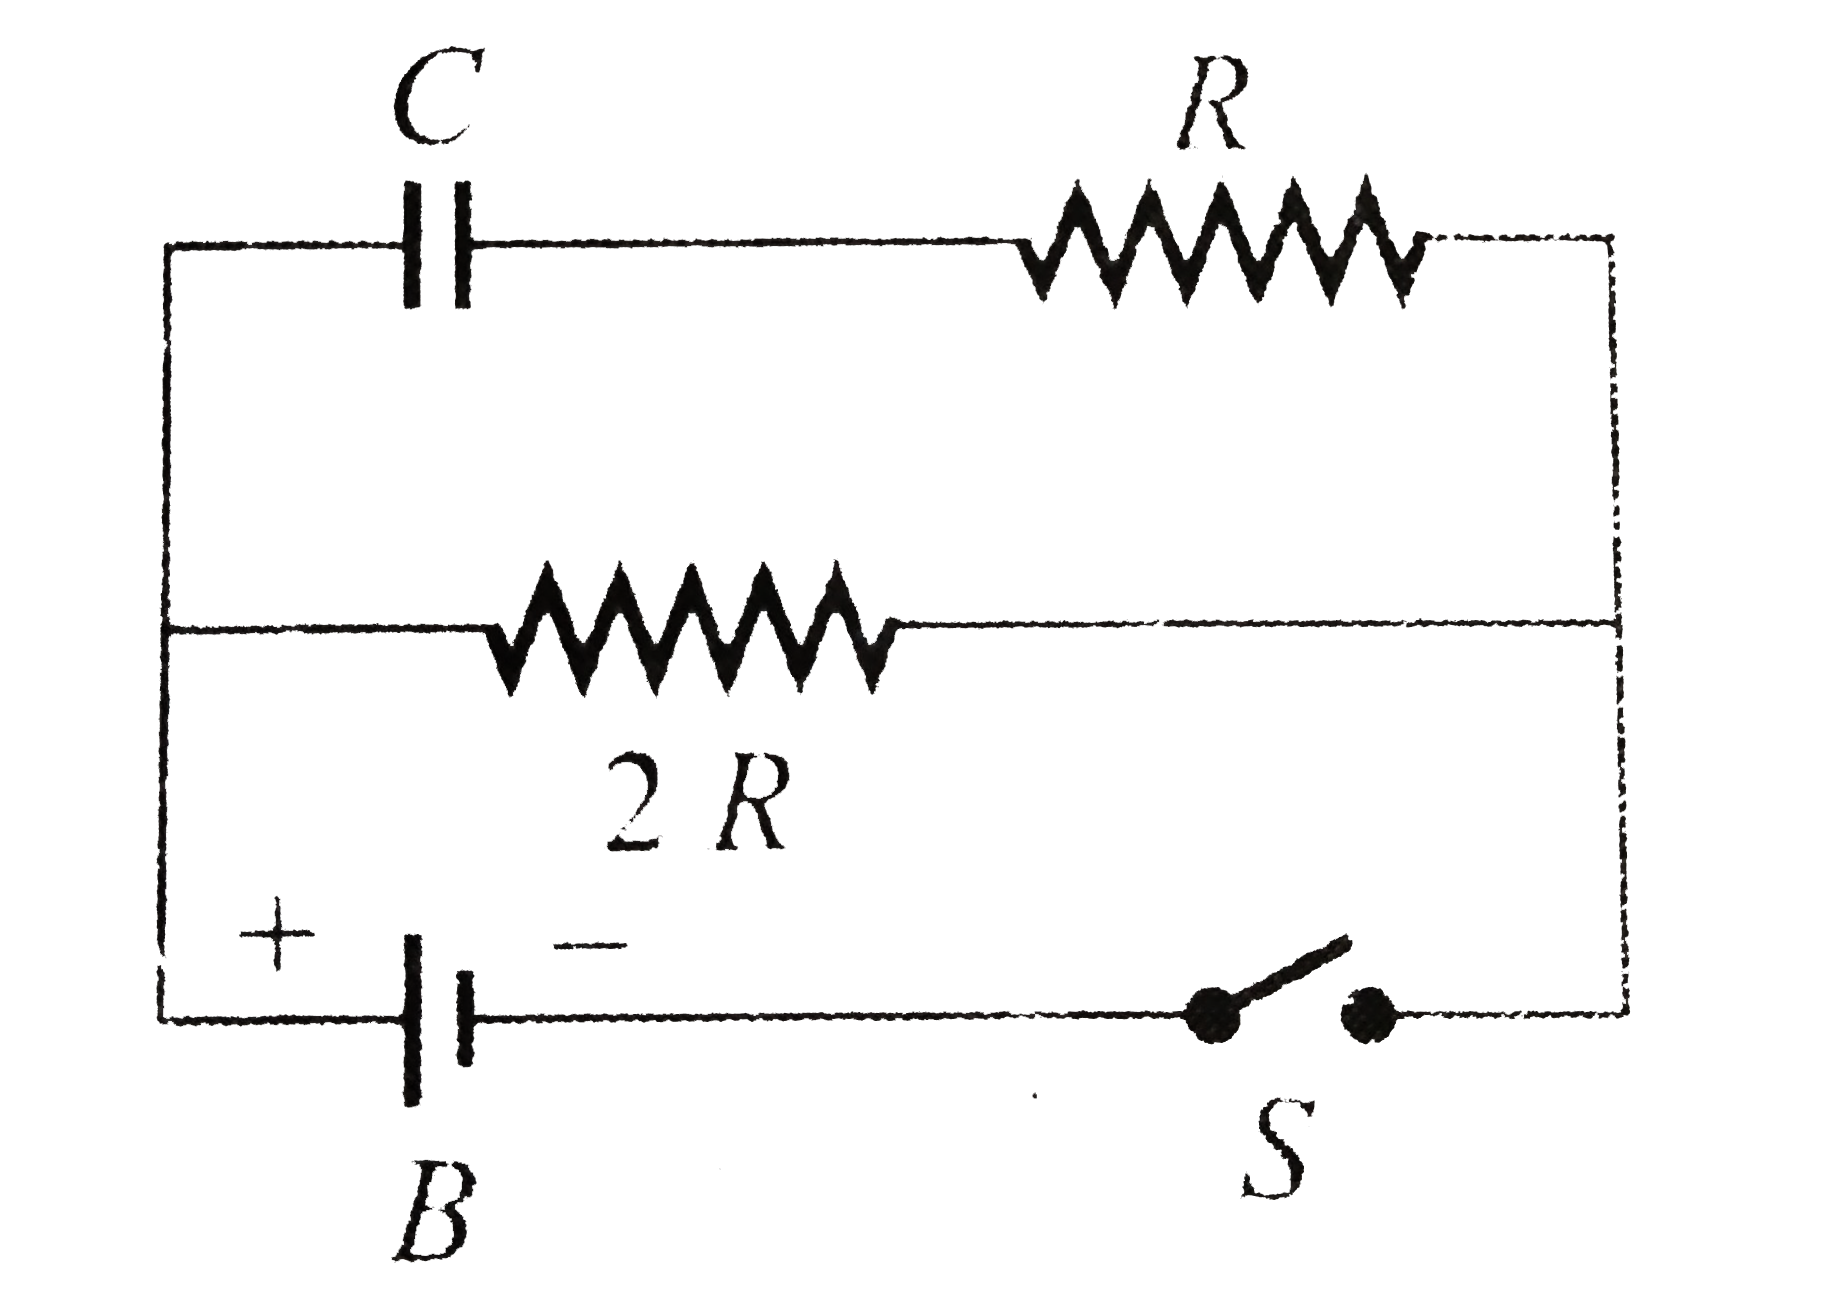
In the circuit shown in fig, if the switch S is closed at t=0 , the capacitor charges with a time constant
 View Solution

