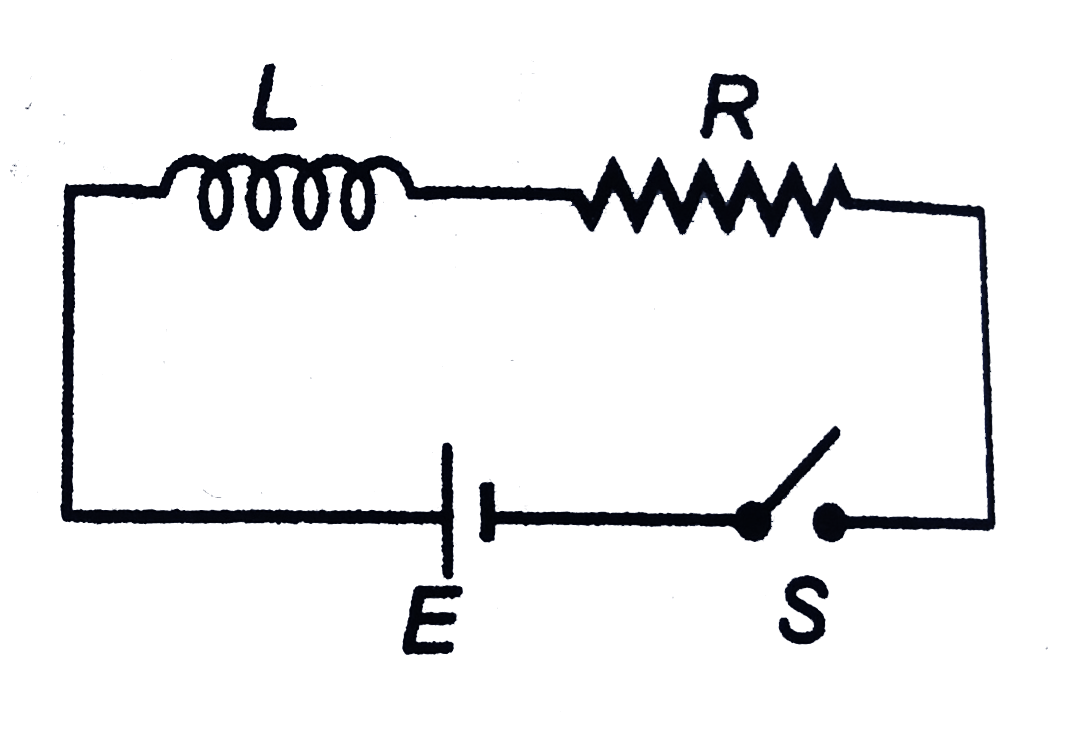
Switch S of the circuit shown in figure is closed at t = 0.
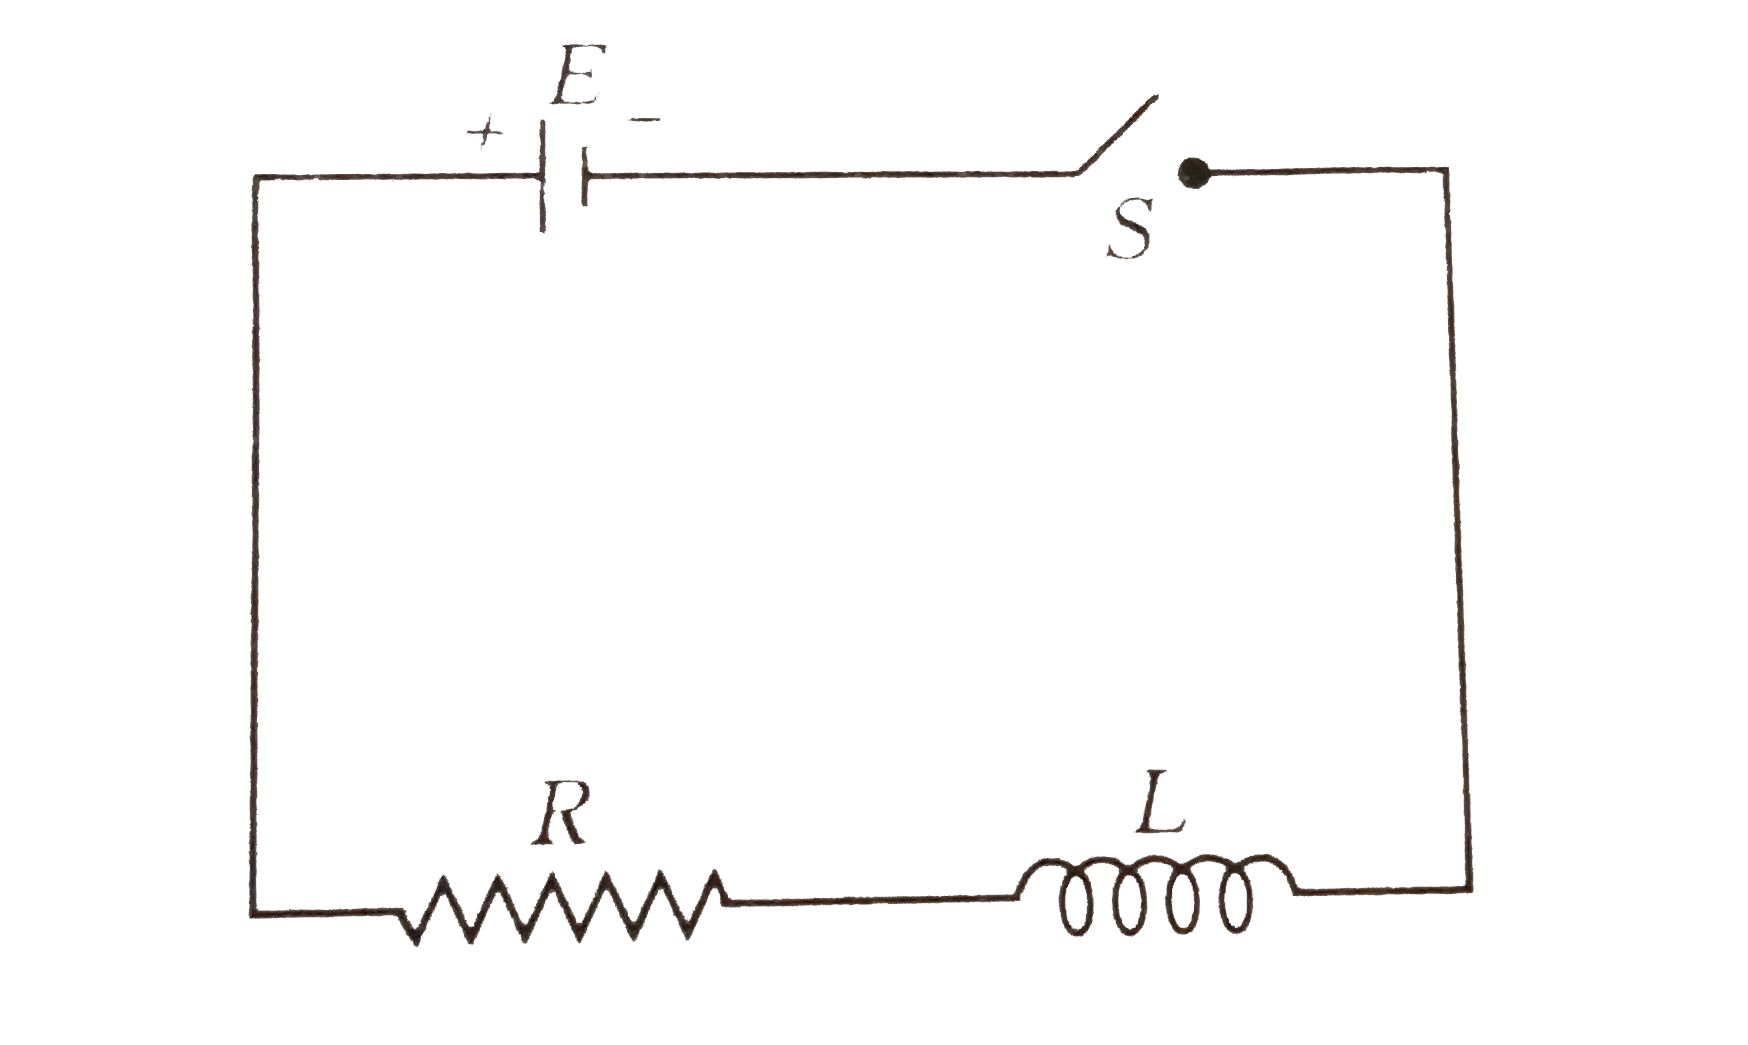
If emf in L is e and i is the current flowing through the circuit at time t, which of the following graphs is corrent?


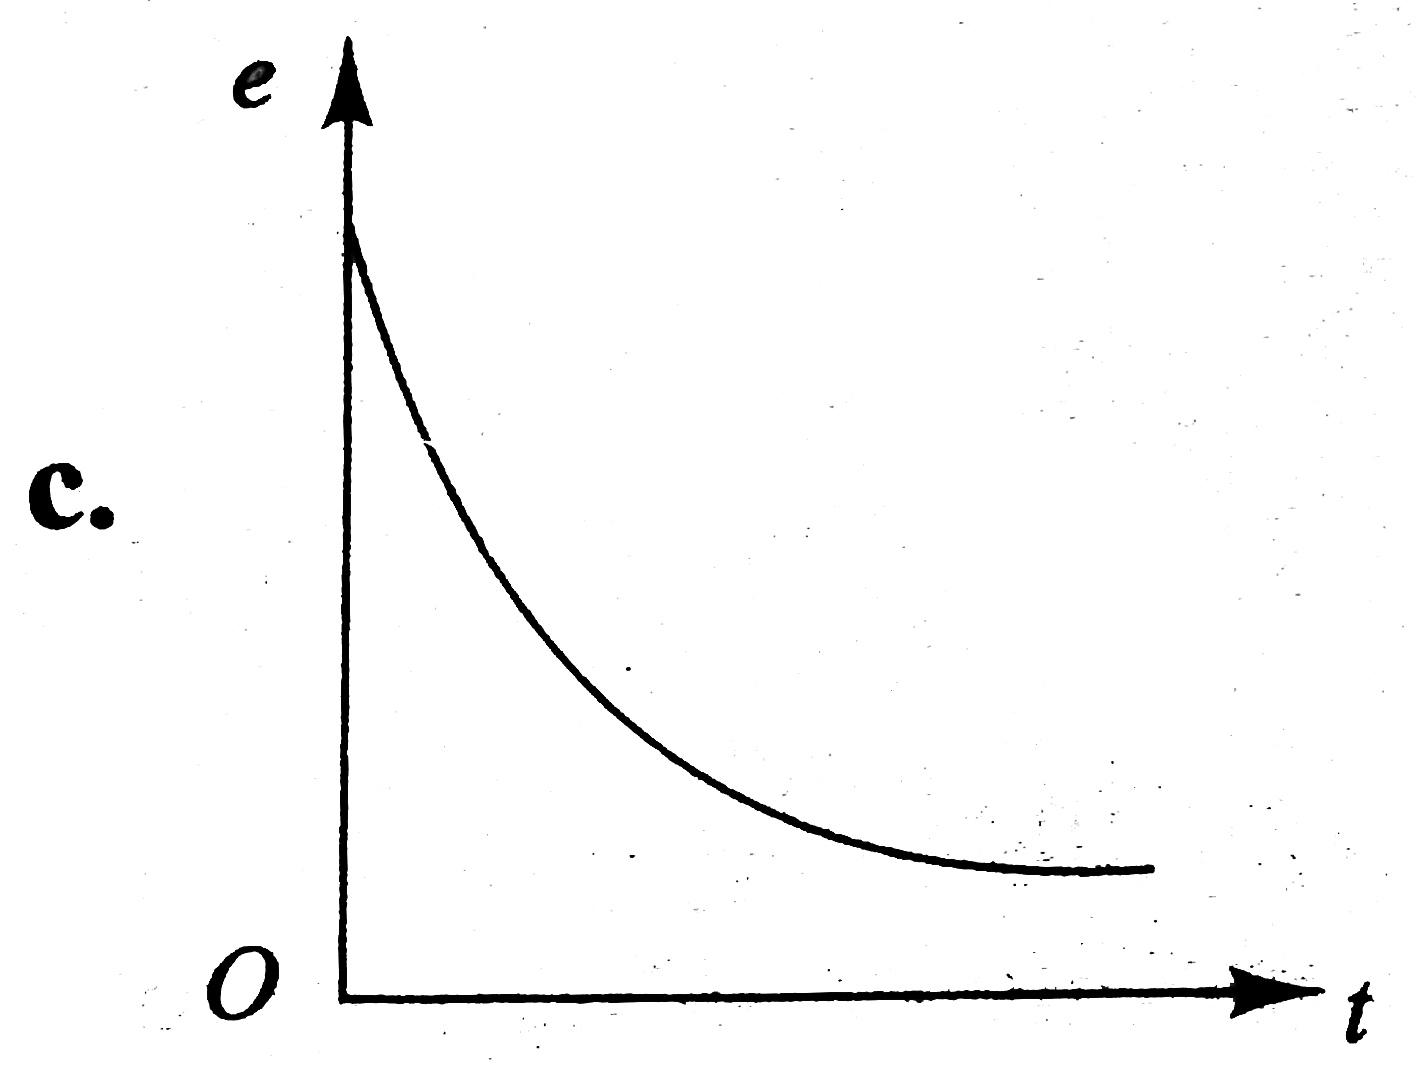
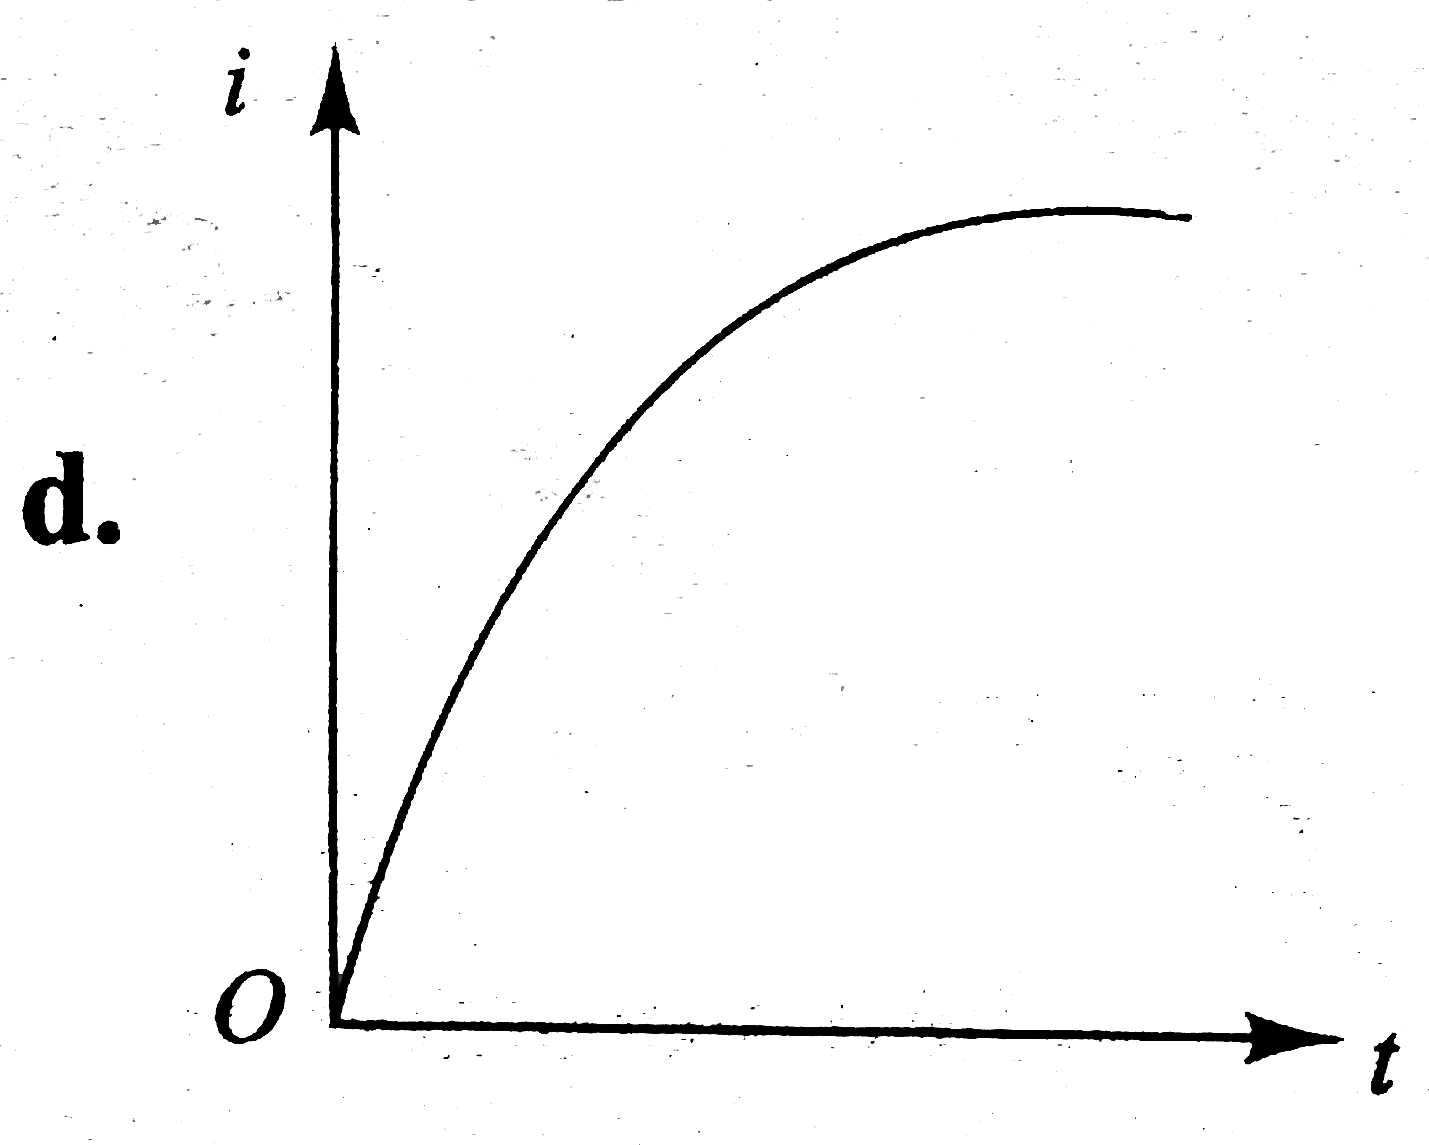
The correct Answer is:C, D
When switch is just closed in the circuit shown, at that moment current through the circuit is zero. Hence, e.m.f.induced across inductance L will be equal to e.m.f.E if the battery.
But as the current through the circuit increases, the induced e.m.f. in the solenoid decreases. But induced e.m.f. in the solenoid is
equal to |e|=Ldidt⋅
Since di/dt decreases as time passes, therefore the graph for induced e.m.f.e and time t will be as shows in option (c ).
Hence (a) is wrong and (c ) is correct.
The graph for current should be such that at initial moment current of increases of current gradully decreases. Hence, slope of the current-time curve should decrease with time. Therefore, the graph between current and time will be as shows in option (c).
Hnece(b) is wrong and (d) is correct.
Topper's Solved these Questions
- BOOK - CENGAGE PHYSICS ENGLISHCHAPTER - INDUCTANCEEXERCISE - Exercises (assertion-reasoning)2videos
INDUCTANCE
- BOOK - CENGAGE PHYSICS ENGLISHCHAPTER - INDUCTANCEEXERCISE - Exercises (linked Compreshension)36videos
INDUCTANCE
- BOOK - CENGAGE PHYSICS ENGLISHCHAPTER - INDUCTANCEEXERCISE - Exercises (single Correct )65videos
INDUCTANCE
- BOOK - CENGAGE PHYSICS ENGLISHCHAPTER - HEATING EFFECT OF CURRENTEXERCISE - Thermal Power in Resistance Connected in Circuit27videos
HEATING EFFECT OF CURRENT
- BOOK - CENGAGE PHYSICS ENGLISHCHAPTER - MAGNETIC FIELD AND MAGNETIC FORCESEXERCISE - Multiple Correct Answer type2videos
MAGNETIC FIELD AND MAGNETIC FORCES
Similar Questions
Switch S of the circuit shows in Fig is closed at t=0. If e denotes the induced emf in L and I is the current flowing through the circuit at time t, which of the following graphs is//are correct?
 View Solution
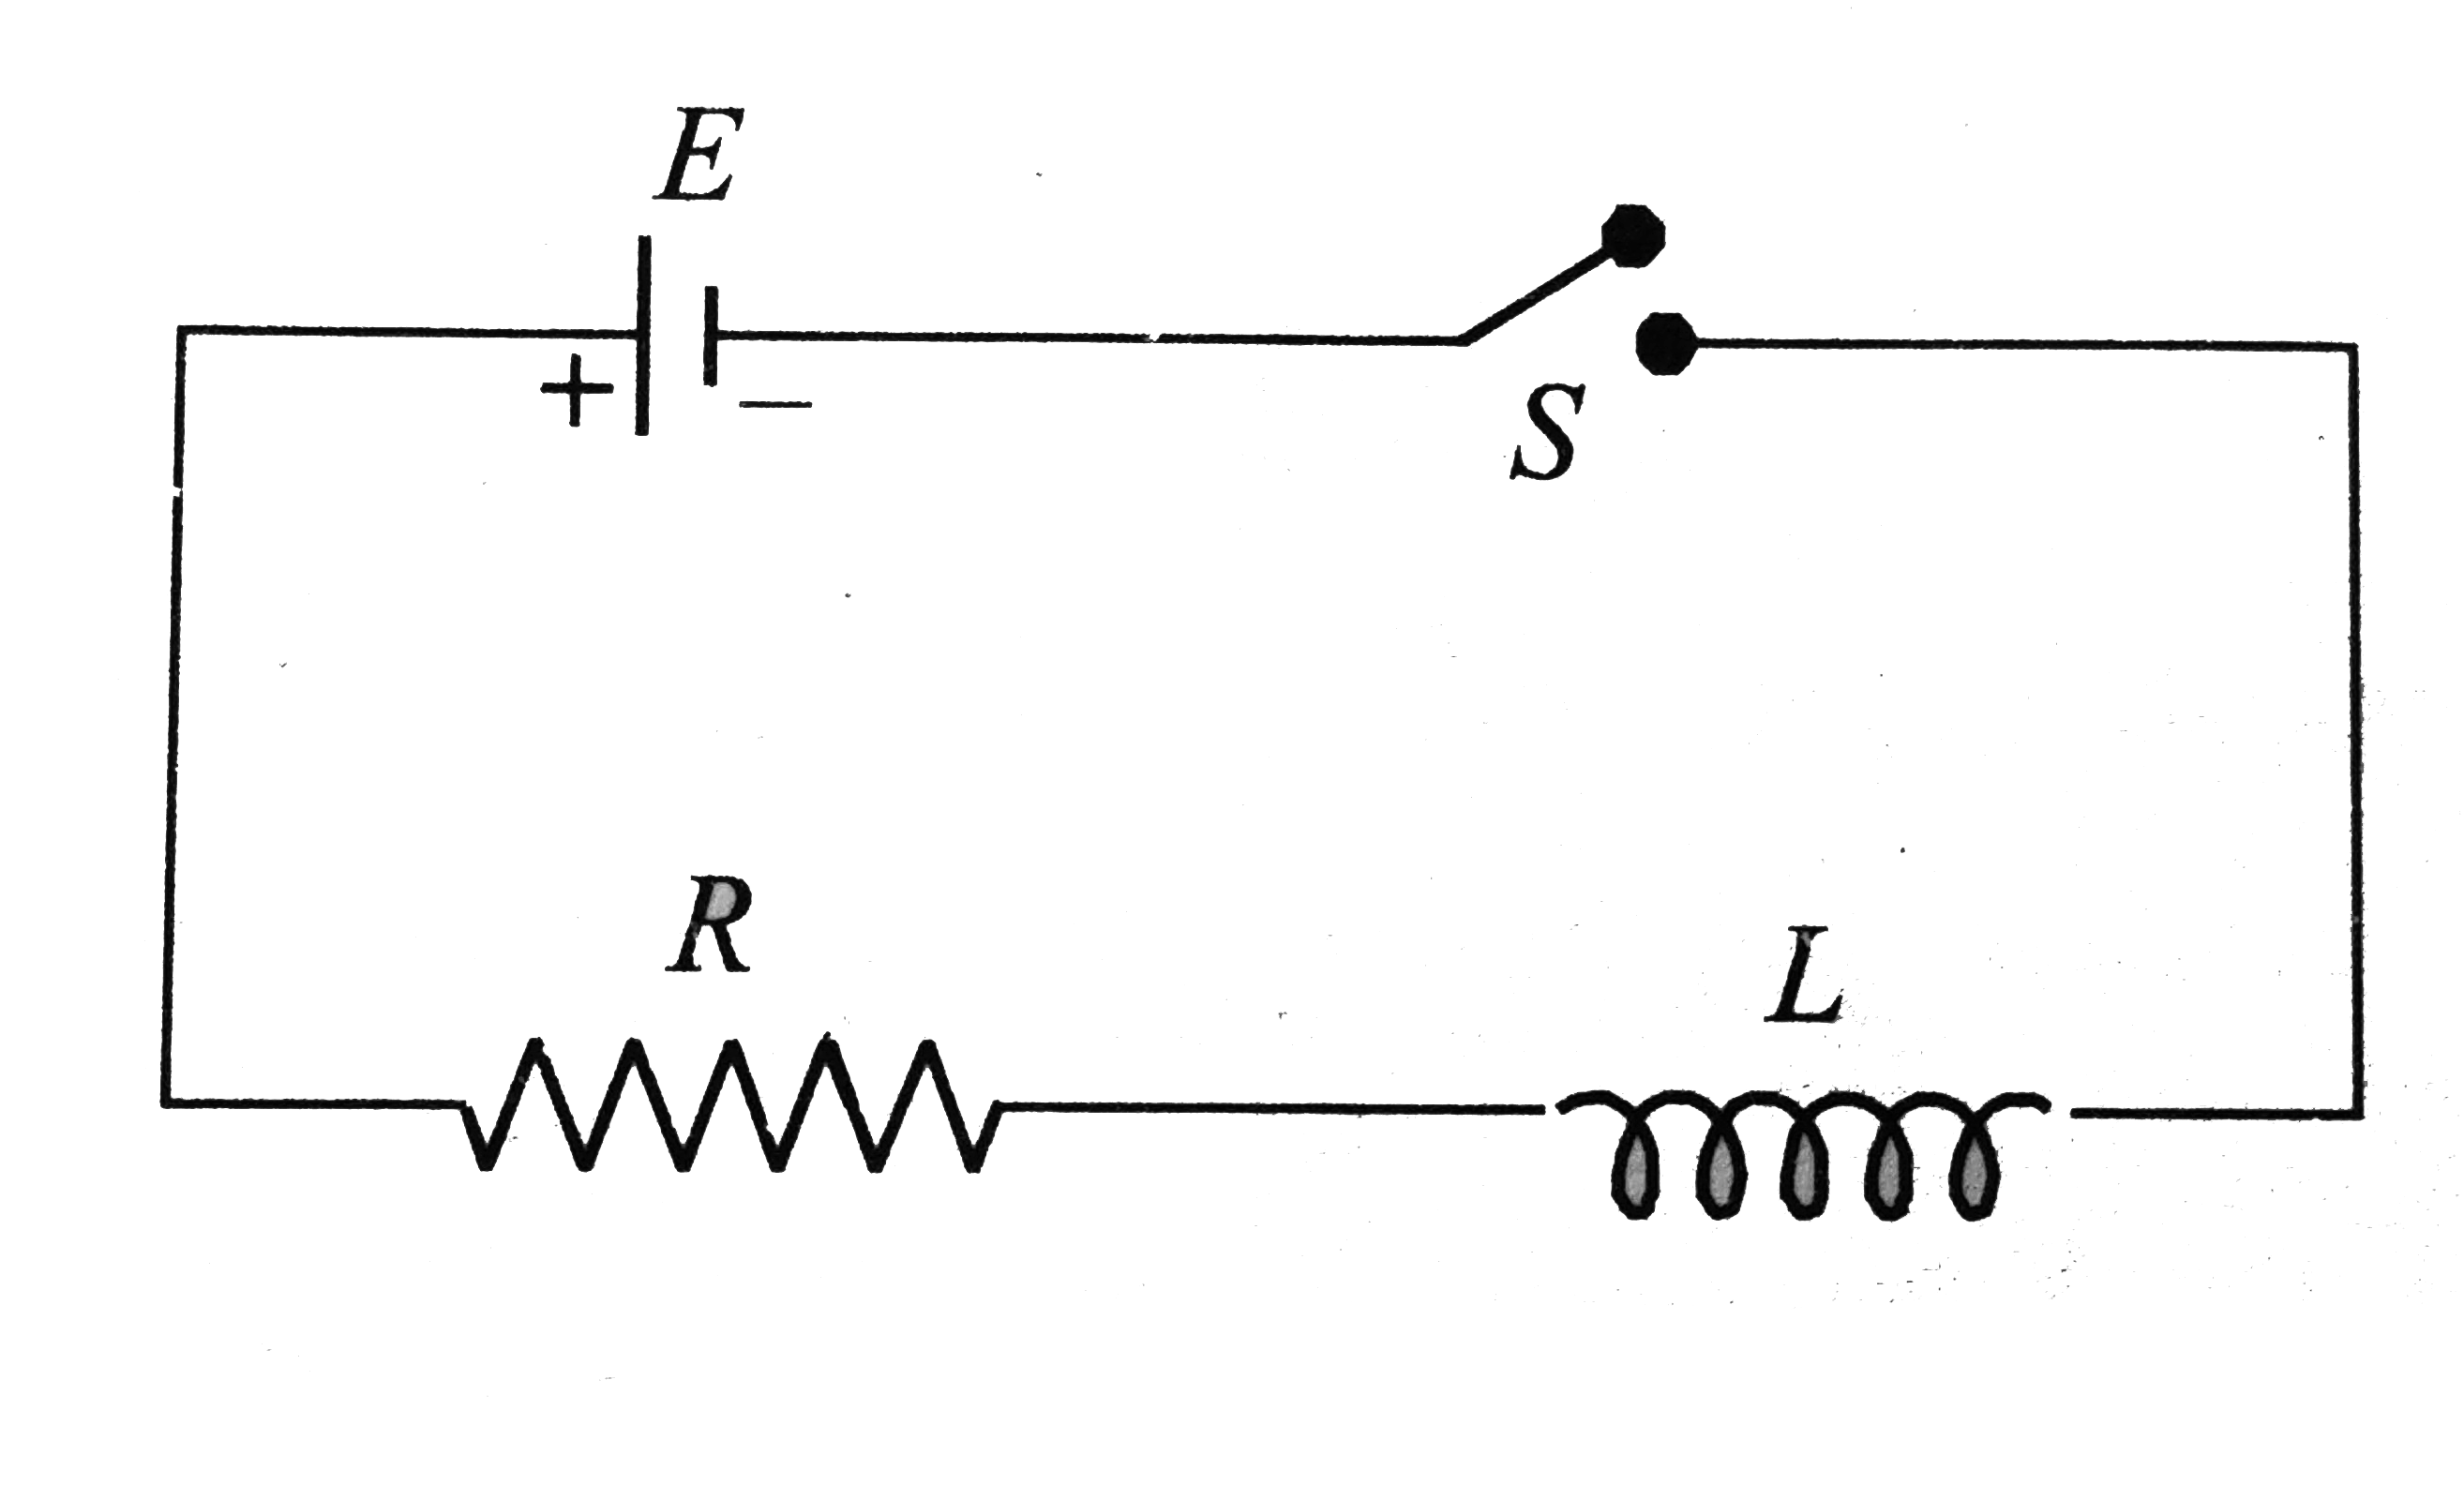
Switch S of the circuit shows in Fig. is closed at t=0. If e denotes the induced emf in L and i the current flowing through the circuit at time t, then which of the following graphs correctly represents the variation of e with i?
 View Solution
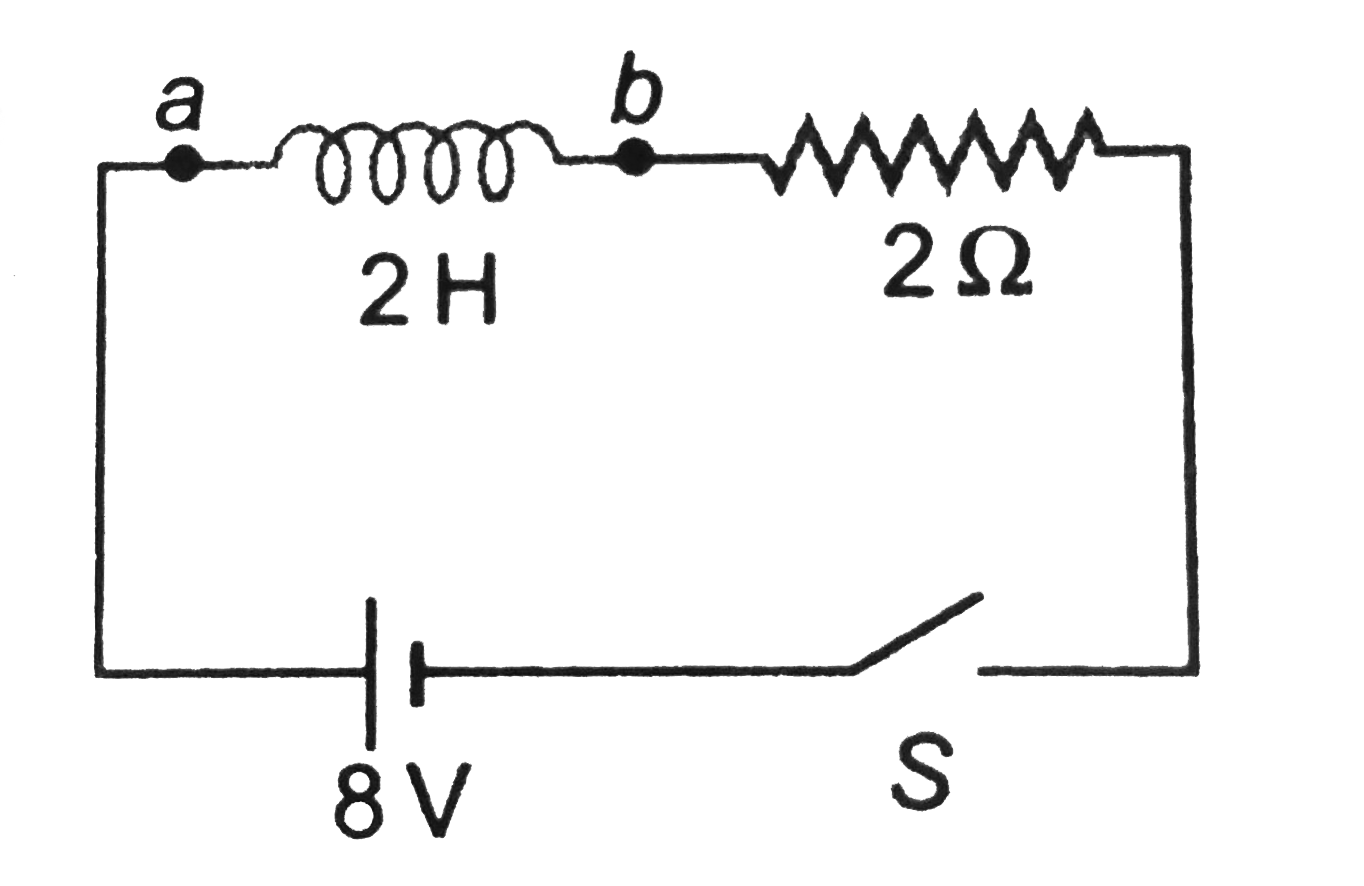
In the circuit shown in figure, circuit is closed at time t=0. At time t=ln(2) second
 View Solution
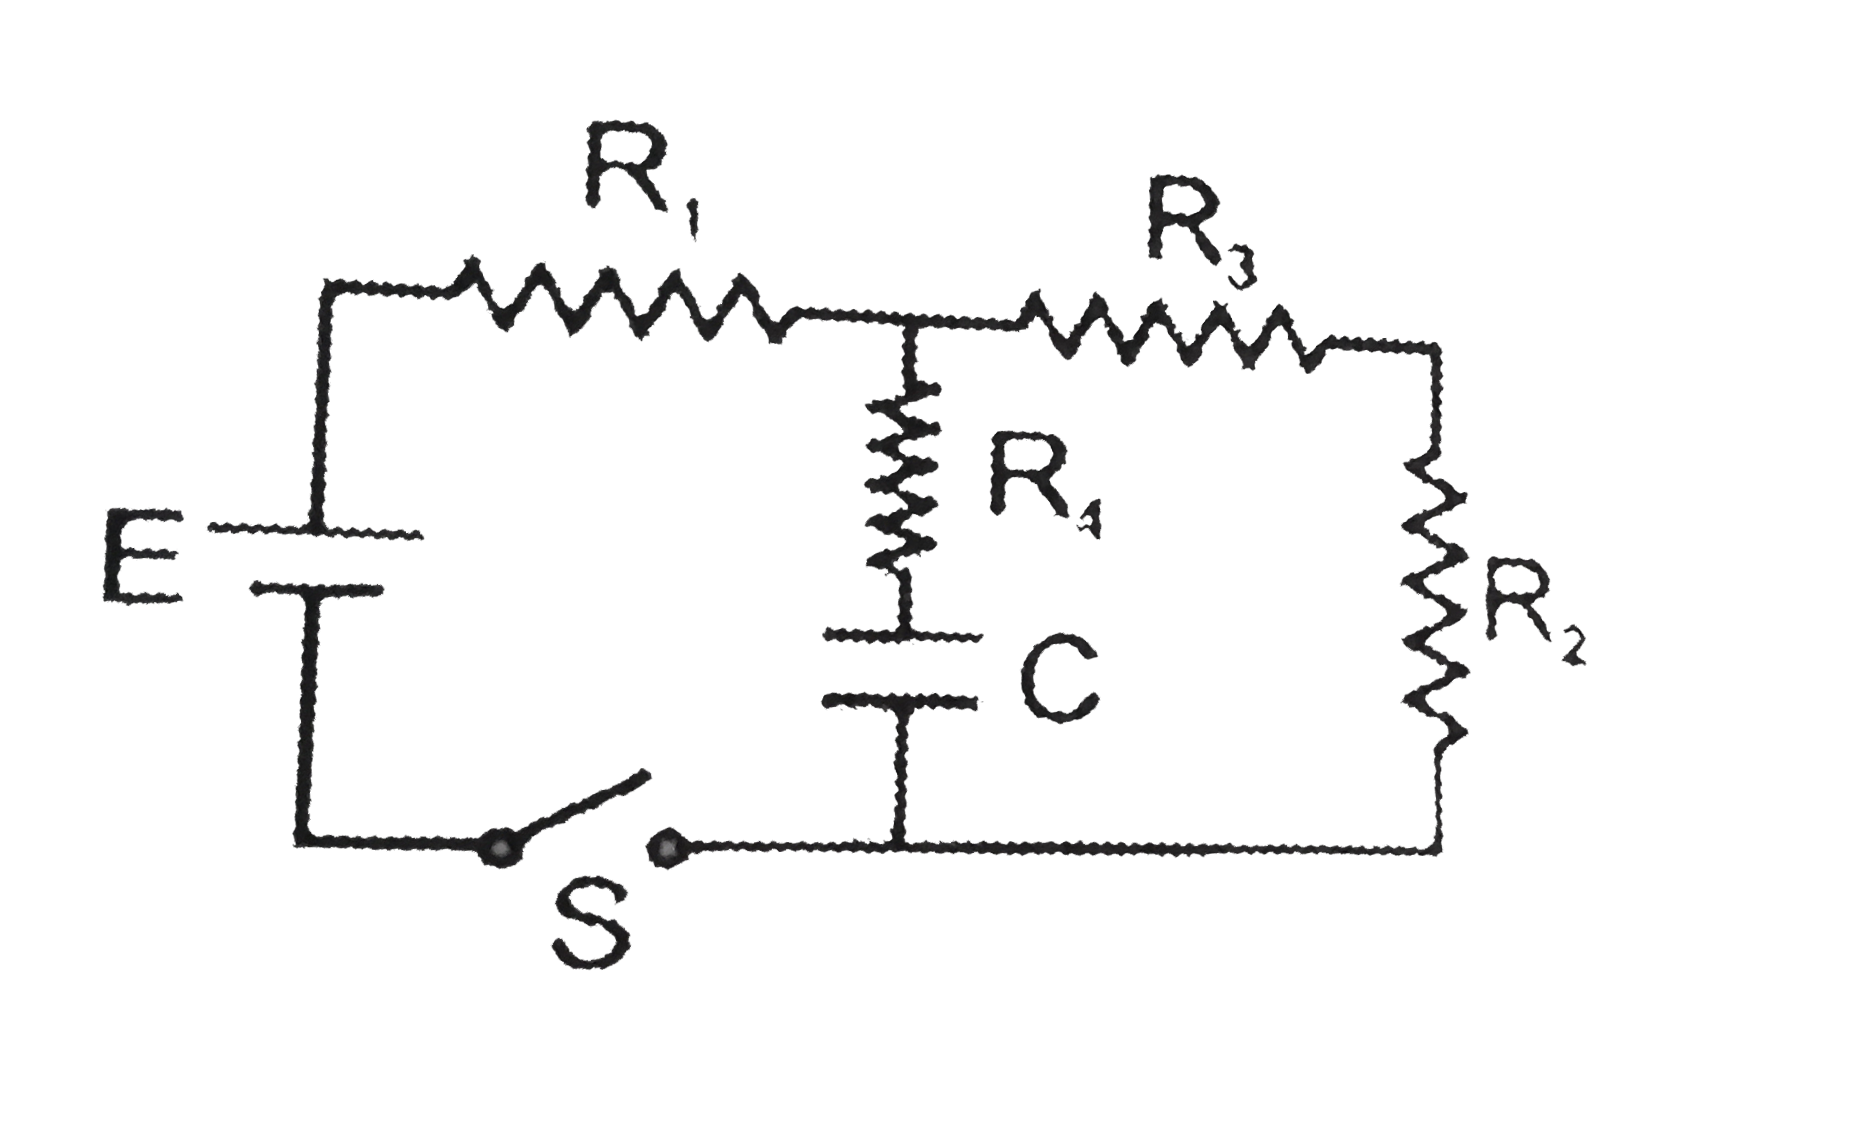
In the circuit shown in figure the switch S is closed at t = 0. A long time after closing the switch
 View Solution
In an L-R circuit connected to a battery of constant emf E, switch is closed at time t=0. If e denotes the induced emf across inductor and I the current in the circuit at any time t. Then which of the following graphs shown the variation of e with i?
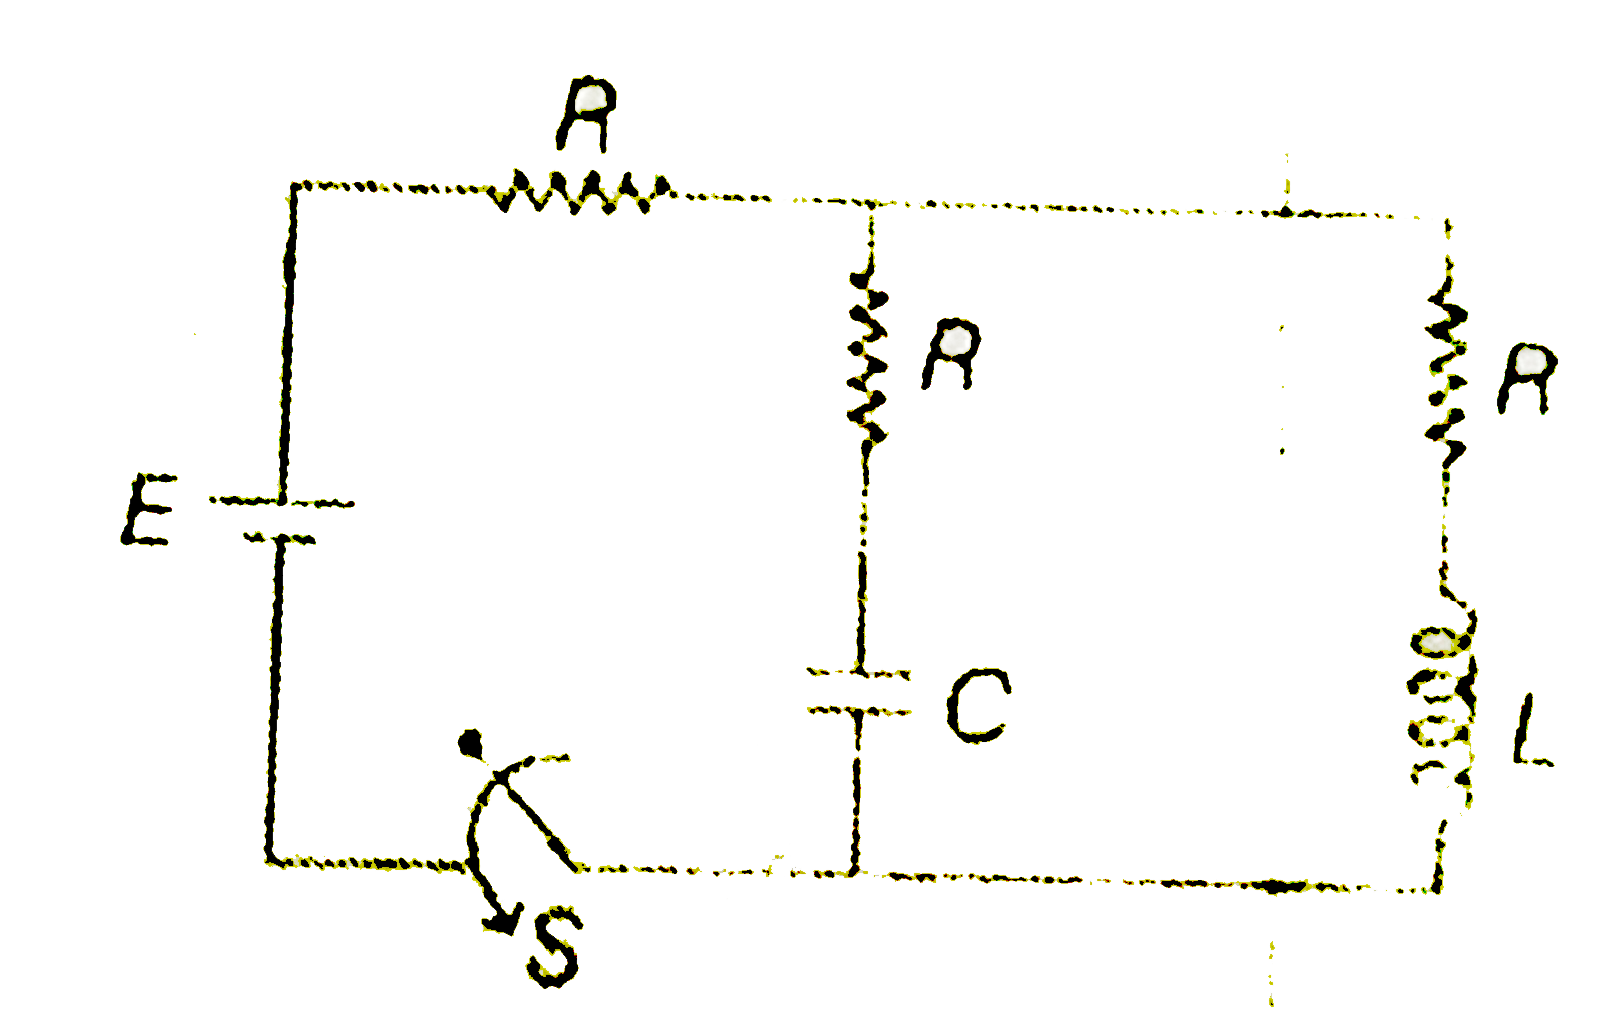
View SolutionIn the circuit as shown in the figure, switch S is added at t=0. Then:
 View Solution
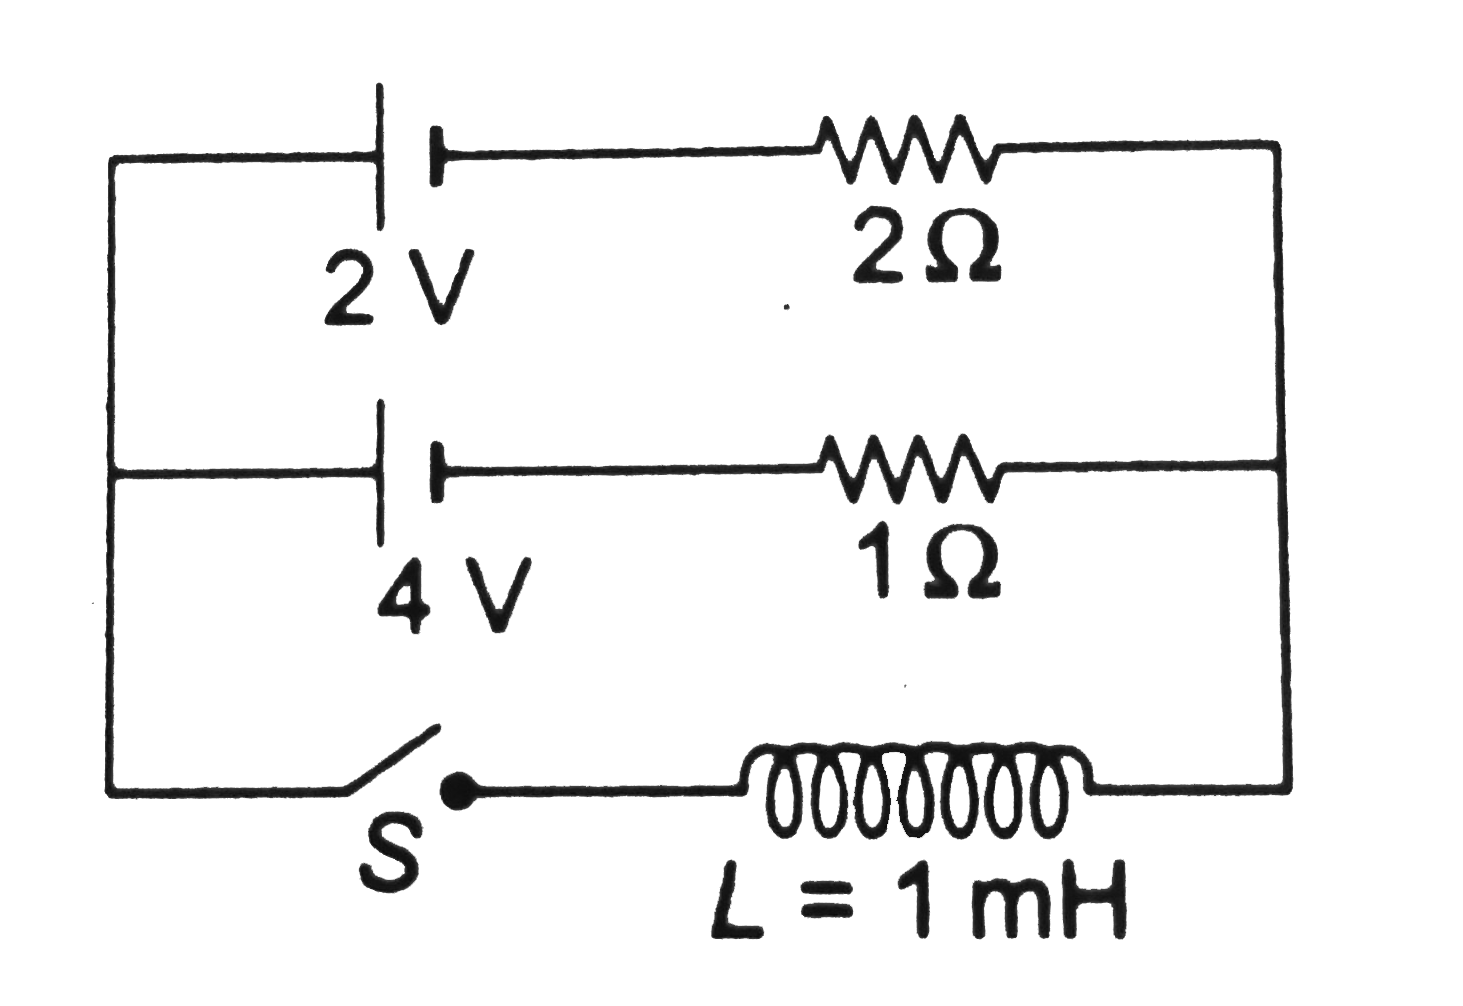
In the circuit shown, switch S is closed at time t=0. Find the current through the inductor as a function of time t.
 View Solution
In the circuit shown in figure L=10H,R=5Ω,E=15V. The switch S is closed at t=0. At t=2s the current in the circuit is
 View Solution
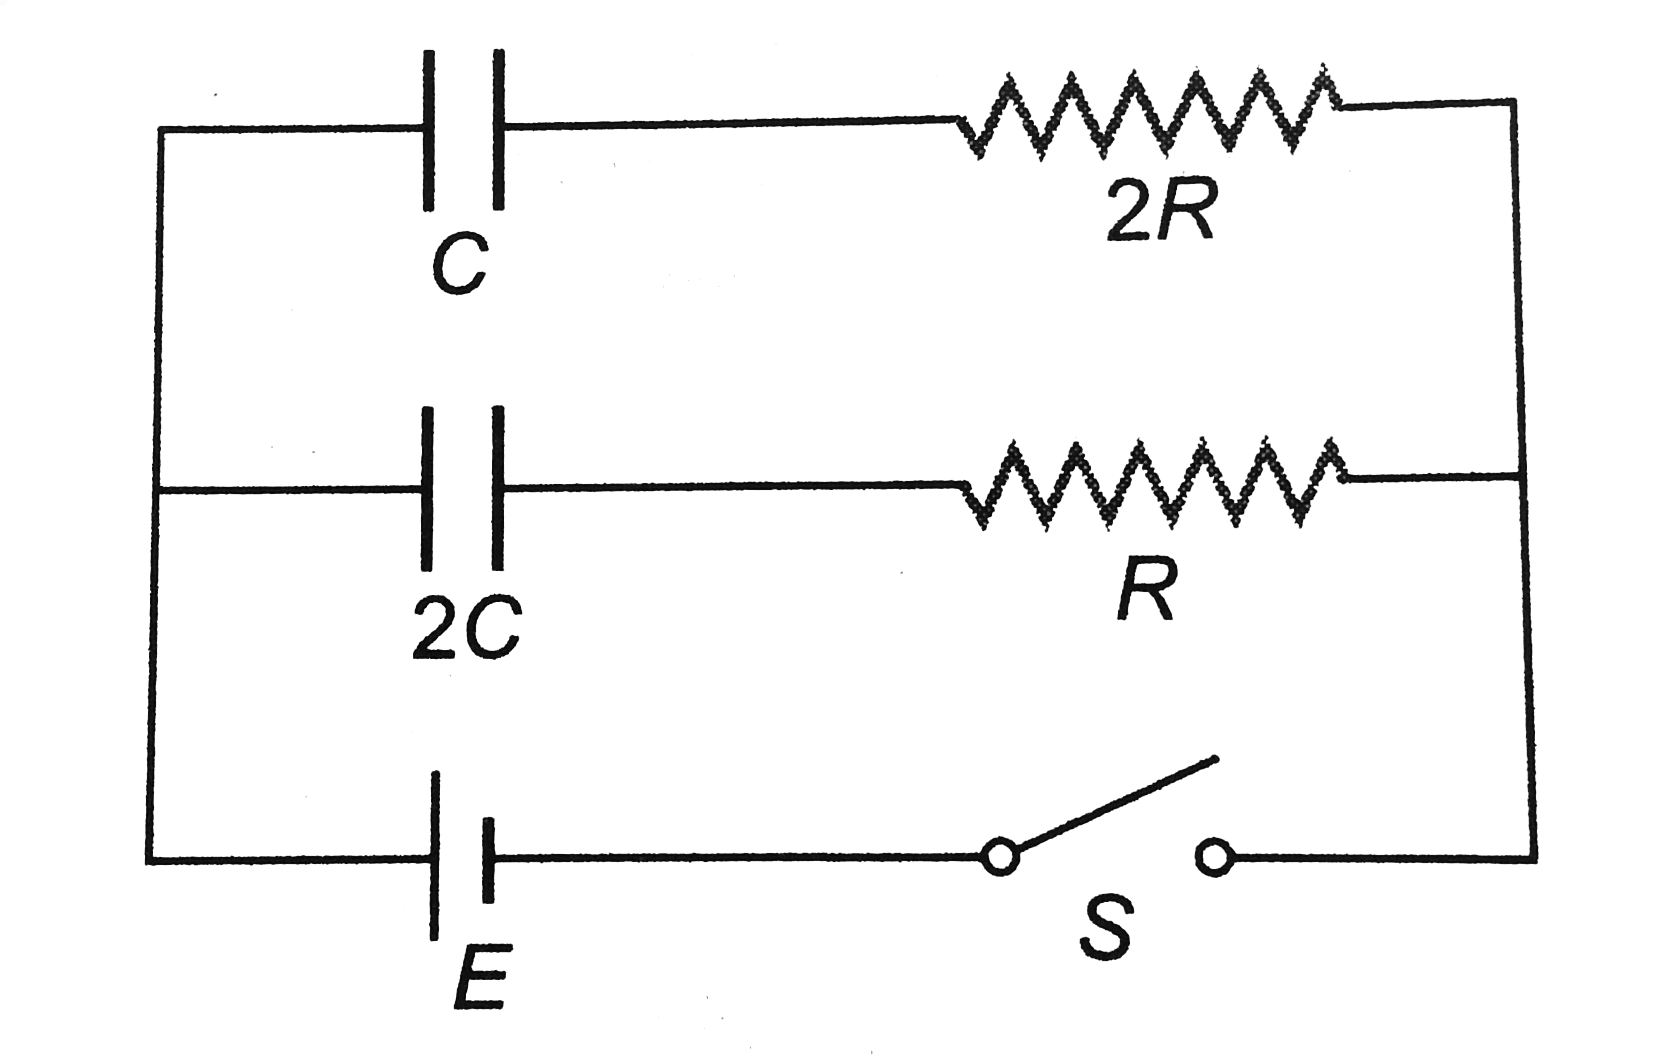
In the circuit shown in the figure, switch S is closed at time t=0. Select the correct statements.
 View Solution
In the circuit shown in the figure, switch S is closed at time t=0. Select the correct statements.
 View Solution

