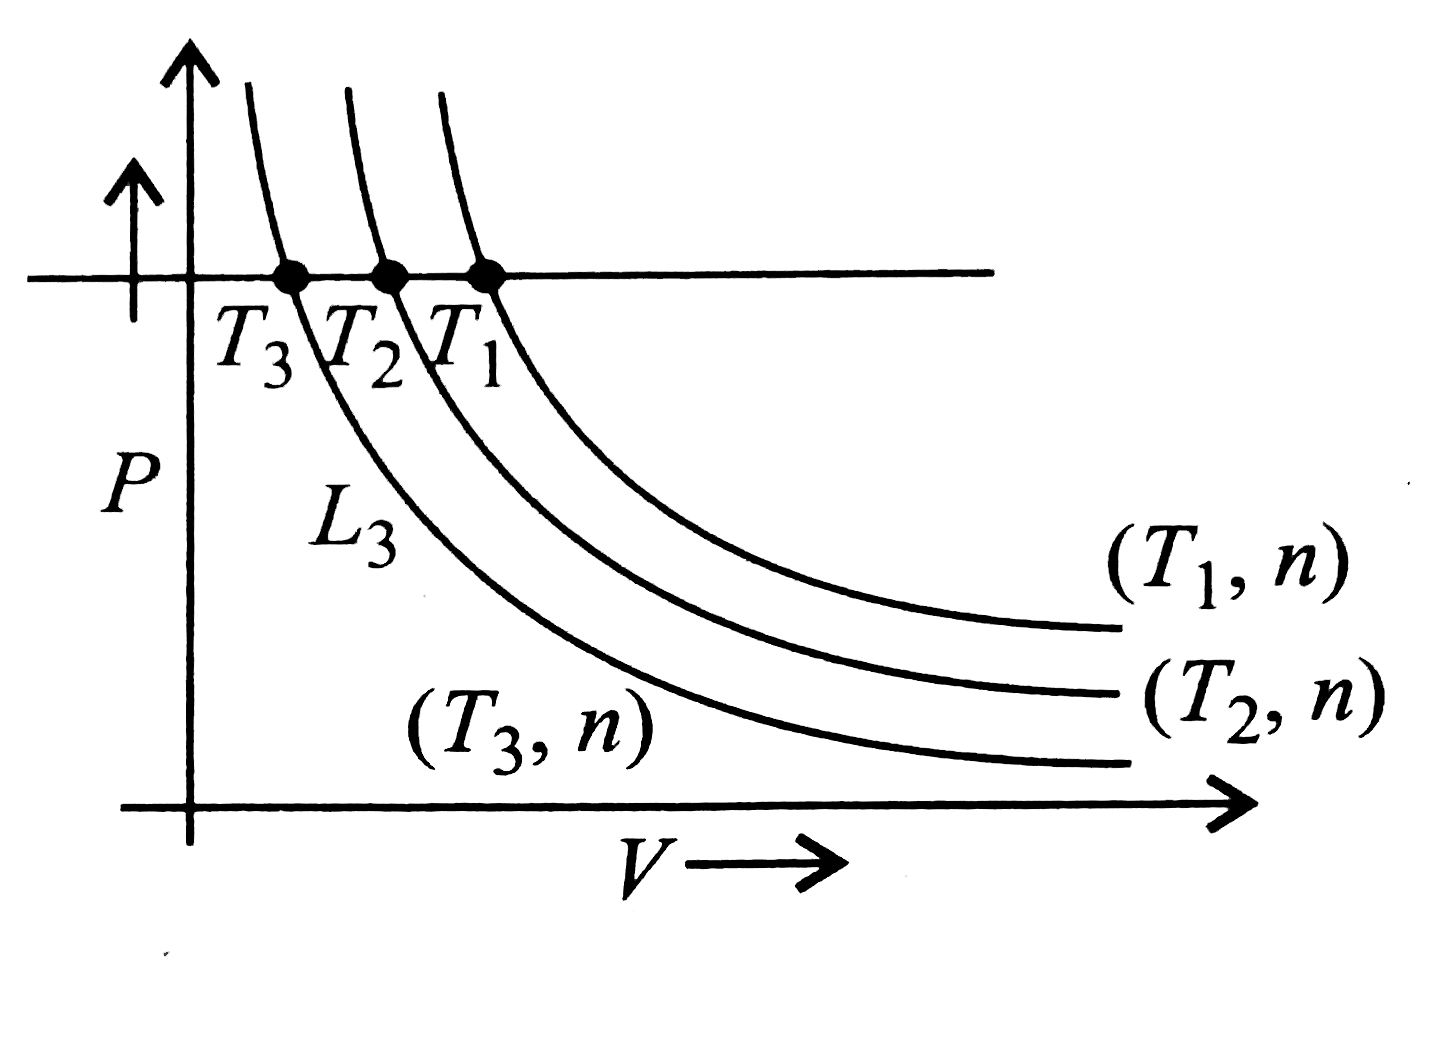
Boyle's Law for an ideal gas can be plotted as shown (: moles, : temperature)
Note: and are kept constant along line , , and ,
It follows from the above graph:

None of these
Topper's Solved these Questions
- STATES OF MATTERBOOK - CENGAGE CHEMISTRY ENGLISHCHAPTER - STATES OF MATTEREXERCISE - Illustration
2 Videos
- STATES OF MATTERBOOK - CENGAGE CHEMISTRY ENGLISHCHAPTER - STATES OF MATTEREXERCISE - Exercises
21 Videos
- SOME BASIC CONCEPTS AND MOLE CONCEPTBOOK - CENGAGE CHEMISTRY ENGLISHCHAPTER - SOME BASIC CONCEPTS AND MOLE CONCEPTEXERCISE - Archives Subjective
11 Videos
- STOICHIOMETRYBOOK - CENGAGE CHEMISTRY ENGLISHCHAPTER - STOICHIOMETRYEXERCISE - Archives Subjective
33 Videos
Similar Questions
For a fixed mass of gas and constant pressure, which of the following graphs is / are correct?

View Solution100mL of gas is collected at 750mm pressure. What volume will it occupy at 745mm pressure?
View SolutionWhat is the molarity and molality of a 13% solution (by weight) of sulphric acid with a density of 1.02mL−1?
View SolutionIn the analysis of 0.1 of sample of feldspar, 0.118 g of mixture of NaCl and KCl is obtained which on treatment with AgNO3 gives 0.2451 of AgCl. Calculate the precentage of Na2O and K2O in feldspar.
View SolutionBoyle's Law for an ideal gas can be plotted as shown (rarr) ( n : moles, T : temperature) Note: T and n are kept constant along line L_(1) , L_(2) , and L_(3) , It follows from the above graph:
View SolutionIn a Kater's pendulum the time periods about the knife edges at distance l_(1) and l_(2) from the centre of gravity are t and t+pi is very small. Show that (4 pi^(2)(l_(1)+l_(2)))/(g)=t(t+(2l_(2)tau)/(l_(2)-l_(1)))
View SolutionLet n≥4 be a positive integer and let l1,l2,.....,ln be the lengths of the sides of arbitrary n-sided non-degenerate polygon P. Suppose l1l2+l2l3+....ln−1ln+lnl1=n. Consider the following statements: I. The lengths of the sides of P are equal. II. The angles of P are equal. III. P is a regular polygon if it is cyclic. Then
View SolutionYou are given three lenses L_(1),L_(2) and L_(3) each of focal length 10 cm. An object is kept at 15 cm in front of L_(1), as shown. The final real image is formed at the focus 'T' of L_(3). Find the separations between L_(1),L_(2) and L_(3).
View SolutionABC is a right-angled triangle in which ∠B=90∘andBC=a. If n points L1,L2,…,Ln on AB is divided in n+1 equal parts and L1M1,L2M2,…,LnMn are line segments paralllel to BC and M1,M2,….,Mn are on AC, then the sum of the lengths of L1M1,L2M2,...,LnMn is
View SolutionIf ln=∫π40tannxdx show that 1l2+l4,1l3+l5,1l4+l6,1l5+l7,.... from an AP. Find its common difference.
View SolutionABC is a right angled triangle in which ∠B=90∘ and BC=a. If n points L1,L2,…….,Ln on AB are such that AB is divided in n+1 equal parts and L1M1,L2M2,......,LnMn are line segments parallel to BC and M1,M2,M3,......,Mn are on AC, the sum of the lenghts of L1M1,L2M2,......,LnMn is
View SolutionIf the integral ln=∫π/40tannxdx is reduced to its lower integrals like ln−1,ln−2 etc.,
Then l2+l4,l3+l5andl4+l6 are in
View SolutionL1 is a line passing through the point A(n,n+1) having slope, n,L2 is a line passing through the point B(−n,n2) and is perpendicular to L1, If L1 and L2 intersect on y-axis, then n is equal to ________ (n>0)
View SolutionYou are given three lenses L_(1),L_(2) and L_(3) each of focal length 10 cm. An object is kept at 15 cm in front of L_(1), as shown. The final real image is formed at the focus 'T' of L_(3). Find the separations between L_(1),L_(2) and L_(3).
View SolutionABC is a right-angled triangle in which ∠B=90∘andBC=a. If n points L1,L2,…,Ln on AB is divided in n+1 equal parts and L1M1,L2M2,…,LnMn are line segments paralllel to BC and M1,M2,….,Mn are on AC, then the sum of the lengths of L1M1,L2M2,...,LnMn is
View Solution
