The number of boys and girls, in Std. 5 to Std. 8 in a Z. P. school given in the table. Draw a subdivided bar graph to show the data. (Scale : On axis, 1 cm = 10 students)

Topper's Solved these Questions
Similar Questions
Direction: Read the following table carefully and answer the questions given below: The given table shows the number of boys and girls in 5 different school:
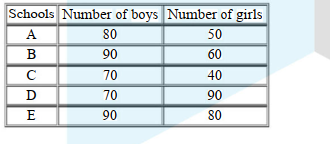
Find the total number of girls in school C and E together is how much percent more or less than the total number of students in school D
View SolutionGiven below is the data of school going students (boys and girls):

Draw the bar graph to represent the above data.
View Solution
Knowledge Check
The ratio of number of boys and girls in a school of 720 students is 7:5. How many more girls should be admitted to make the ratio 1:1?
A90B120C220D240The given bar graph represents the number of boys and girls in five different schools. Read the graph and answer the question that follows.
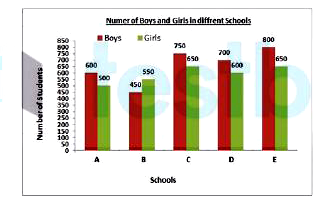
What is the average number of students (girls and boys) in schools A, B, C, D and E ?A596B1250C625D660
Given below is the data of school going students (boys and girls):

Draw the bar graph to represent the above data.
View SolutionDirection: Read the following table carefully and answer the questions given below: The given table shows the number of boys and girls in 5 different school:
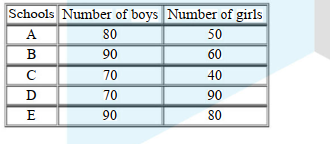
Find the ratio between the total number of students in school D and the total number of student in school A.
View SolutionDirection: Read the following table carefully and answer the questions given below: The given table shows the number of boys and girls in 5 different school:
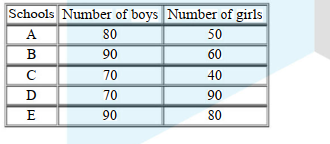
Find the ratio between the average number of girls in school B and D together and the average number of boys in school B and C together.
View SolutionDirection: Read the following table carefully and answer the questions given below: The given table shows the number of boys and girls in 5 different school:
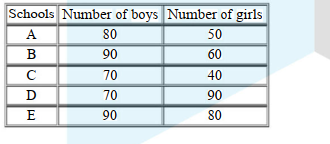
The total number of girls in school E is what percent of the total number of students in school D?
View SolutionA survey of 120 school students was done to find which activity they prefer to do in their free time.
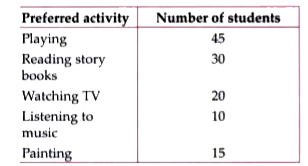
Draw a bar graph to illustrate the above data taking scale of 1 unit length = 5 students.
View SolutionThe following table gives the data of number of schools (stage-wise) of a country in the year 2002.
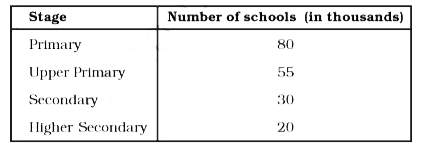
Draw a bar graph to represent the above data:
View Solution


