Observe the following graph and answer the question :

How much more is the total savings of Savita than the total savings of Megha?
The total saving by Savita is ₹ 1000 and that by Megha is ₹ 500. ₹ (1000-500) = ₹ 500. The total saving by Savita is ₹ 500 more than that of Megha.
Topper's Solved these Questions
Similar Questions
Knowledge Check
The bar graph given below shows the spending of a family income on various items and savings during 1993. Observe the graph and answer the following questions :
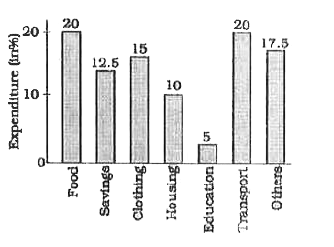
If the total income of the family during 1993 was Rs. 100000, the savings of the family in 1993 was :ARs. 1,750BRs. 20,000CRs. 12,500DRs. 50,000The bar graph given below shows the spending of a family income on various items and savings during 1993. Observe the graph and answer the following questions :
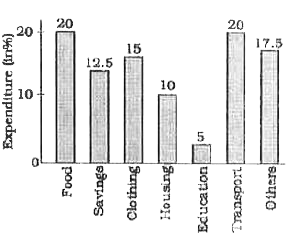
The percent of income spent on clothing exceeds that on savings by :A12.5%B20%C10%D22.5%Study the following graph carefully and answer the questions that
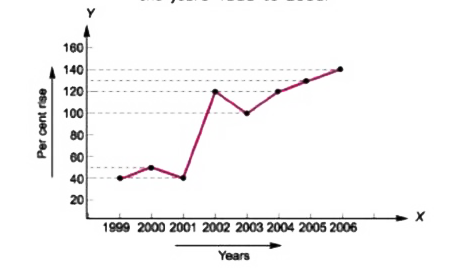
For how many years , the percent rise was more than 100 % ?AOneBTwoCThreeDNone of these
Study the following bar graph and answer the question that follows.
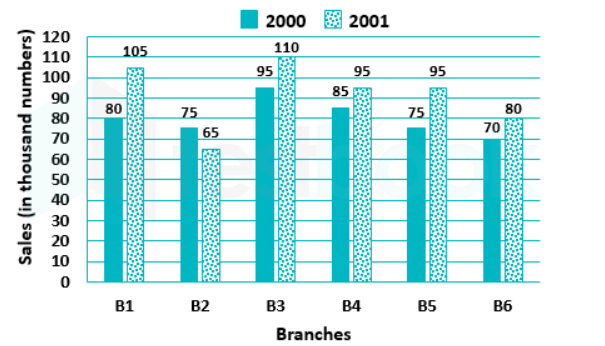
The total sales of books for branches Bl to B5 for the year 2000 is how much more than that of the average sales of books for branches Bl to B5 for the year 2001?
View SolutionStudy the following graph and answer the question given below :
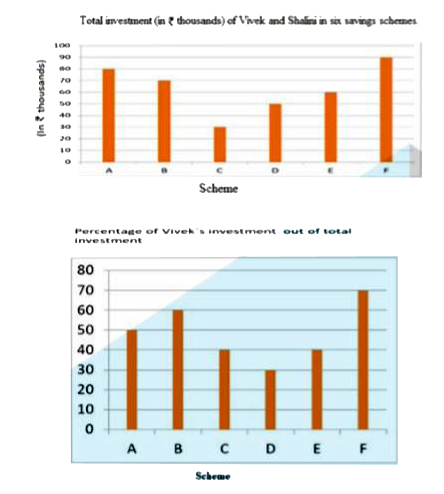
What is the average amount invested by Vivek in savings schemes A, B, C and D ?
View SolutionStudy the following graph and answer the question that follows.
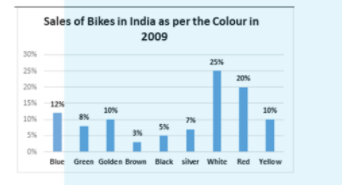
If the total number of bikes sold in 2009 was 10000 how many more yellow bikes were sold than green ones?
View SolutionThe bar graph given below represents the circulation of newspapers in different languages in a town. Study the bar graph and answer the following questions:
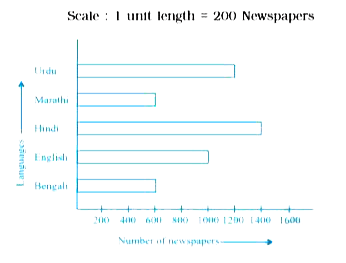
By how much is the circulation of newspaper in Hindi more than the newspaper in Bengali?
View SolutionStudy the following graph carefully and answer the given questions :-
The following graph shows the % profit of two companies over the years :-
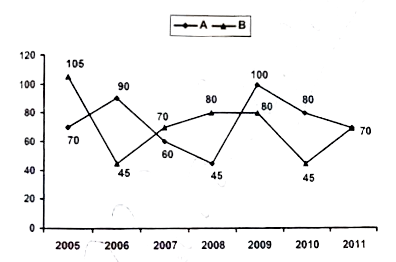
In which of the following years was the total income more than double the total expenditure in that year for company A ?
View Solution

