Figure shows a graph between the magnitude of magnetic field passing normally through a closed loop and time t. Rank the five region's of the graph according to the emf in magnitude indụced in the loop, greatest first.
AB gt CD = DE gt BC = OA
Topper's Solved these Questions
- BOOK - AAKASH INSTITUTE ENGLISHCHAPTER - ELECTROMAGNETIC INDUCTIONEXERCISE - Assignment (SECTION - A)55videos
ELECTROMAGNETIC INDUCTION
- BOOK - AAKASH INSTITUTE ENGLISHCHAPTER - ELECTROMAGNETIC INDUCTIONEXERCISE - Assignment (SECTION - B)22videos
ELECTROMAGNETIC INDUCTION
- BOOK - AAKASH INSTITUTE ENGLISHCHAPTER - ELECTROMAGNETIC INDUCTIONEXERCISE - ASSIGNMENT(SECTION -D) Assertion-Reason type Question)15videos
ELECTROMAGNETIC INDUCTION
- BOOK - AAKASH INSTITUTE ENGLISHCHAPTER - ELECTRIC CHARGES AND FIELDS EXERCISE - comprehension3videos
ELECTRIC CHARGES AND FIELDS
- BOOK - AAKASH INSTITUTE ENGLISHCHAPTER - ELECTROMAGNETIC WAVESEXERCISE - ASSIGNMENT SECTION - D Assertion-Reason Type Questions25videos
ELECTROMAGNETIC WAVES
Similar Questions
The graph gives the magnitude B(t) of a uniform magnetic field that exists throughout a conductig loop, perpendicular to the plane of the loop. Rank the five regions of the graph according to the magnitude fo the emf induced in the loop, greater first
 View Solution
The graph shows the variation of magnetic field B that exists through a conducing loop, perpendicular to the plane of the loop. The emf's induced in the loop during equal intervals a, b, c, d and e are related as
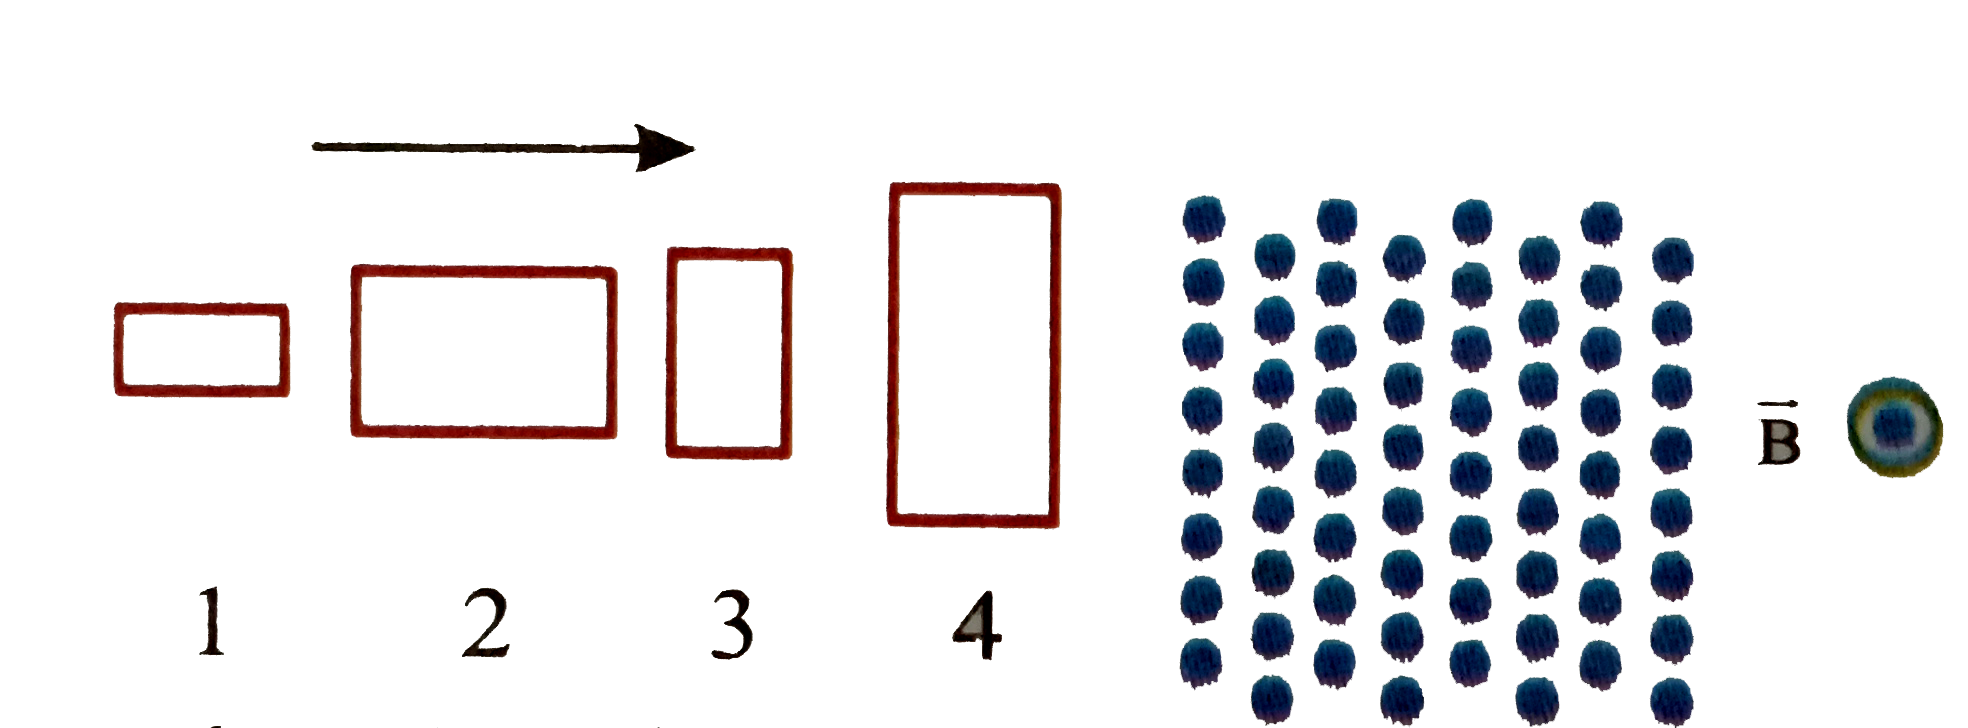
View SolutionThe figure shows four wire loops, with edge length of either L or 2L. All four loops will move through a region of uniform magnetic field →B (directed out of the page) at the same constant velocity . Rank the four loops according to the maximum magnitude of the e.m.f. induced as they move through the field, greatest first
 View Solution
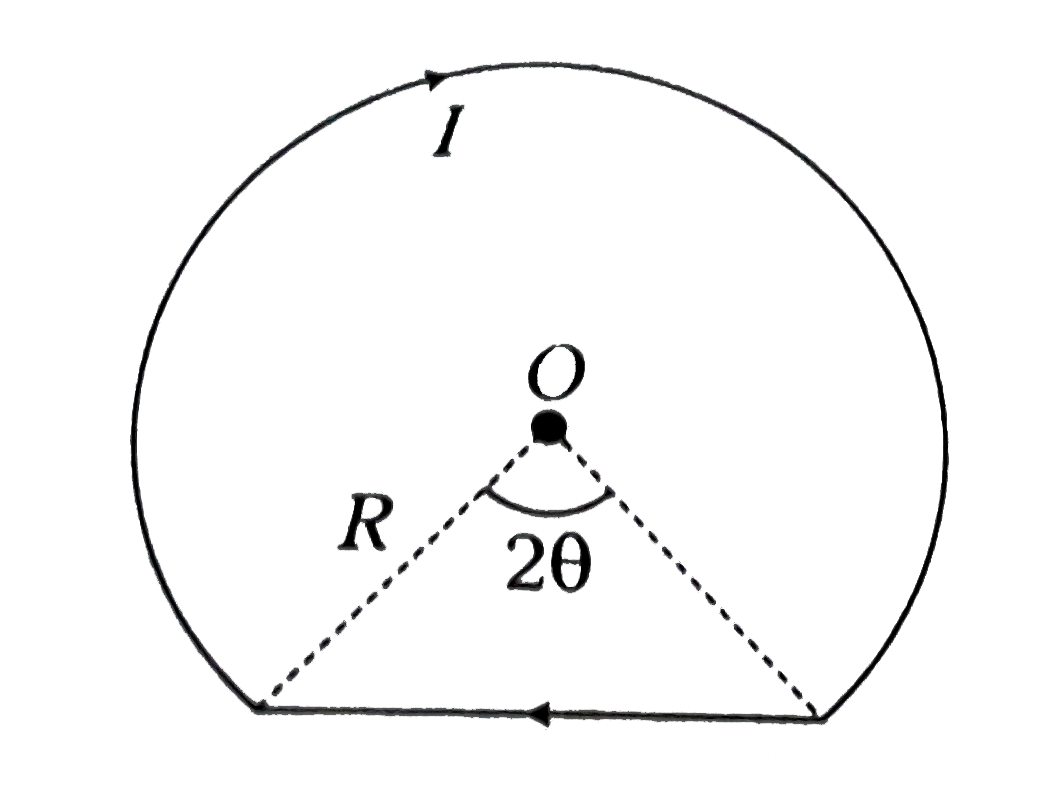
A current l flows through a closed loop as shown in figure .The magnetic field at the centre O is
 View Solution
Following figures show four situations in which positive and negative charges move horizontaly through a region and give the rate at which each charge moves. Rank the situations according to the effective current through the region greatest first.
 View Solution
Figure shows a conducting loop placed in a magnetic field. The flux through the loop changes due to change in magnetic field according to the equation ϕ=5t−10t2. What is the direction and magnitude of induced current at t=0.25s?
 View Solution
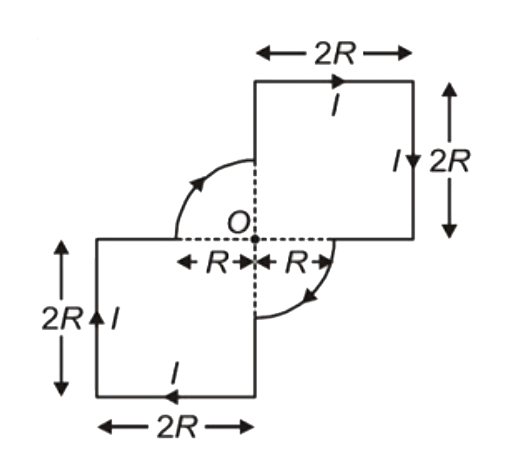
A current - carrying loop is shown in the figure. The magnitude of the magnetic field produced at a point O is
 View Solution
The four wire loops shown figure have vertical edge lengths of either L,2L or 3L. They will move with the same speed into a region of uniform magnetic field →B directed out of the page. Rank them according to the maximum magnitude of the induced emf greatest to least.
 View Solution
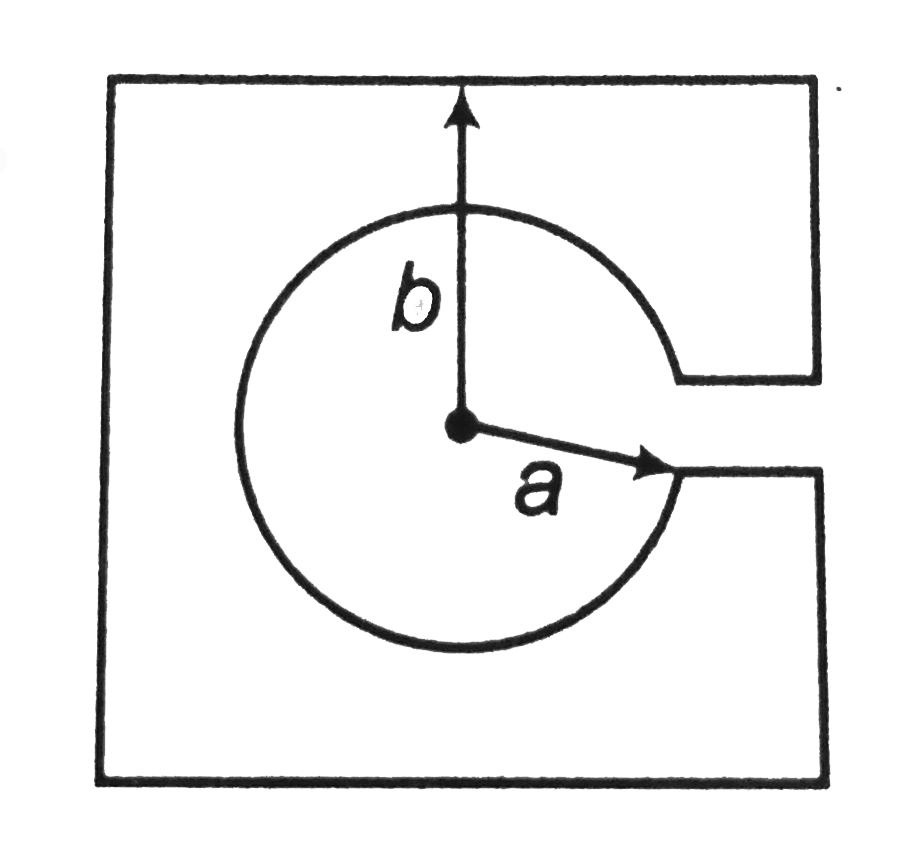
A loop shown in the figure is immersed in the varying magnetic field B=B0t, directed into the page. If the total resistance of the loop is R, then the direction and magnitude of induced current in the inner circle is
 View Solution
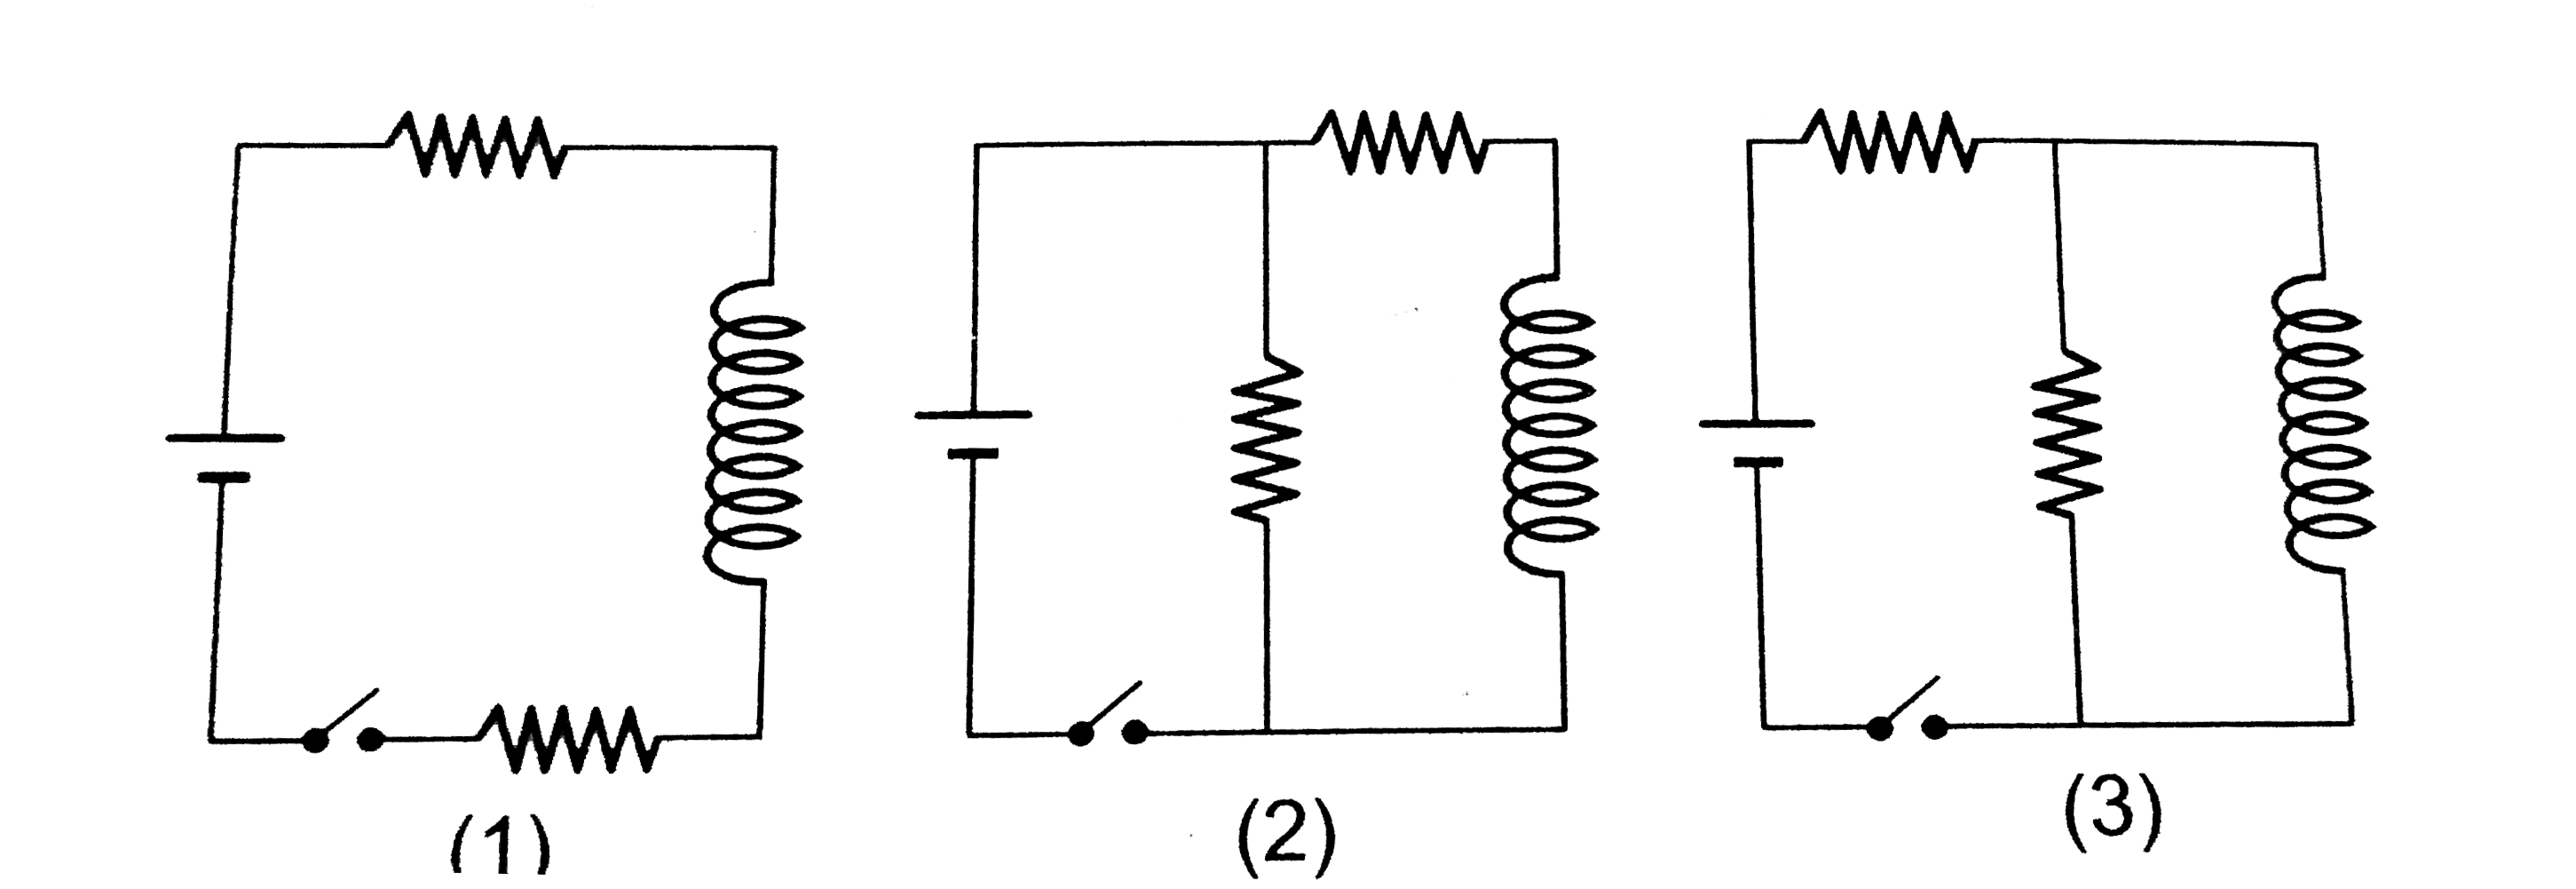
The figure shows theree cirrcuit with idential batteries, inductors, and resistors. Rank the circuit according to the current through the battery (i) just after the switch is closed and (ii) a long time later, greatest first
 View Solution
