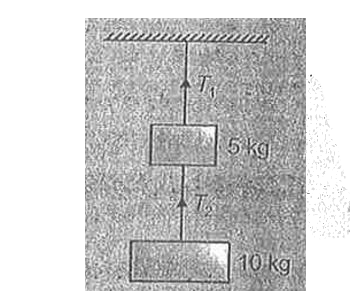
T1andT2 in the given figure are
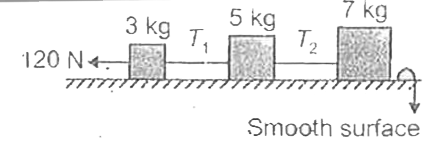
A
28 N, 48 N
B
48 N, 28 N
C
96 N, 56 N
D
56 N , 96 N
Video Solution
Text Solution
The correct Answer is:C
|
Answer
Step by step video & image solution for T_(1) and T_(2) in the given figure are by Physics experts to help you in doubts & scoring excellent marks in Class 12 exams.
Updated on:21/07/2023Topper's Solved these Questions
- LAWS OF MOTIONBOOK - AAKASH INSTITUTE ENGLISHCHAPTER - LAWS OF MOTIONEXERCISE - ASSIGNMENT ( SECTION -B) objective type questions (one option is correct)
59 Videos
- LAWS OF MOTIONBOOK - AAKASH INSTITUTE ENGLISHCHAPTER - LAWS OF MOTIONEXERCISE - ASSIGNMENT ( SECTION -C) objective type questions (More than one options are correct)
21 Videos
- LAWS OF MOTIONBOOK - AAKASH INSTITUTE ENGLISHCHAPTER - LAWS OF MOTIONEXERCISE - TRY YOURSELF
69 Videos
- KINETIC THEORYBOOK - AAKASH INSTITUTE ENGLISHCHAPTER - KINETIC THEORYEXERCISE - EXERCISE (ASSIGNMENT) SECTION - D Assertion - Reason Type Questions
10 Videos
- MAGNETISM AND MATTER BOOK - AAKASH INSTITUTE ENGLISHCHAPTER - MAGNETISM AND MATTER EXERCISE - ASSIGNMENT (SECTION D)
26 Videos
Similar Questions
Knowledge Check
The isothermal diagram of a gas at three different temperatures T1,T2andT3, is show in the given figure .Then
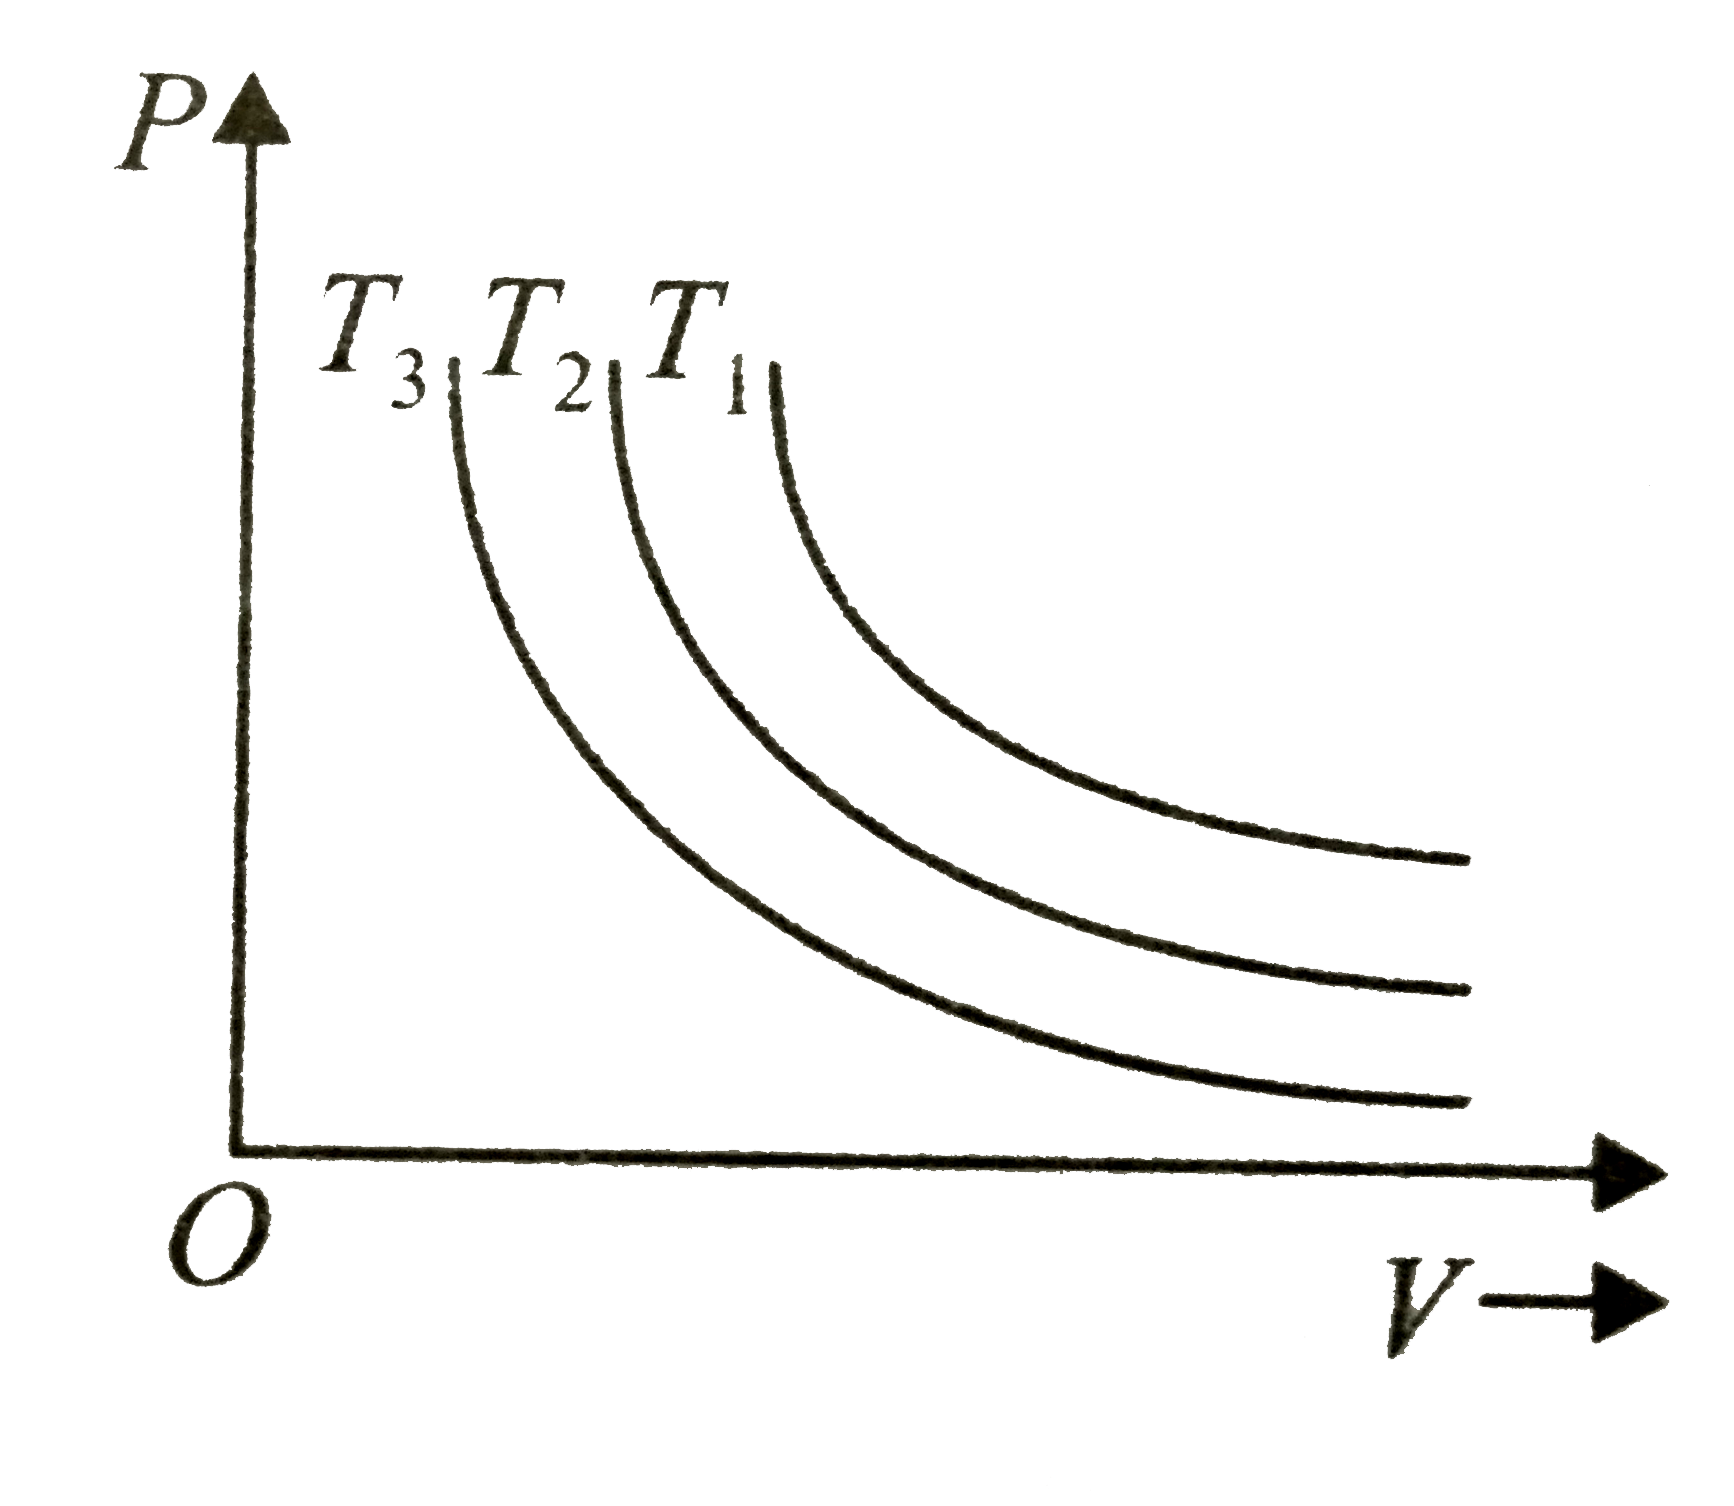 Aa.T1<T2<TBb. T1<T2>T3Cc.T1>T2>T3Dd.T1>T2<T3
The voltage V and current I v graphs for a conductor at two different temperatures T1andT2 are shown in the figure. The relation between T1andT2 is
 AT1>T2BT1<T2CT1=T2DT1=1T2
Assertion : Current versus potential difference (i-V) graph for a conductor at two different temperatures T1 and T2 is shown in figure. Hence T1>T2.
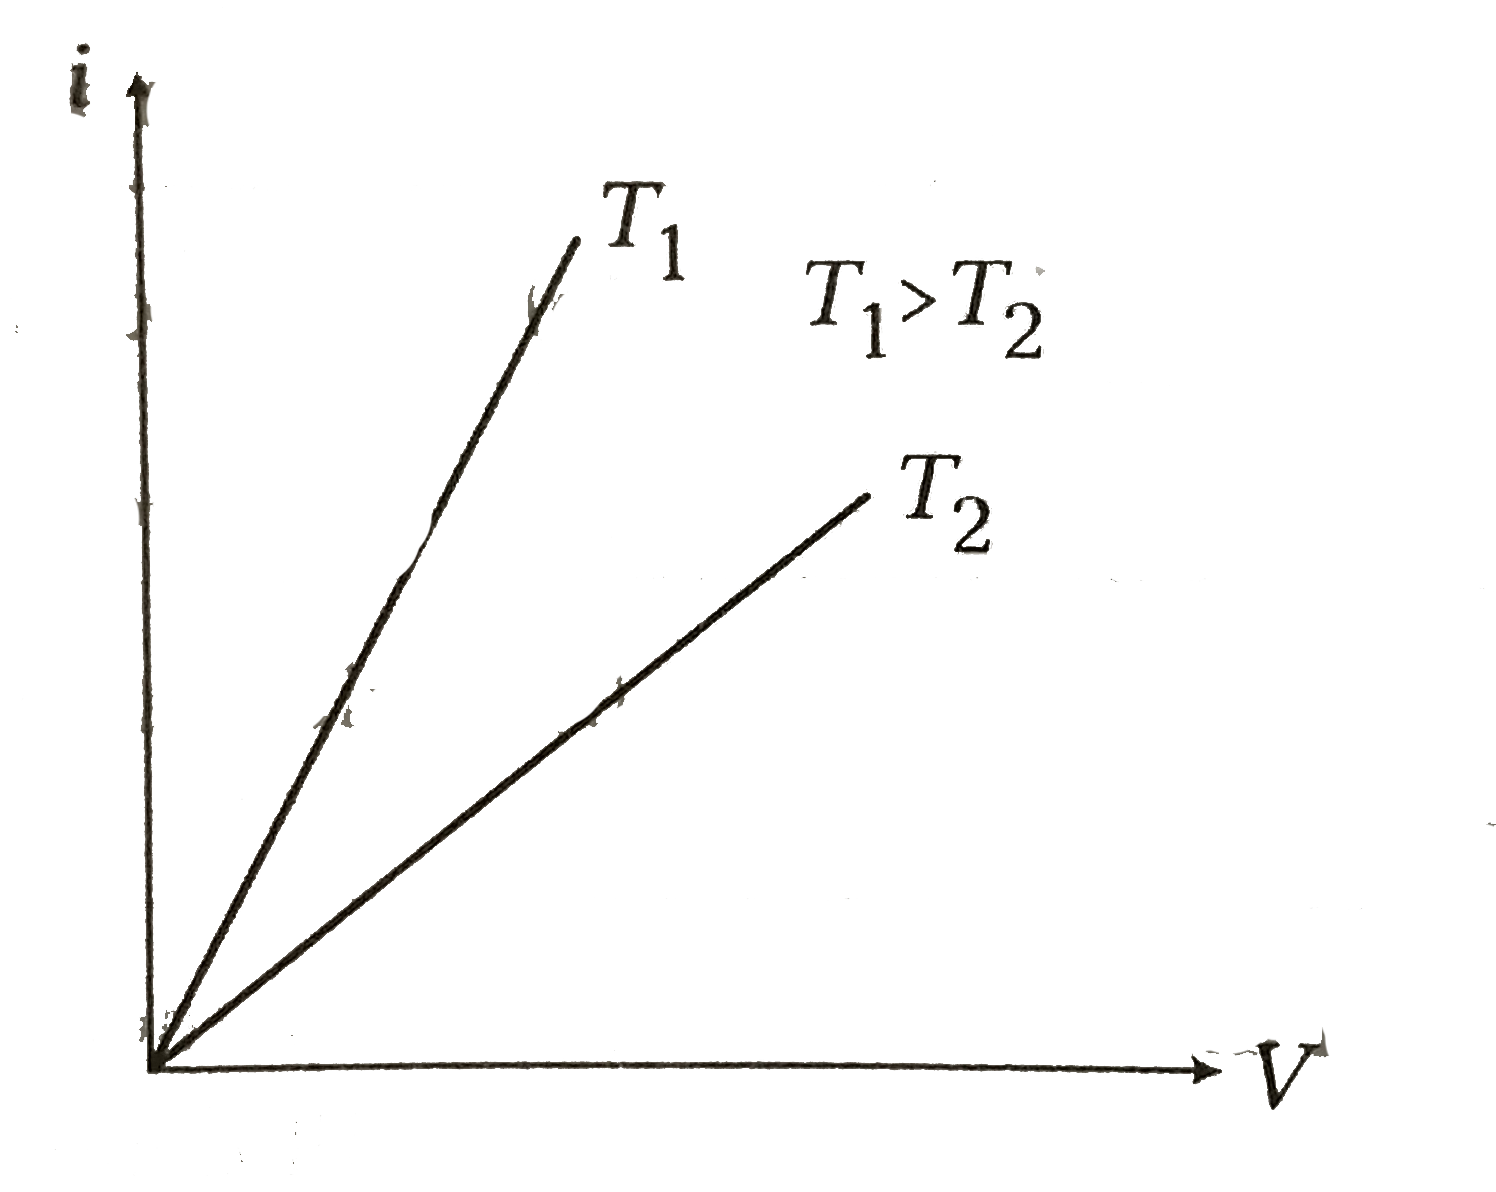
Reason : Resistance of a conductor increases with rise in temperature.
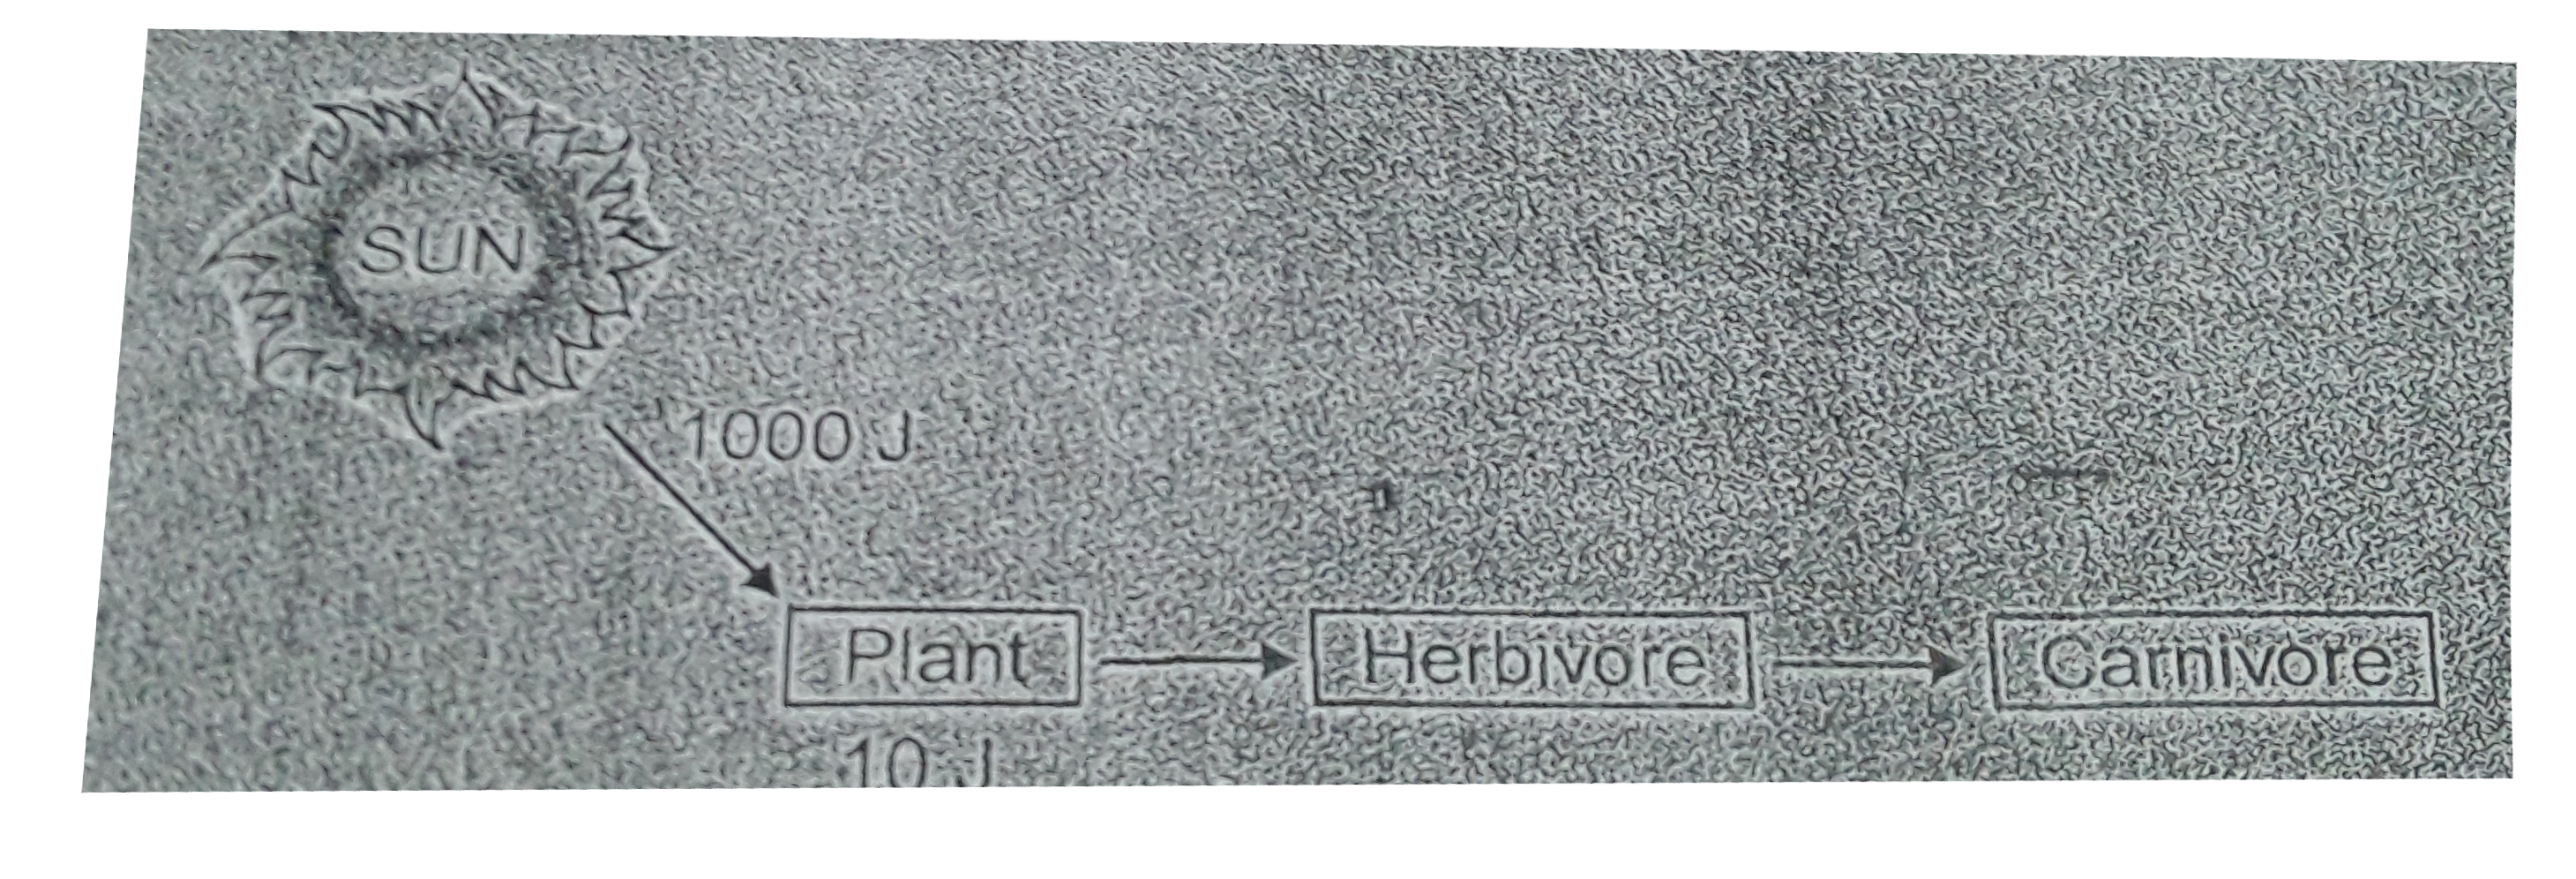
View SolutionWhat is the magnitude of energy at T2 and T3 level in the given figure ?
View SolutionHere T1andT2 are
View SolutionDetermine the tensions T1 and T2 in the string as shown in figure.
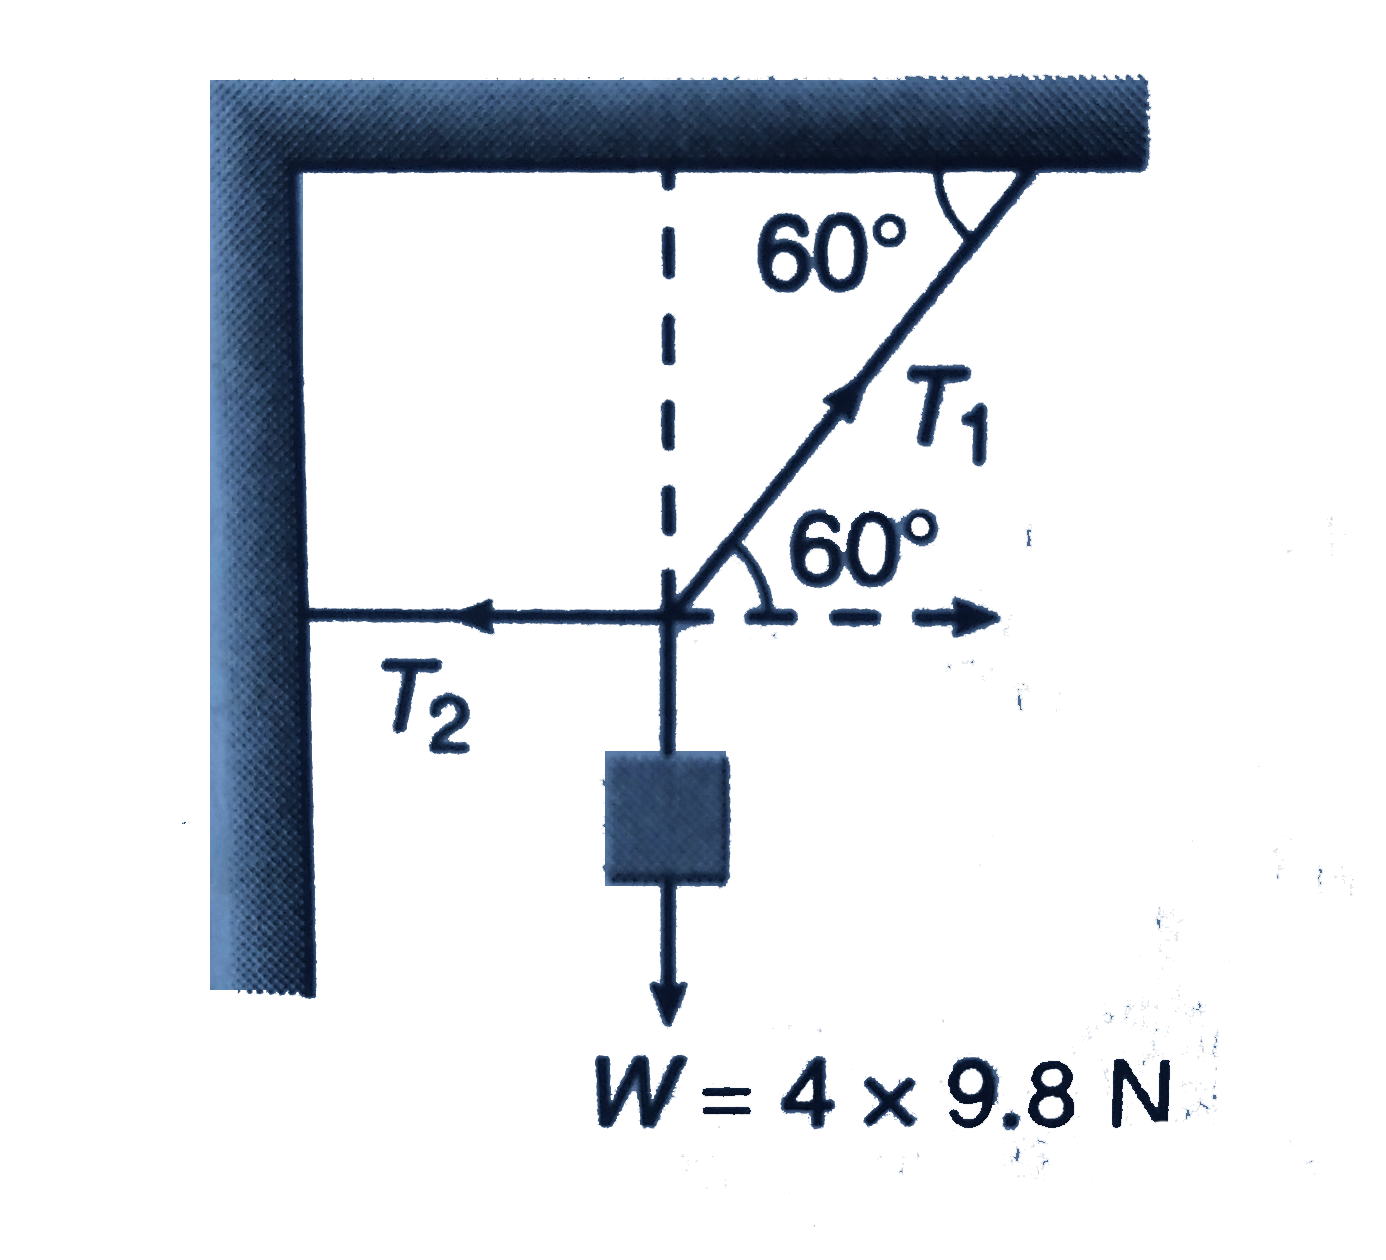
View SolutionDetermine the tensions T1 and T2 in the string as shown in figure.

View Solution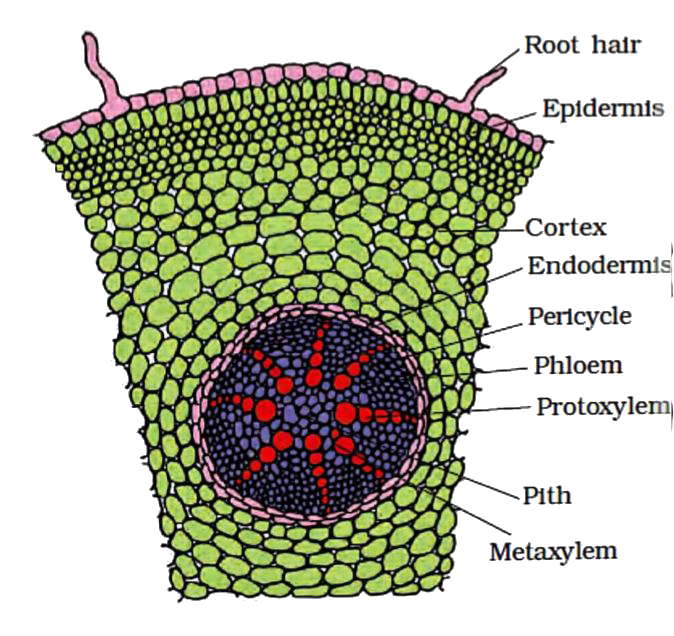
The given figure shows T.S of
View Solution


