Which of the following speed - time (v - t) graphs is physically not possible?
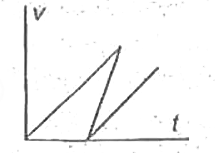
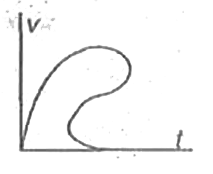
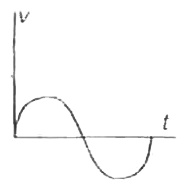
All of these
The correct Answer is:D
To determine which of the given speed-time (v-t) graphs is physically not possible, we need to analyze each option based on the fundamental properties of speed.
1. Understand the Concept of Speed:
- Speed is a scalar quantity, meaning it only has magnitude and no direction. This means that speed cannot be negative; it can only be zero or positive.
2. Analyze Option 1:
- In the first graph, if we draw a vertical line at a specific time t, we observe that there are three different speeds at that instant.
- Since a single object cannot have multiple speeds at the same time, this graph is not physically possible.
3. Analyze Option 2:
- Similarly, in the second graph, drawing a vertical line at a specific time t also reveals three different speeds for the same object.
- Again, this scenario is not possible, as an object cannot possess multiple speeds simultaneously.
4. Analyze Option 3:
- In the third graph, we notice that the speed values drop below zero, indicating negative speed.
- Since speed cannot be negative (it is a scalar quantity), this graph is also not physically possible.
5. Conclusion:
- Since all three options (1, 2, and 3) present scenarios that are not physically possible, the correct answer is that all of these graphs are invalid. Therefore, the correct option is option 4: all of these.
- Speed is a scalar quantity, meaning it only has magnitude and no direction. This means that speed cannot be negative; it can only be zero or positive.
- In the first graph, if we draw a vertical line at a specific time t, we observe that there are three different speeds at that instant.
- Since a single object cannot have multiple speeds at the same time, this graph is not physically possible.
- Similarly, in the second graph, drawing a vertical line at a specific time t also reveals three different speeds for the same object.
- Again, this scenario is not possible, as an object cannot possess multiple speeds simultaneously.
- In the third graph, we notice that the speed values drop below zero, indicating negative speed.
- Since speed cannot be negative (it is a scalar quantity), this graph is also not physically possible.
- Since all three options (1, 2, and 3) present scenarios that are not physically possible, the correct answer is that all of these graphs are invalid. Therefore, the correct option is option 4: all of these.
Topper's Solved these Questions
- BOOK - AAKASH INSTITUTE ENGLISHCHAPTER - MOTION IN A STRAIGHT LINEEXERCISE - ASSIGNMENT (SECTION - C)36videos
MOTION IN A STRAIGHT LINE
- BOOK - AAKASH INSTITUTE ENGLISHCHAPTER - MOTION IN A STRAIGHT LINEEXERCISE - ASSIGNMENT (SECTION - D)15videos
MOTION IN A STRAIGHT LINE
- BOOK - AAKASH INSTITUTE ENGLISHCHAPTER - MOTION IN A STRAIGHT LINEEXERCISE - ASSIGNMENT (SECTION - A)58videos
MOTION IN A STRAIGHT LINE
- BOOK - AAKASH INSTITUTE ENGLISHCHAPTER - MOTION IN A PLANEEXERCISE - Assignement section -J (Aakash Challengers Questions)7videos
MOTION IN A PLANE
- BOOK - AAKASH INSTITUTE ENGLISHCHAPTER - MOTION IN STRAIGHT LINEEXERCISE - Assignment (SECTION - J)2videos
MOTION IN STRAIGHT LINE
Similar Questions
Knowledge Check
- Question 1 - Select One
Which of the following is the vm = T graph for a perfectly black body ( vm =maximum frequency of radiation)
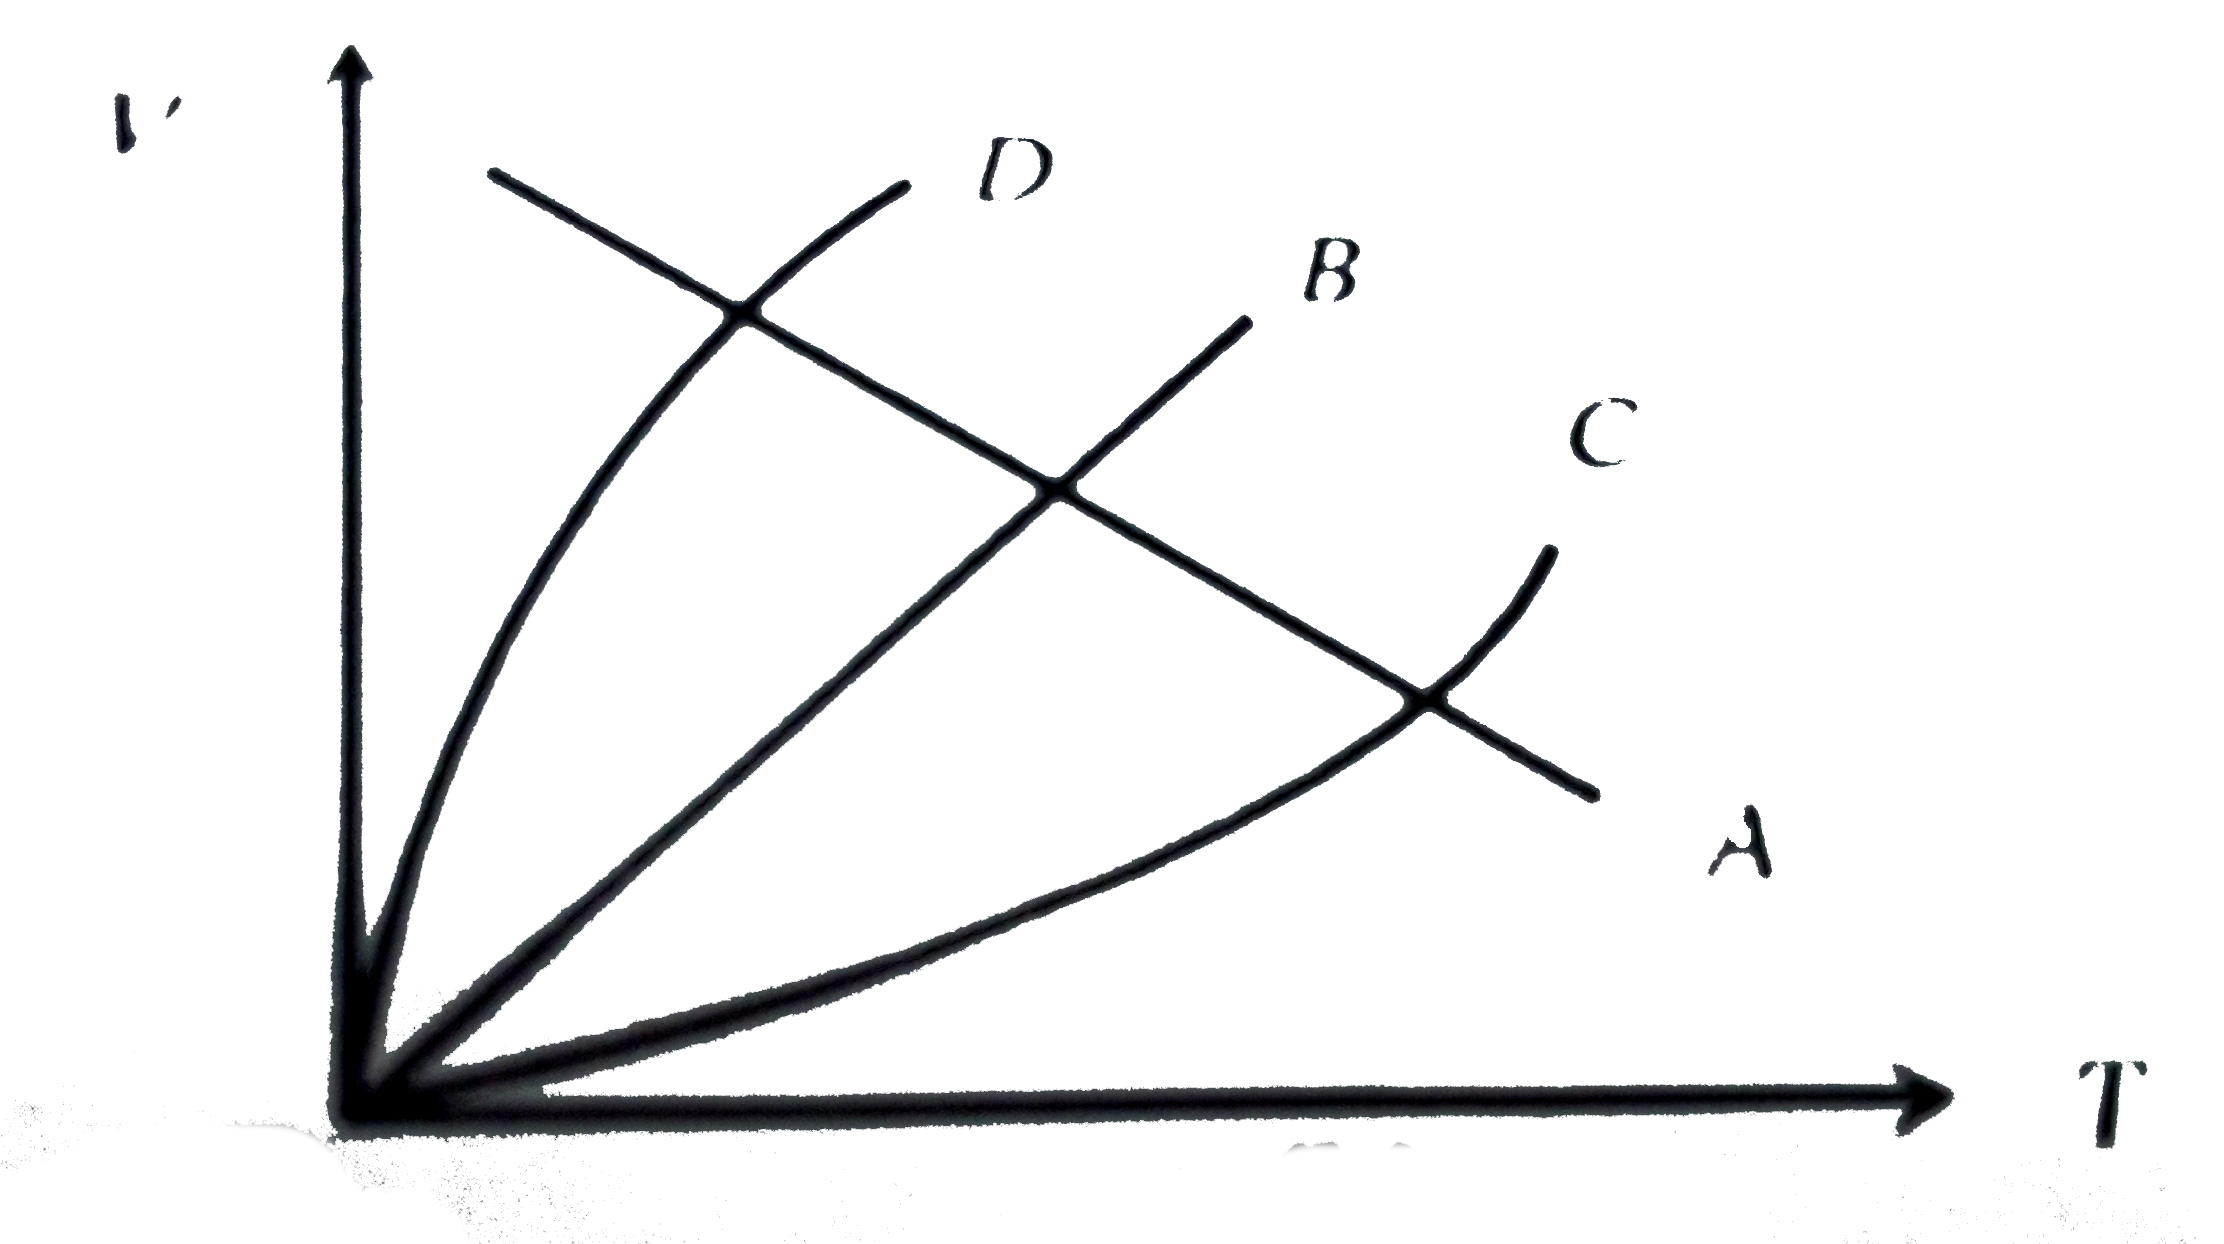 AABBCCDD
Which of the following displacement (X) time graphs is not possible?
View SolutionFor a particle in motion which of the following speed-time graphs can be realized in practice :
 View Solution
Are the following velocity − time graph and speed − time graphs possible ?
 View Solution
which of the following volume temperature (V−T) graph represent carnot engine cycle ABCDA?
View SolutionWhich of the following.v-t graph can be obtained in practice?
 View Solution
In the following displacement (x) vs time (t) graph, at which among the point P,Q and R is the object speed increasing ?
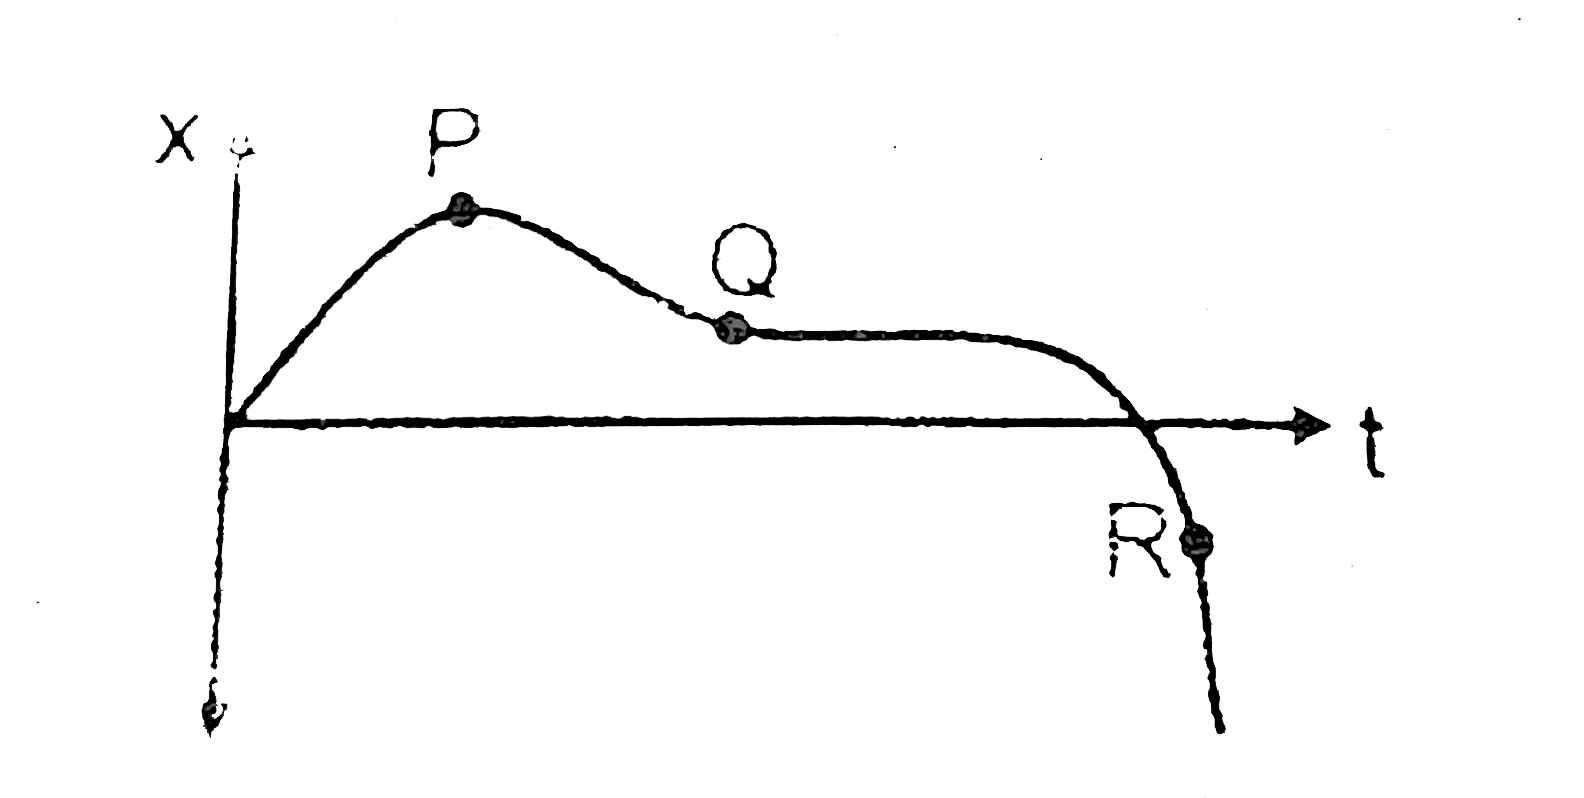 View Solution
On a straight road a thief, seeing a police car approaching at a constant speed v, runs away on a bike with constant accelration 'a'. Which of the following position time graphs best represent the case in which the theif is just nabbed ?
View Solution

