In figure, P−V curve of an ideal gas is given. During the process, the cumulative work done by the gas

continuously increases
continuously decreases
first increases then decreases
first decreases then increases
The correct Answer is:A
As volume increases
∴WD continously increases
Topper's Solved these Questions
- KTG & THERMODYNAMICSBOOK - RESONANCE ENGLISHCHAPTER - KTG & THERMODYNAMICSEXERCISE - Exercise-2
1 Videos
- KTG & THERMODYNAMICSBOOK - RESONANCE ENGLISHCHAPTER - KTG & THERMODYNAMICSEXERCISE - PART -I
15 Videos
- KTG & THERMODYNAMICSBOOK - RESONANCE ENGLISHCHAPTER - KTG & THERMODYNAMICSEXERCISE - PART -II
17 Videos
- KINETIC THEORY OF GASES AND THERMODYNAMICSBOOK - RESONANCE ENGLISHCHAPTER - KINETIC THEORY OF GASES AND THERMODYNAMICSEXERCISE - Exercise
64 Videos
- MAGNETIC FIELD AND FORCESBOOK - RESONANCE ENGLISHCHAPTER - MAGNETIC FIELD AND FORCESEXERCISE - Exercise
64 Videos
Similar Questions
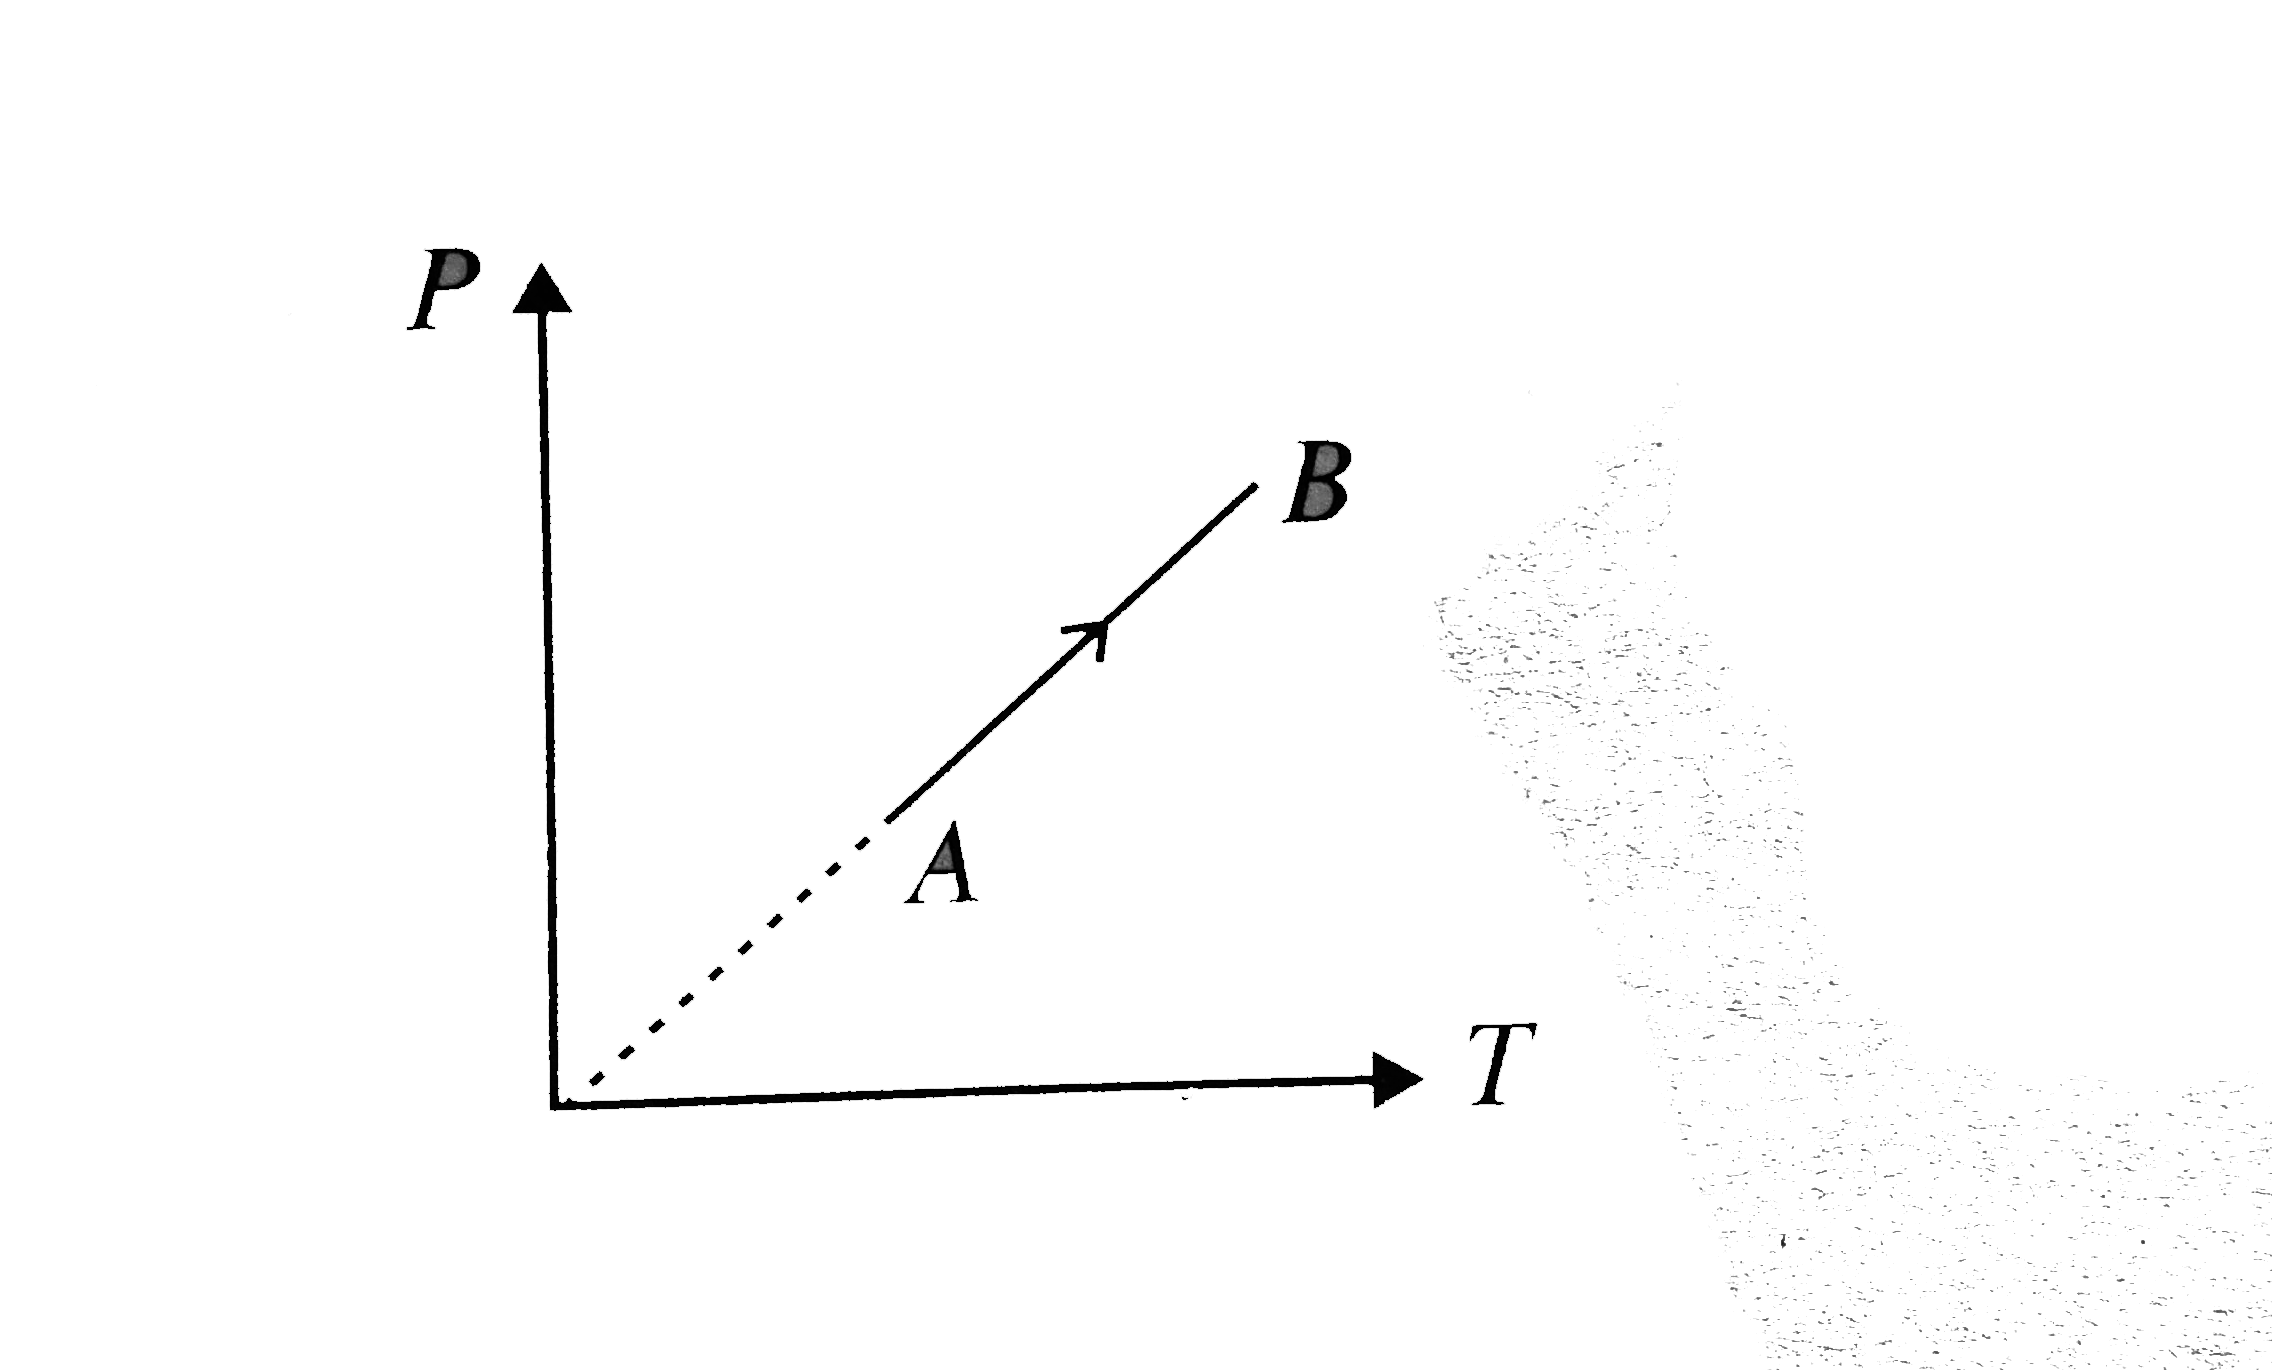
In figure, a sample of an ideal gas is taken through the cyclic process abca. 800J of work is done by the gas during process ab. If gas absorb no heat in process ab, rejects 100J of heat during bc and absord 500J of heat during process ca. Then (a) find the internal energy of the gas at b and c if its is 1000J at a (b). Also calculate the work by the gas during the part bc,

View SolutionDuring the process AB of an ideal gas

View Solution
Knowledge Check
An ideal gas system undergoes an isothermal process, then the work done during the process is
AnRTln(V2V1)BnRTln(V1V2)C2nRTln(V2V1)D2nRTln(V1V2)
During the process AB of an ideal gas

View SolutionIn the figure shown below, an ideal gas is carried around the cyclic process. How much work is done in one cycle if P0=8atmandV0=7.00 litre?
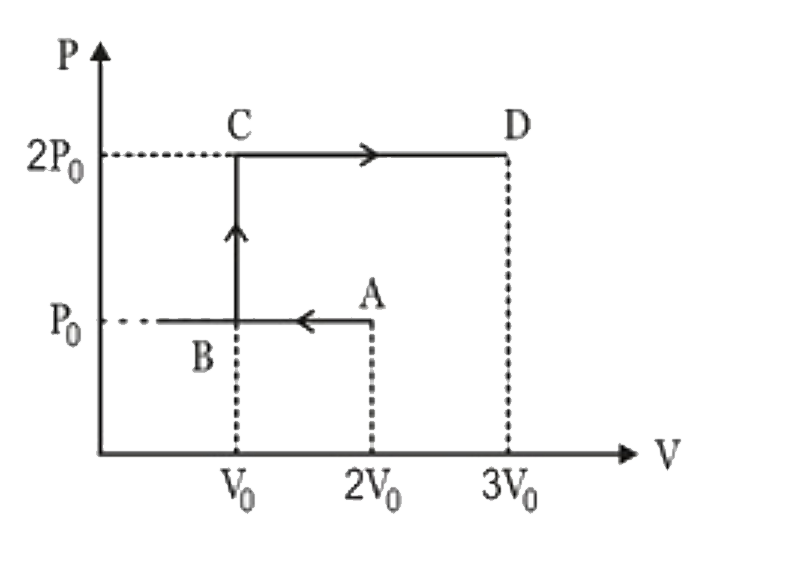
View SolutionP – V graph of an ideal gas is as shown in the diagram . Work done by the gas in the process ABCD is

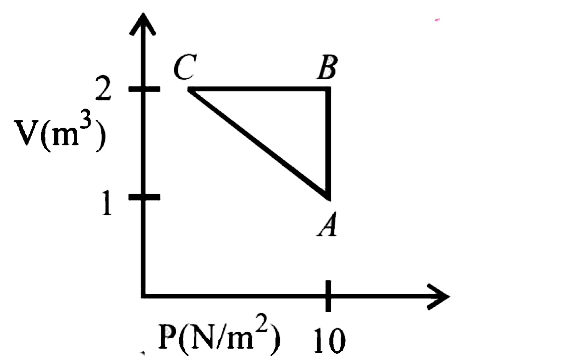
View SolutionAn ideal gas is taken through the cycle A→B→C→A, as shown in the figure, If the net heat supplied to the gas in the cycle is 5J, the work done by the gas in the process CtoA is

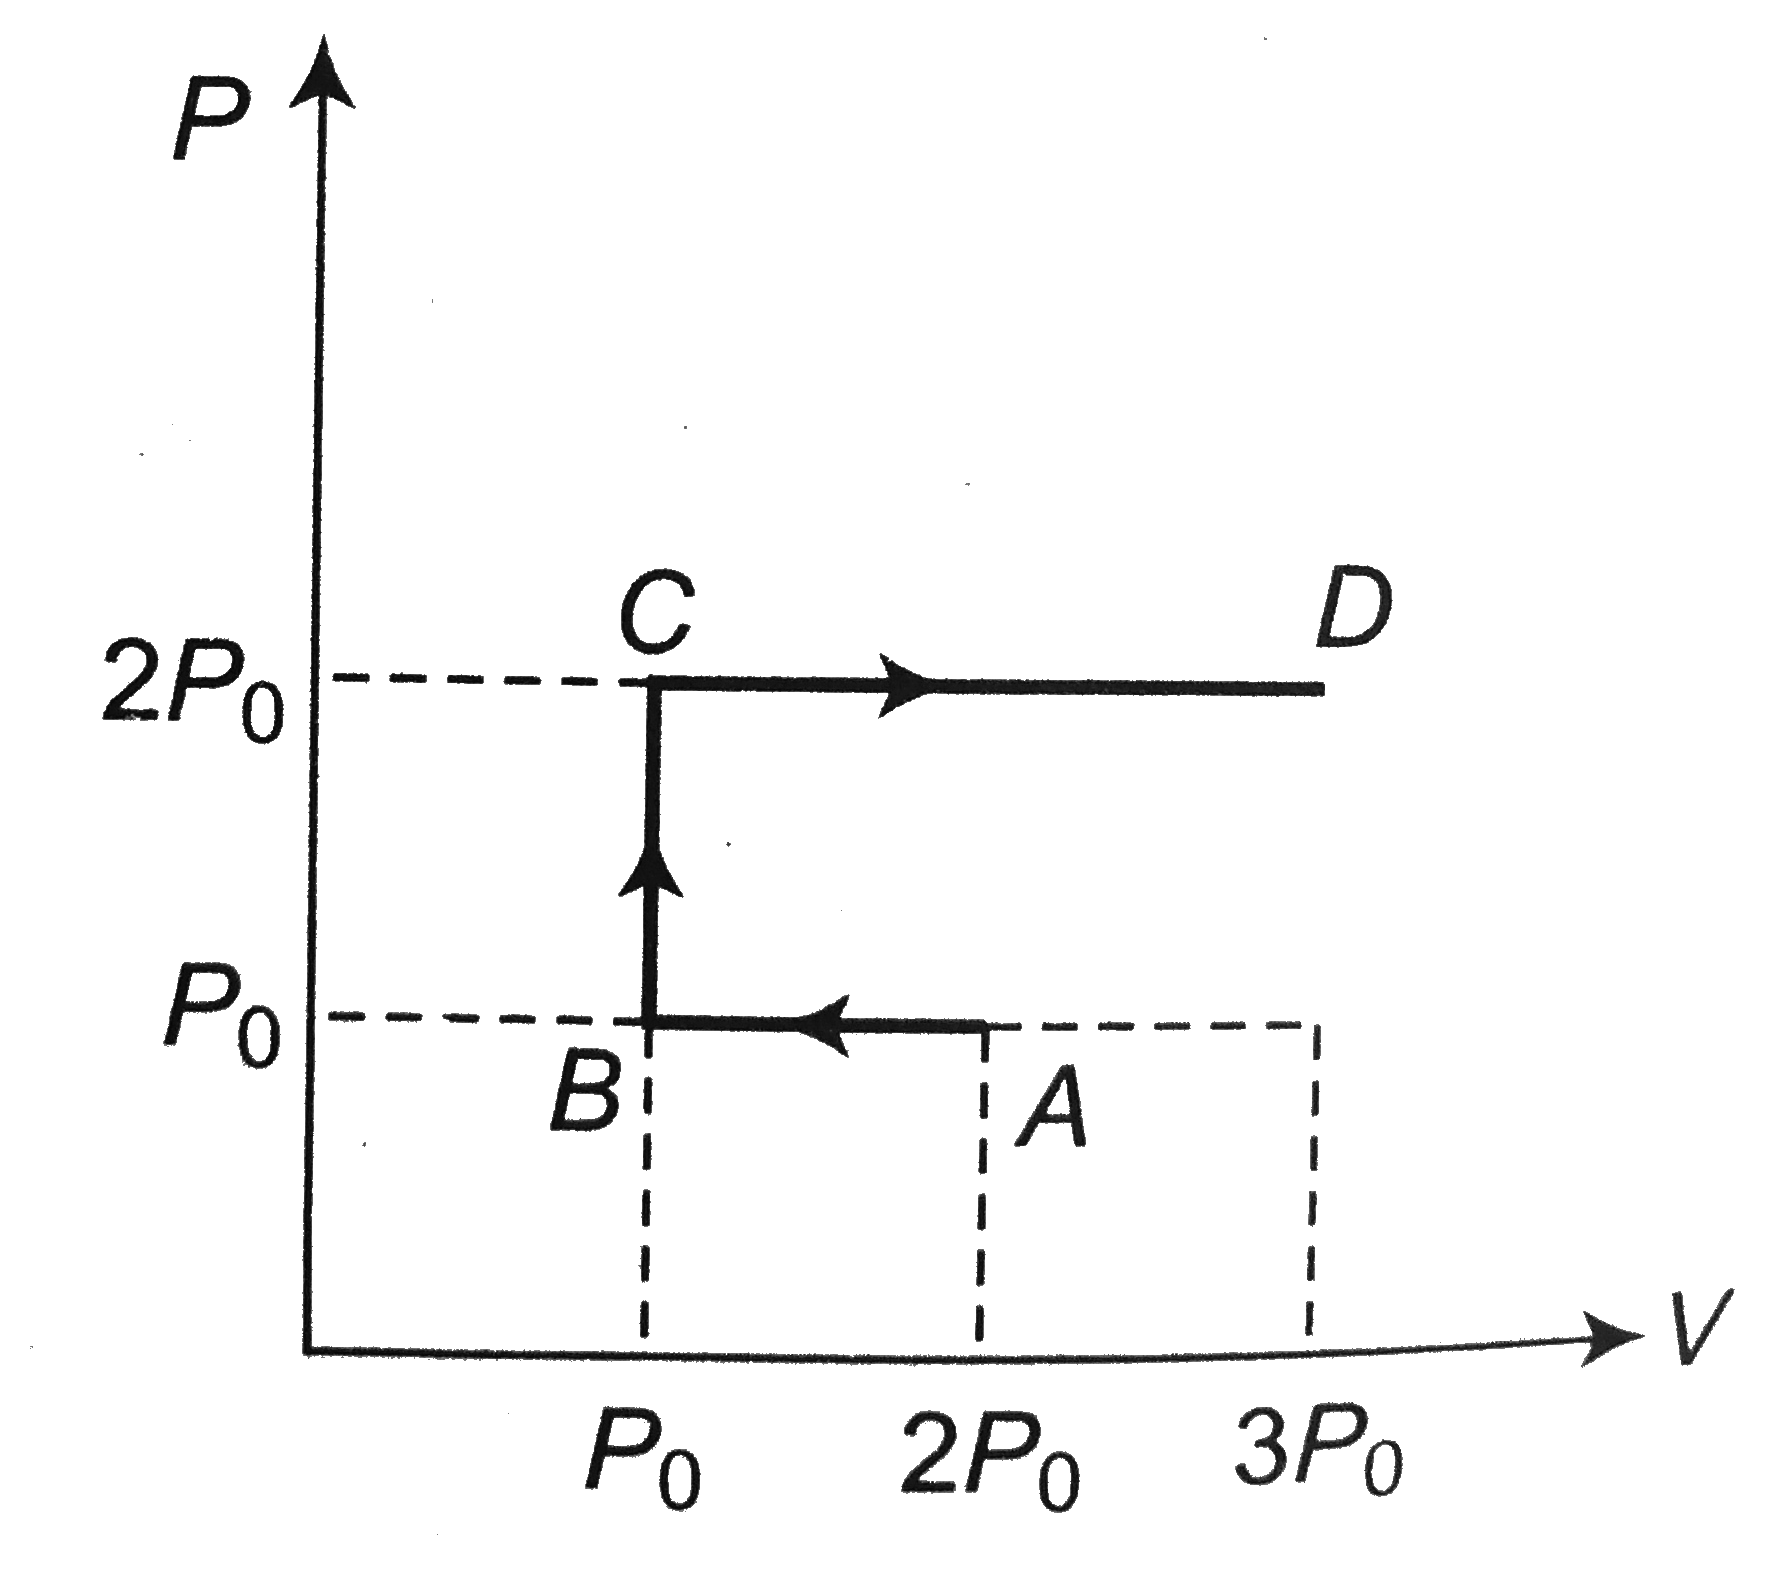
View SolutionP−V diagram of an ideal gas is as shown in figure. Work done by the gas in process ABCD is

View SolutionP-V diagram of an ideal gas is as shown in figure. Work done by the gas in the process ABCD is

View SolutionIn a process, the pressure of an ideal gas is proportional to square of the volume of the gas. If the temperature of the gas increases in this process, then work done by this gas
View Solution
