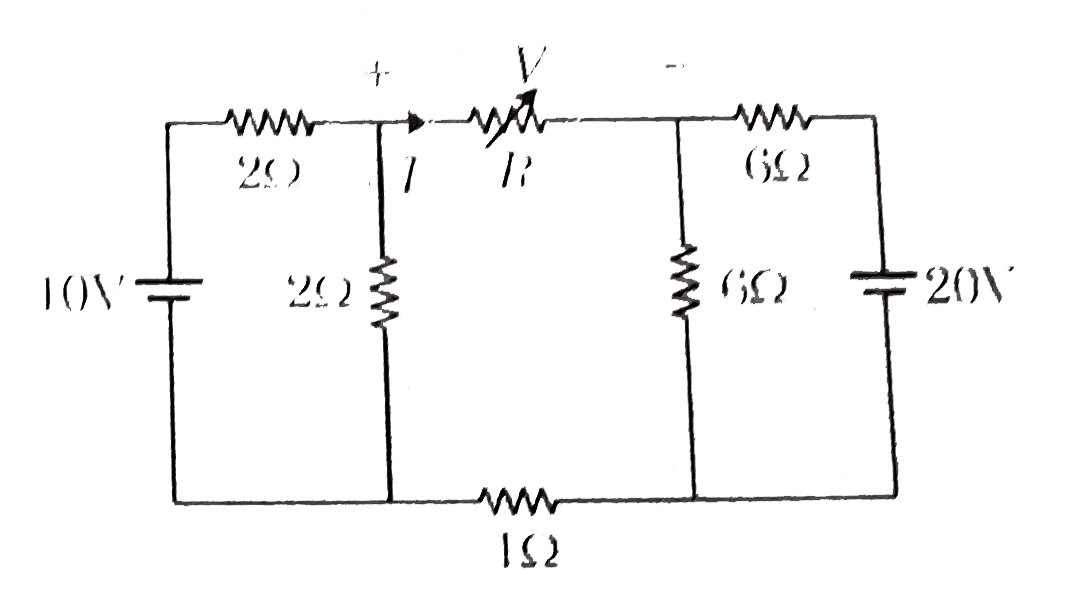
Consider circuit as shown . Which of the graph best represent V-l relationship across the variable resistance R.
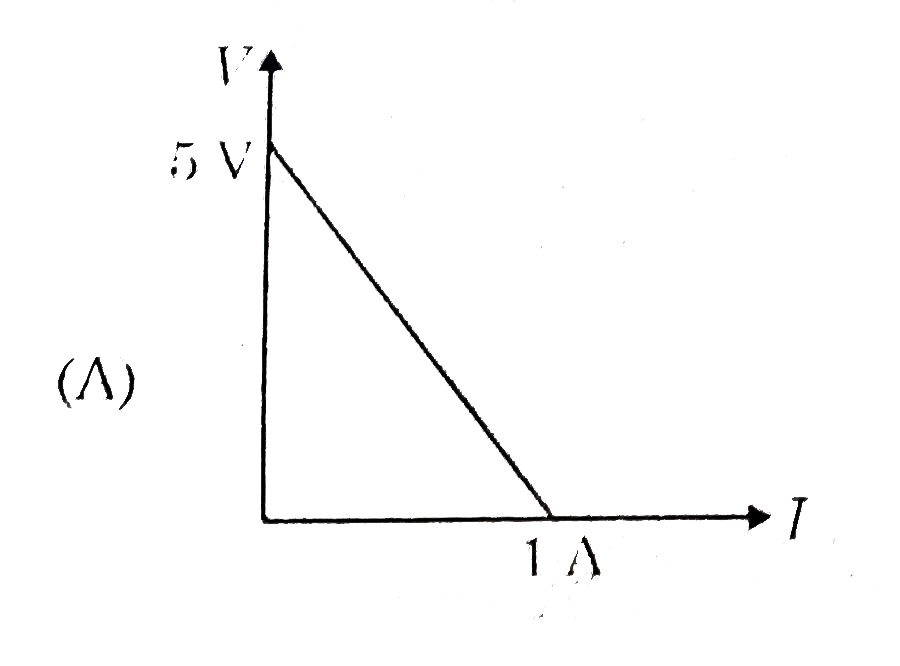
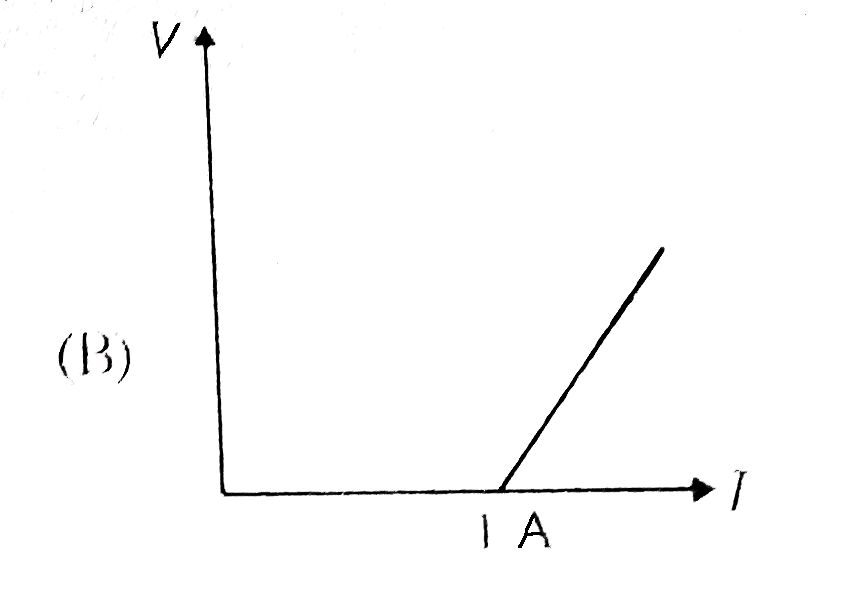
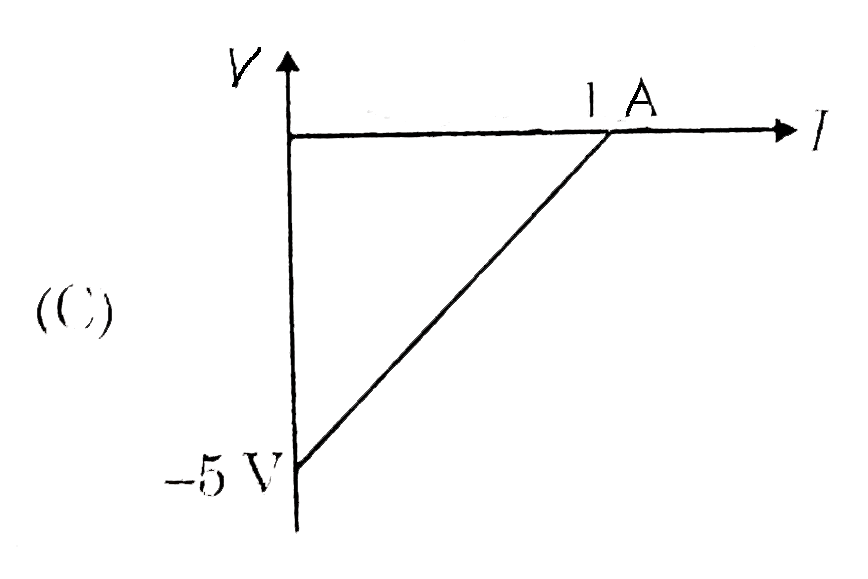
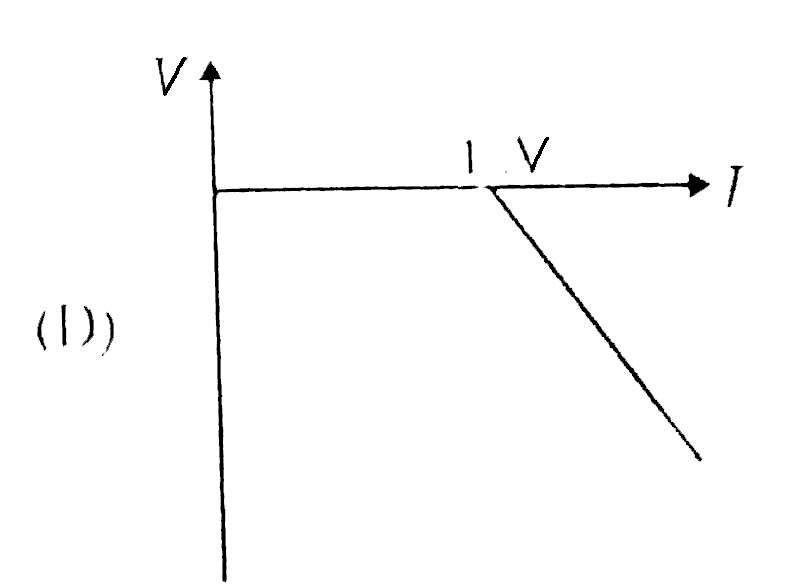
The correct Answer is:A
Step by step video & image solution for Consider circuit as shown . Which of the graph best represent V-l relationship across the variable resistance R. by Physics experts to help you in doubts & scoring excellent marks in Class 12 exams.
Updated on:21/07/2023Similar Questions
Which graph best represent the relationship between conductivity and resistivity for a solid ?
View SolutionThe graph shown the variation with times t of the velocity v of an object . Which one of the following graphs best represents the variation of acceleration a of the object with time t?

View SolutionWhich of the shown graphs may represent the reactance of a series L-C combination?
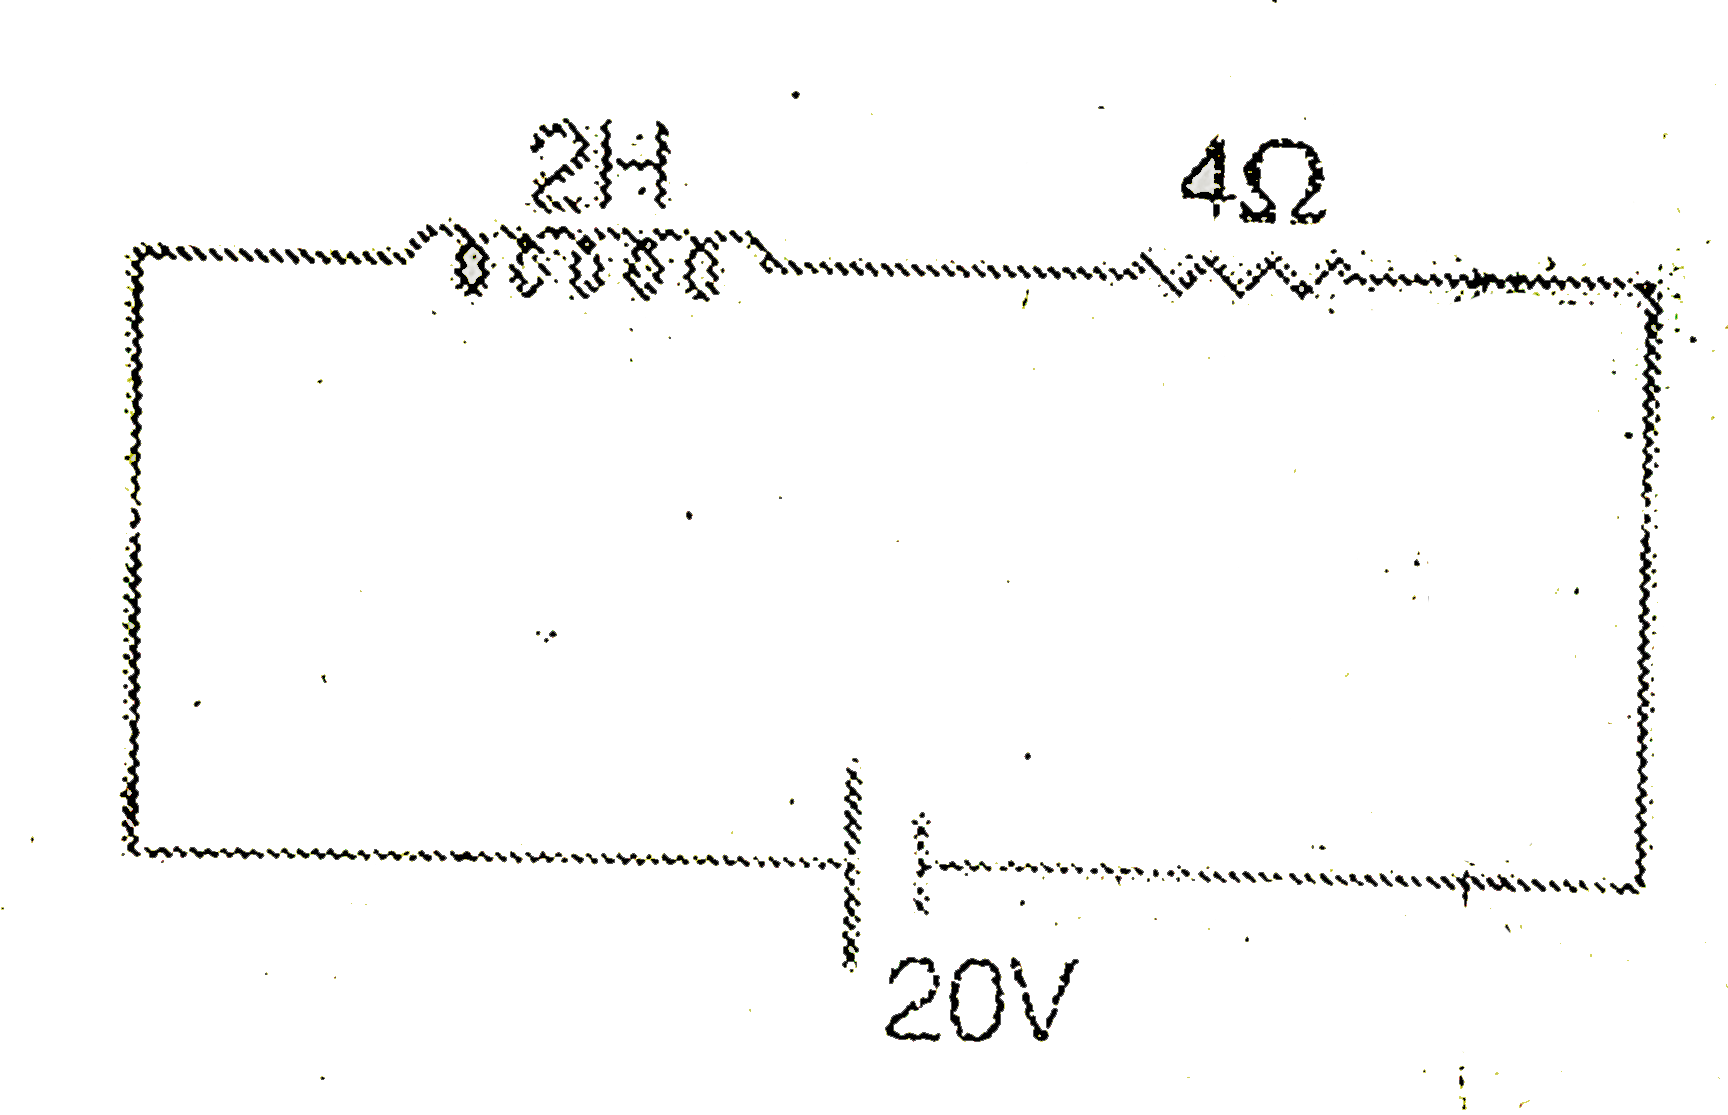
View SolutionIn the L-R circuit as shown in figure, potential difference across the resistance at some instant is 4 V. Then
View SolutionIn the circuit shown in figure resistance of each wire is r. Net resistance across

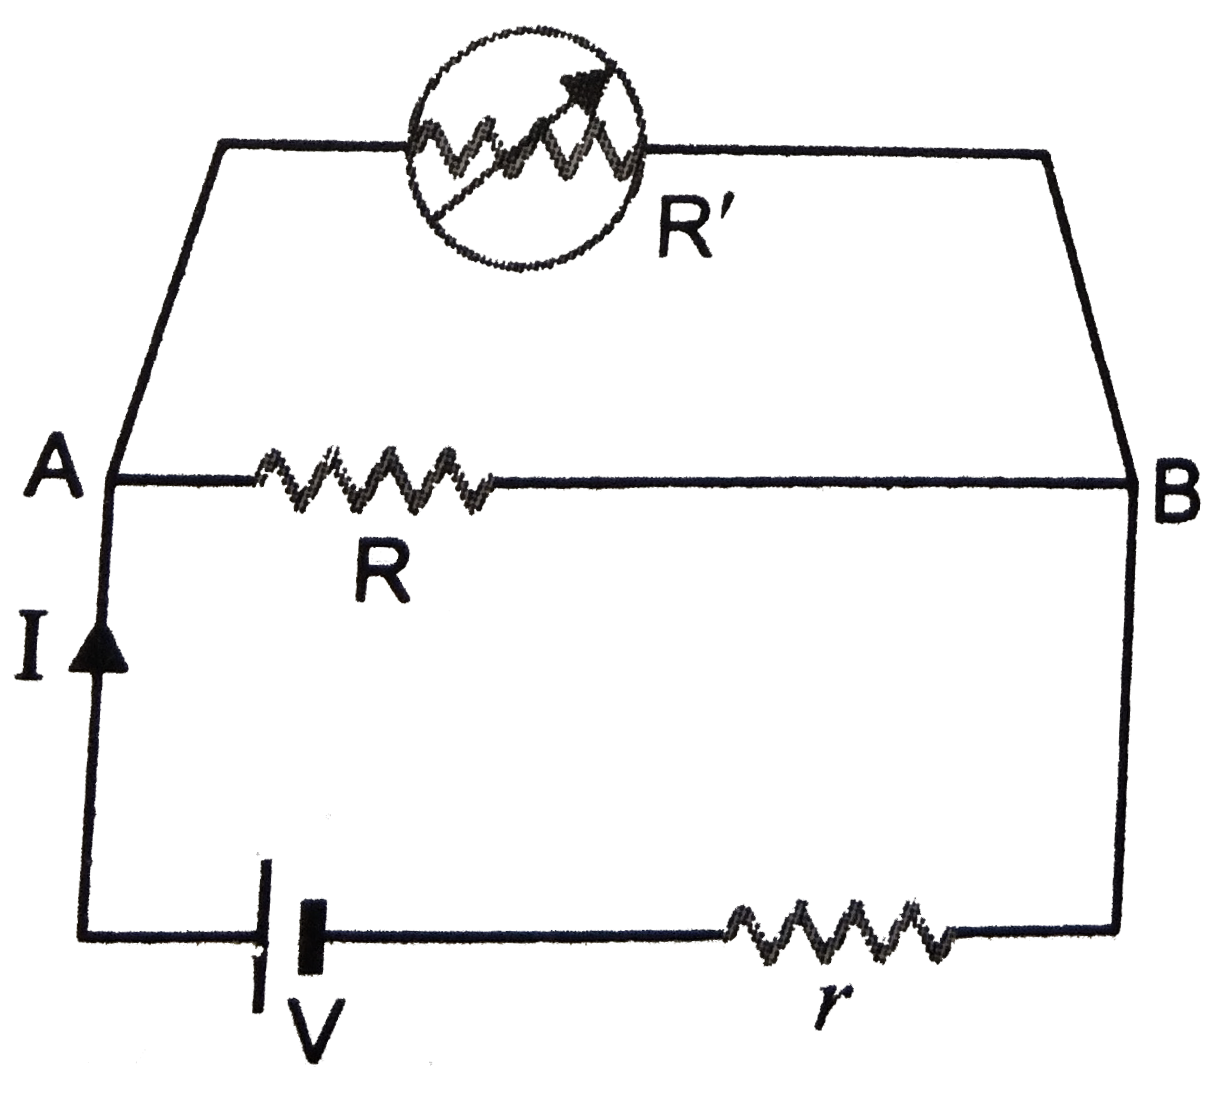
View SolutionConsider a simple circuit shown in Fig. 2(ET).2. stands for a variable resistance R'.R' can vary from R0 to infinity. r is internal resistance of the battery (r<<R<<lR0)
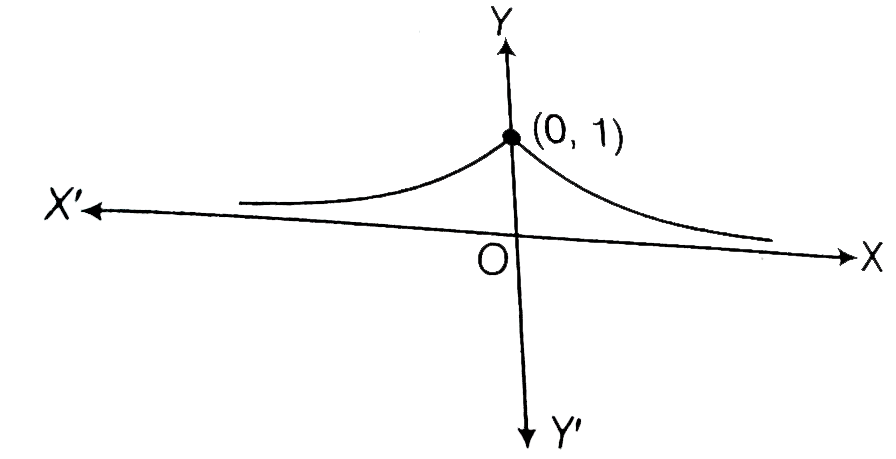
View SolutionWhich one of the following function best represents the graphs as shown below?
View SolutionWhich of the graphs shown below does not represent the relationship between incident light and the electron ejected from metal surface ?
View SolutionWhich of the graphs shown below does not represent the relationship between incident light and the electron ejected from metal surface?
View SolutionWhich of the graphs shown below does not represent the relationship between incident light and the electron ejected from metal surface?
View Solution
