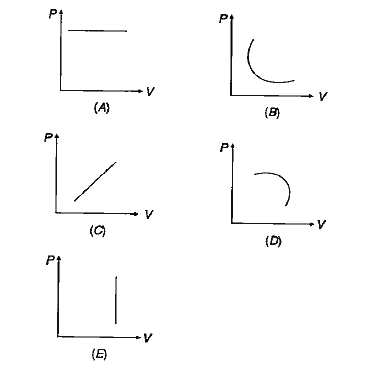
Which of the accompanying P-V diagrams best represents an isothermal process ?
 Solution in Malayalam
A
B
C
D
The correct Answer is:B
The isothermal curve on P-V diagram is like a hyperbola.
Similar Questions
Which of the following P-V diagram represent the graph of isometric process?
View SolutionSample of gases are taken through isothermal and adiabatic process. Choose which of the following diagram correctly represent isothermal and adiabatic process
View SolutionAssertion: Isothermal and adiabatic, two processes are shown on p-V diagram. Process-1 is aidabatic and process-2 is isothermal. Reason: At a given point, slope of adiabatic process =gammaxx slope of isothermal process.
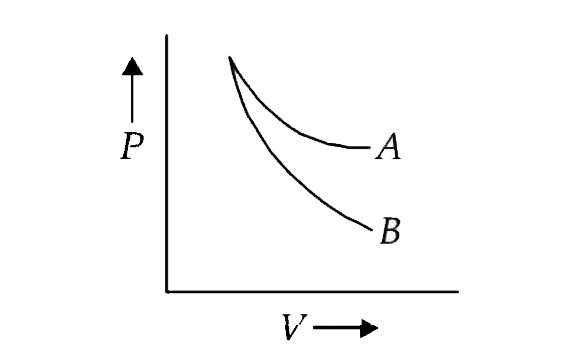
View SolutionThe curves A and B in the figure shown P-V graphs for an isothermal and an adiabatic process for an idea gas. The isothermal process is represented by the curve A.

View SolutionShow adiabatic and isothermal processes on a single P-V diagram.
View SolutionWhich of the following P-V curve best represents. As isothermal process?
View SolutionFor P-V diagram of a thermodynamic cycle as shown in figure,process BC and DA are isothermal. Which of the corresponding graphs is correct?
View SolutionFor a given thermodynamic cyclic process, P-V indicator diagram is as shown in the figure. Process AB,BC & CA are isobaric, & isothermal respectively. Then which of the following curve represent correc V-T indicator diagram for the process ABCA ?
View Solution
