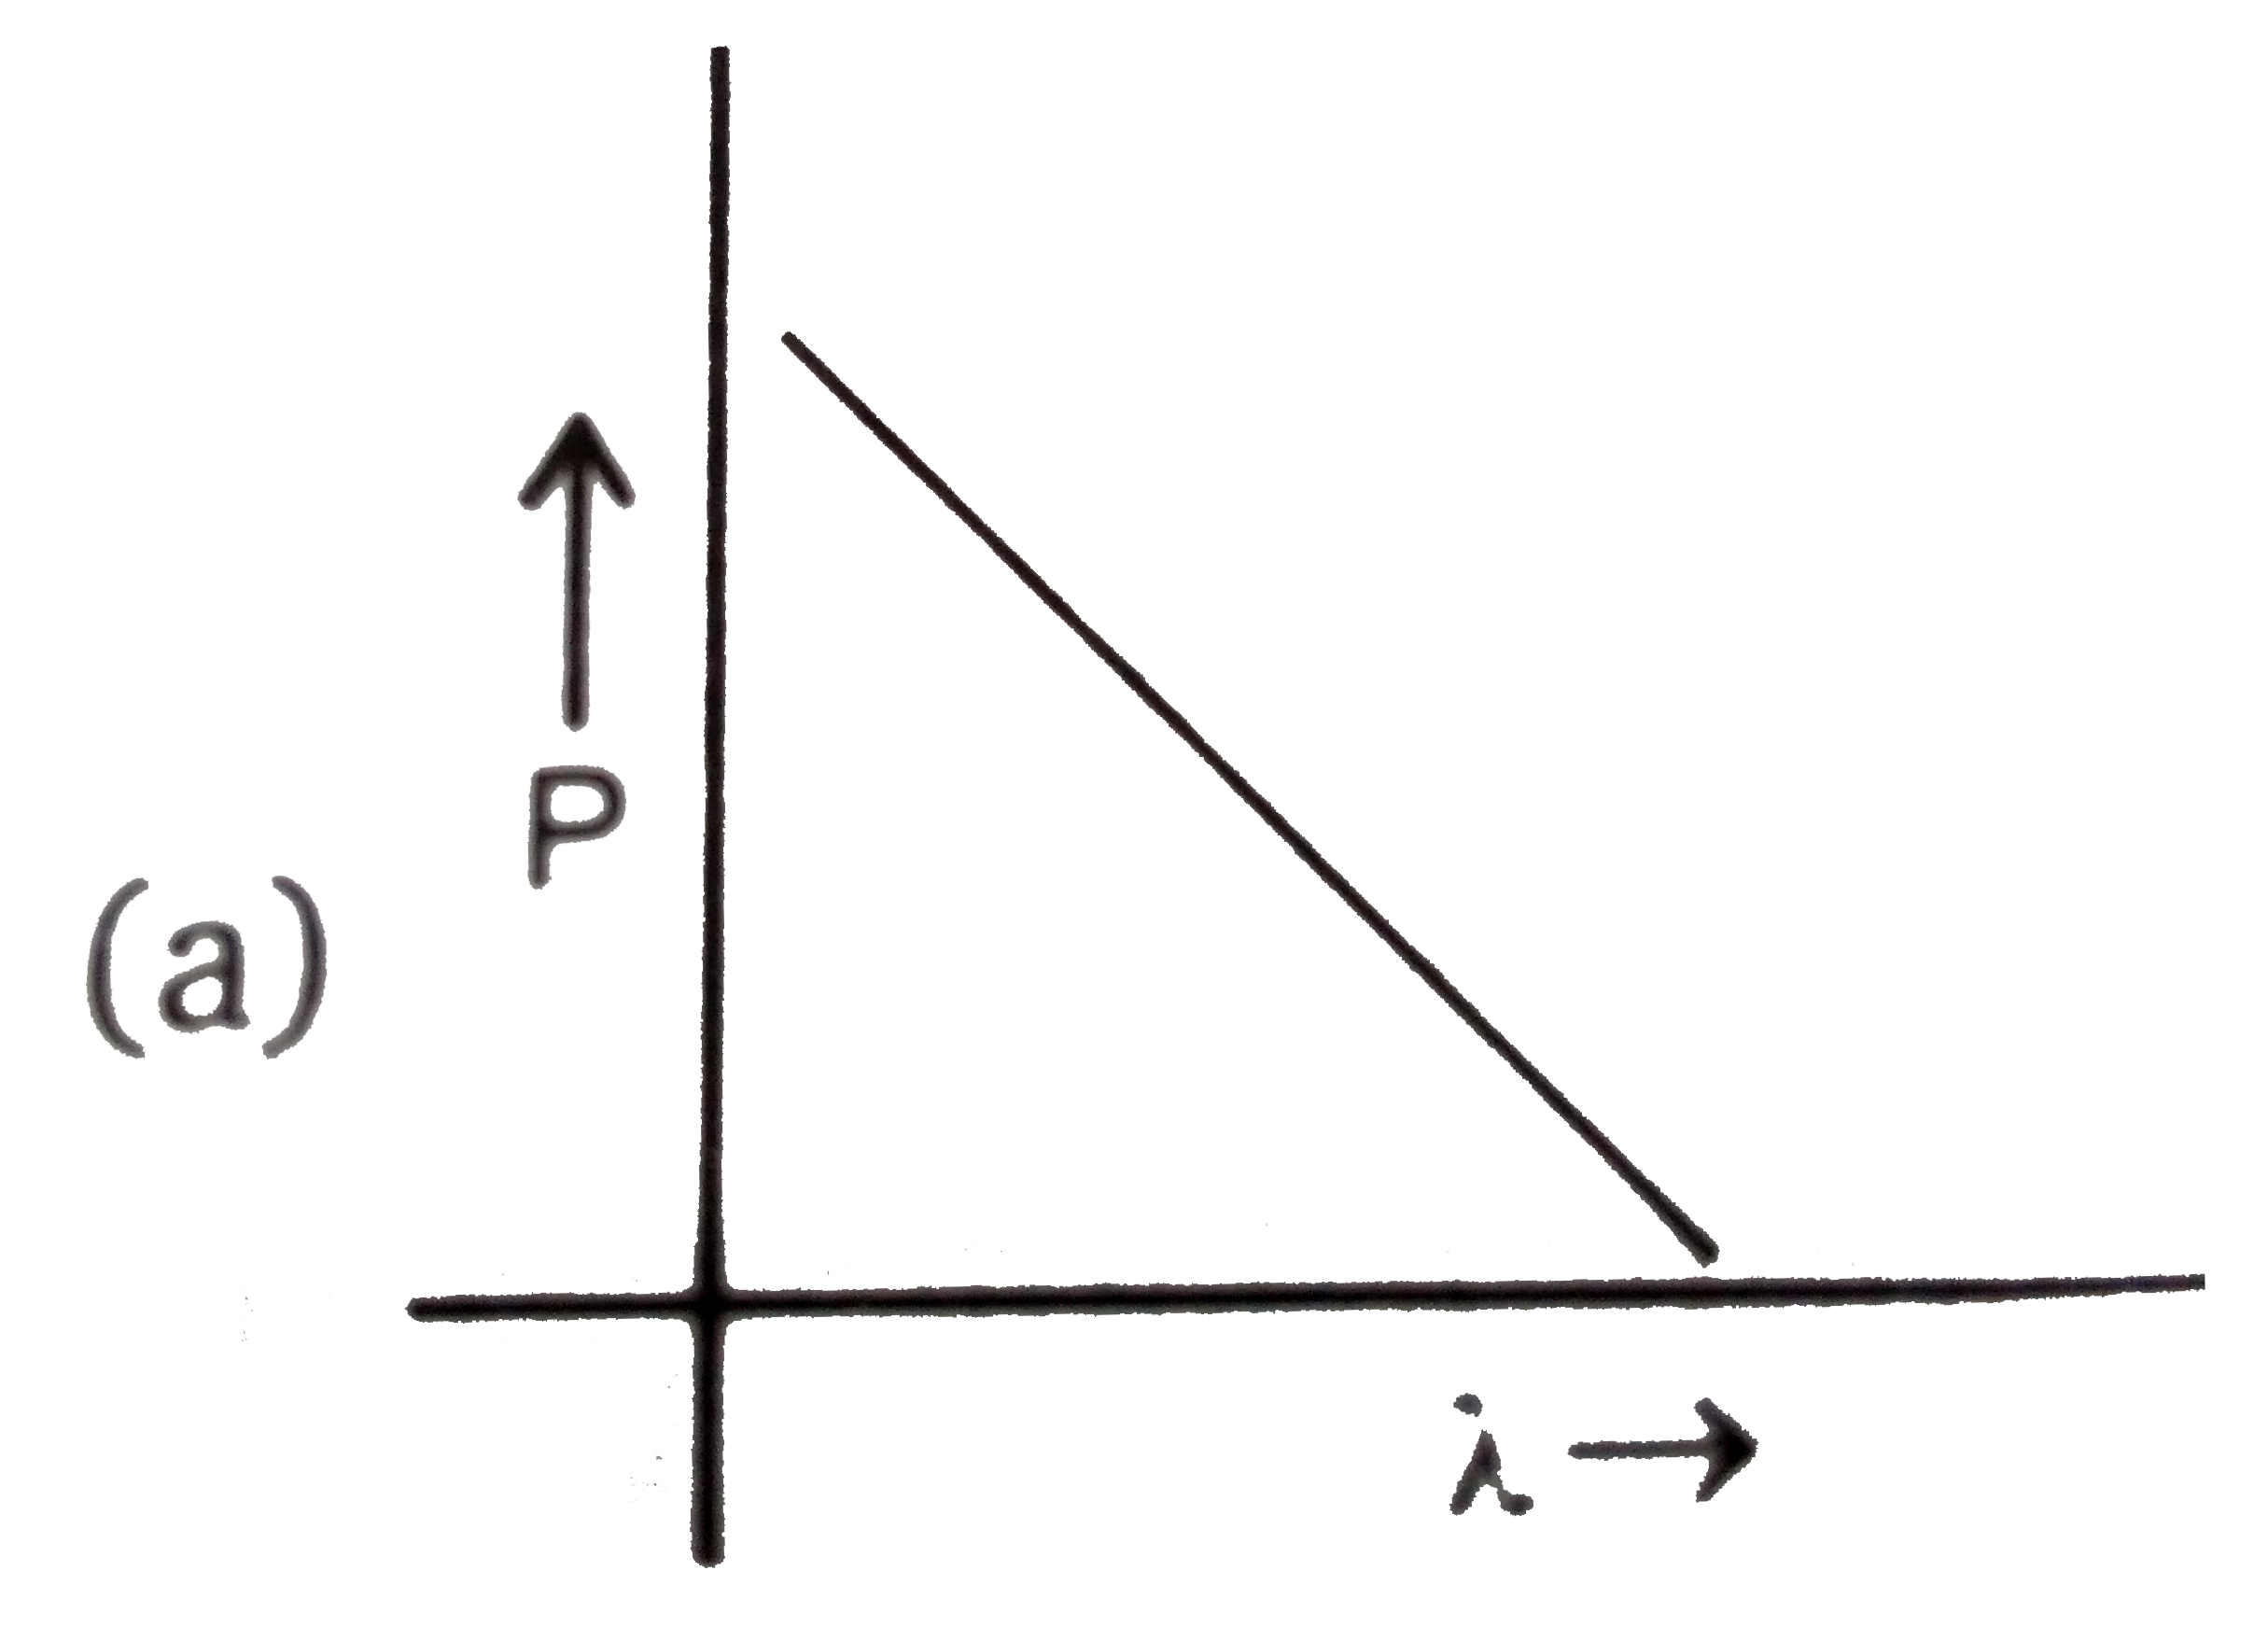
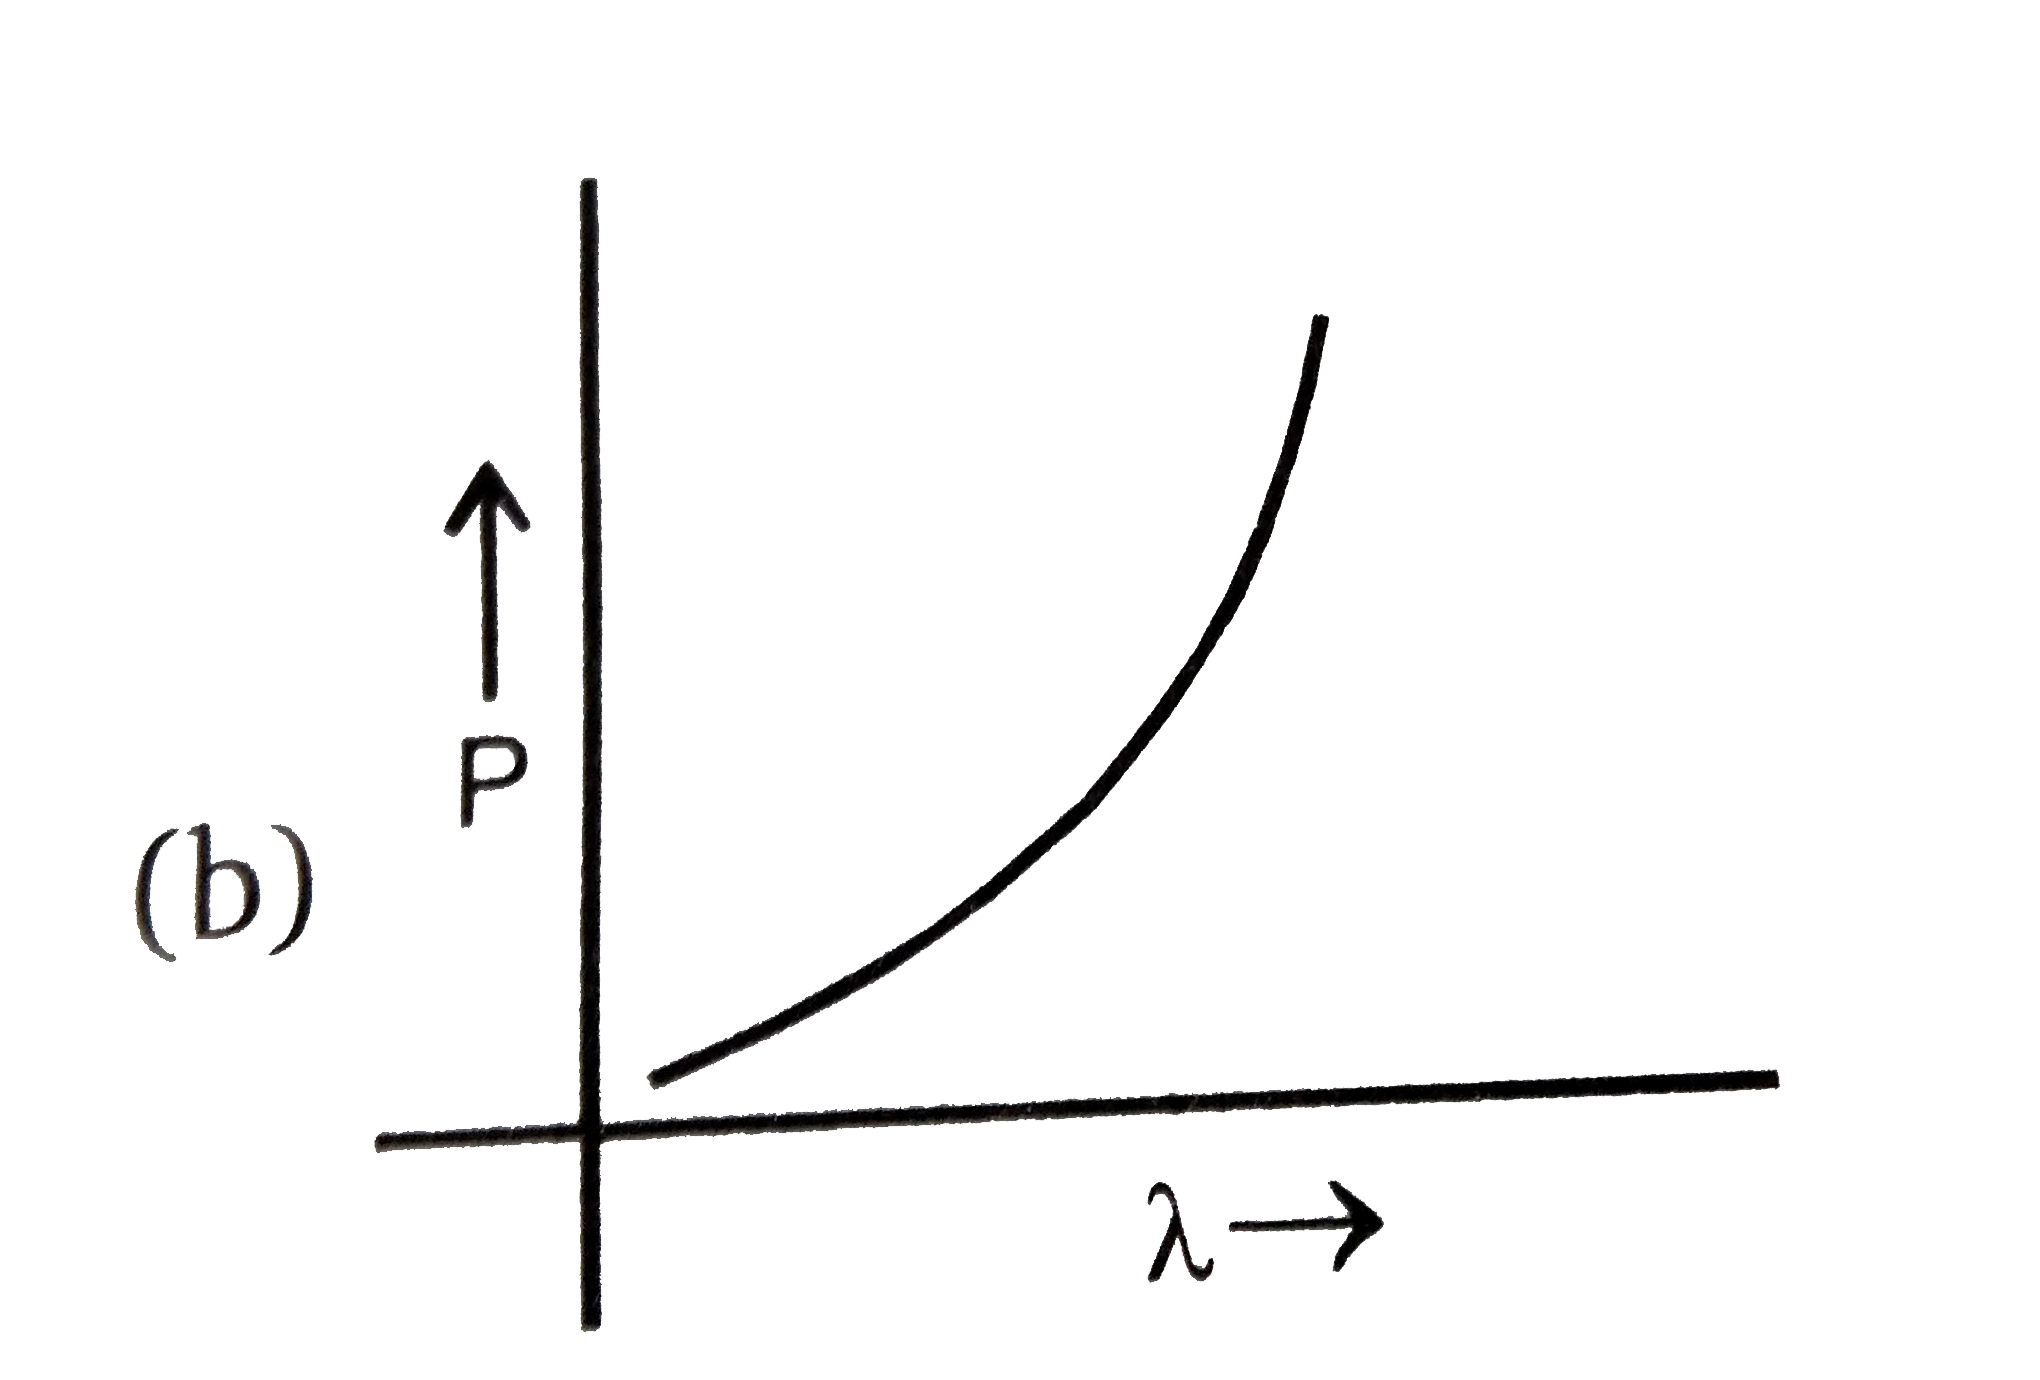
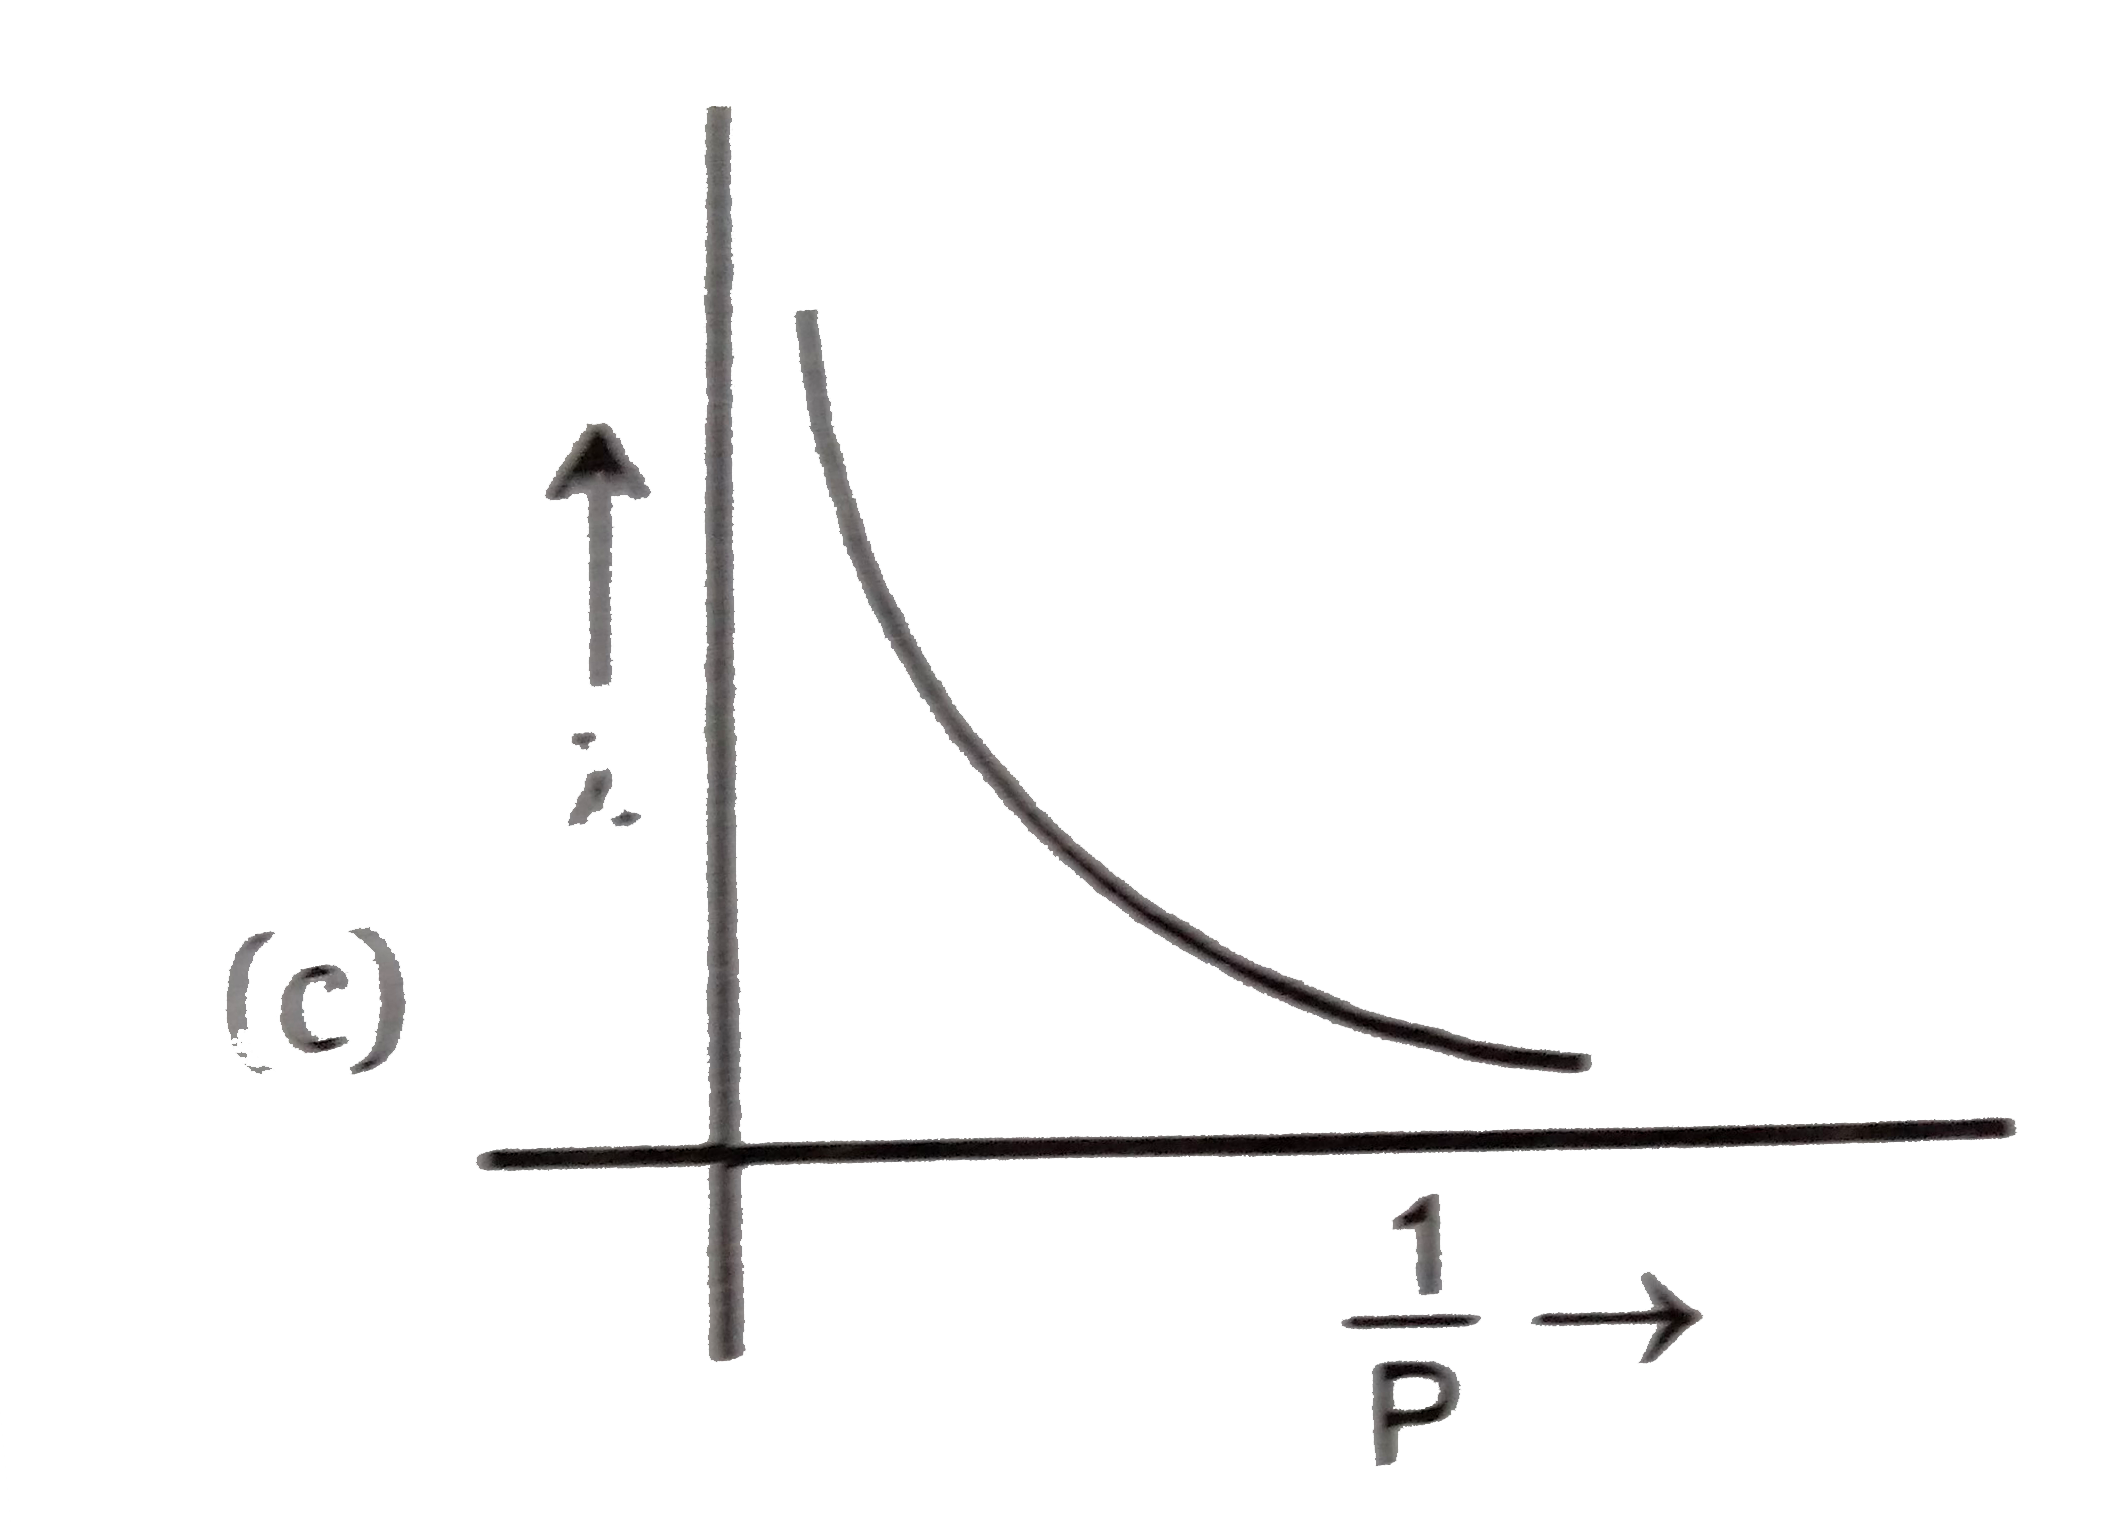
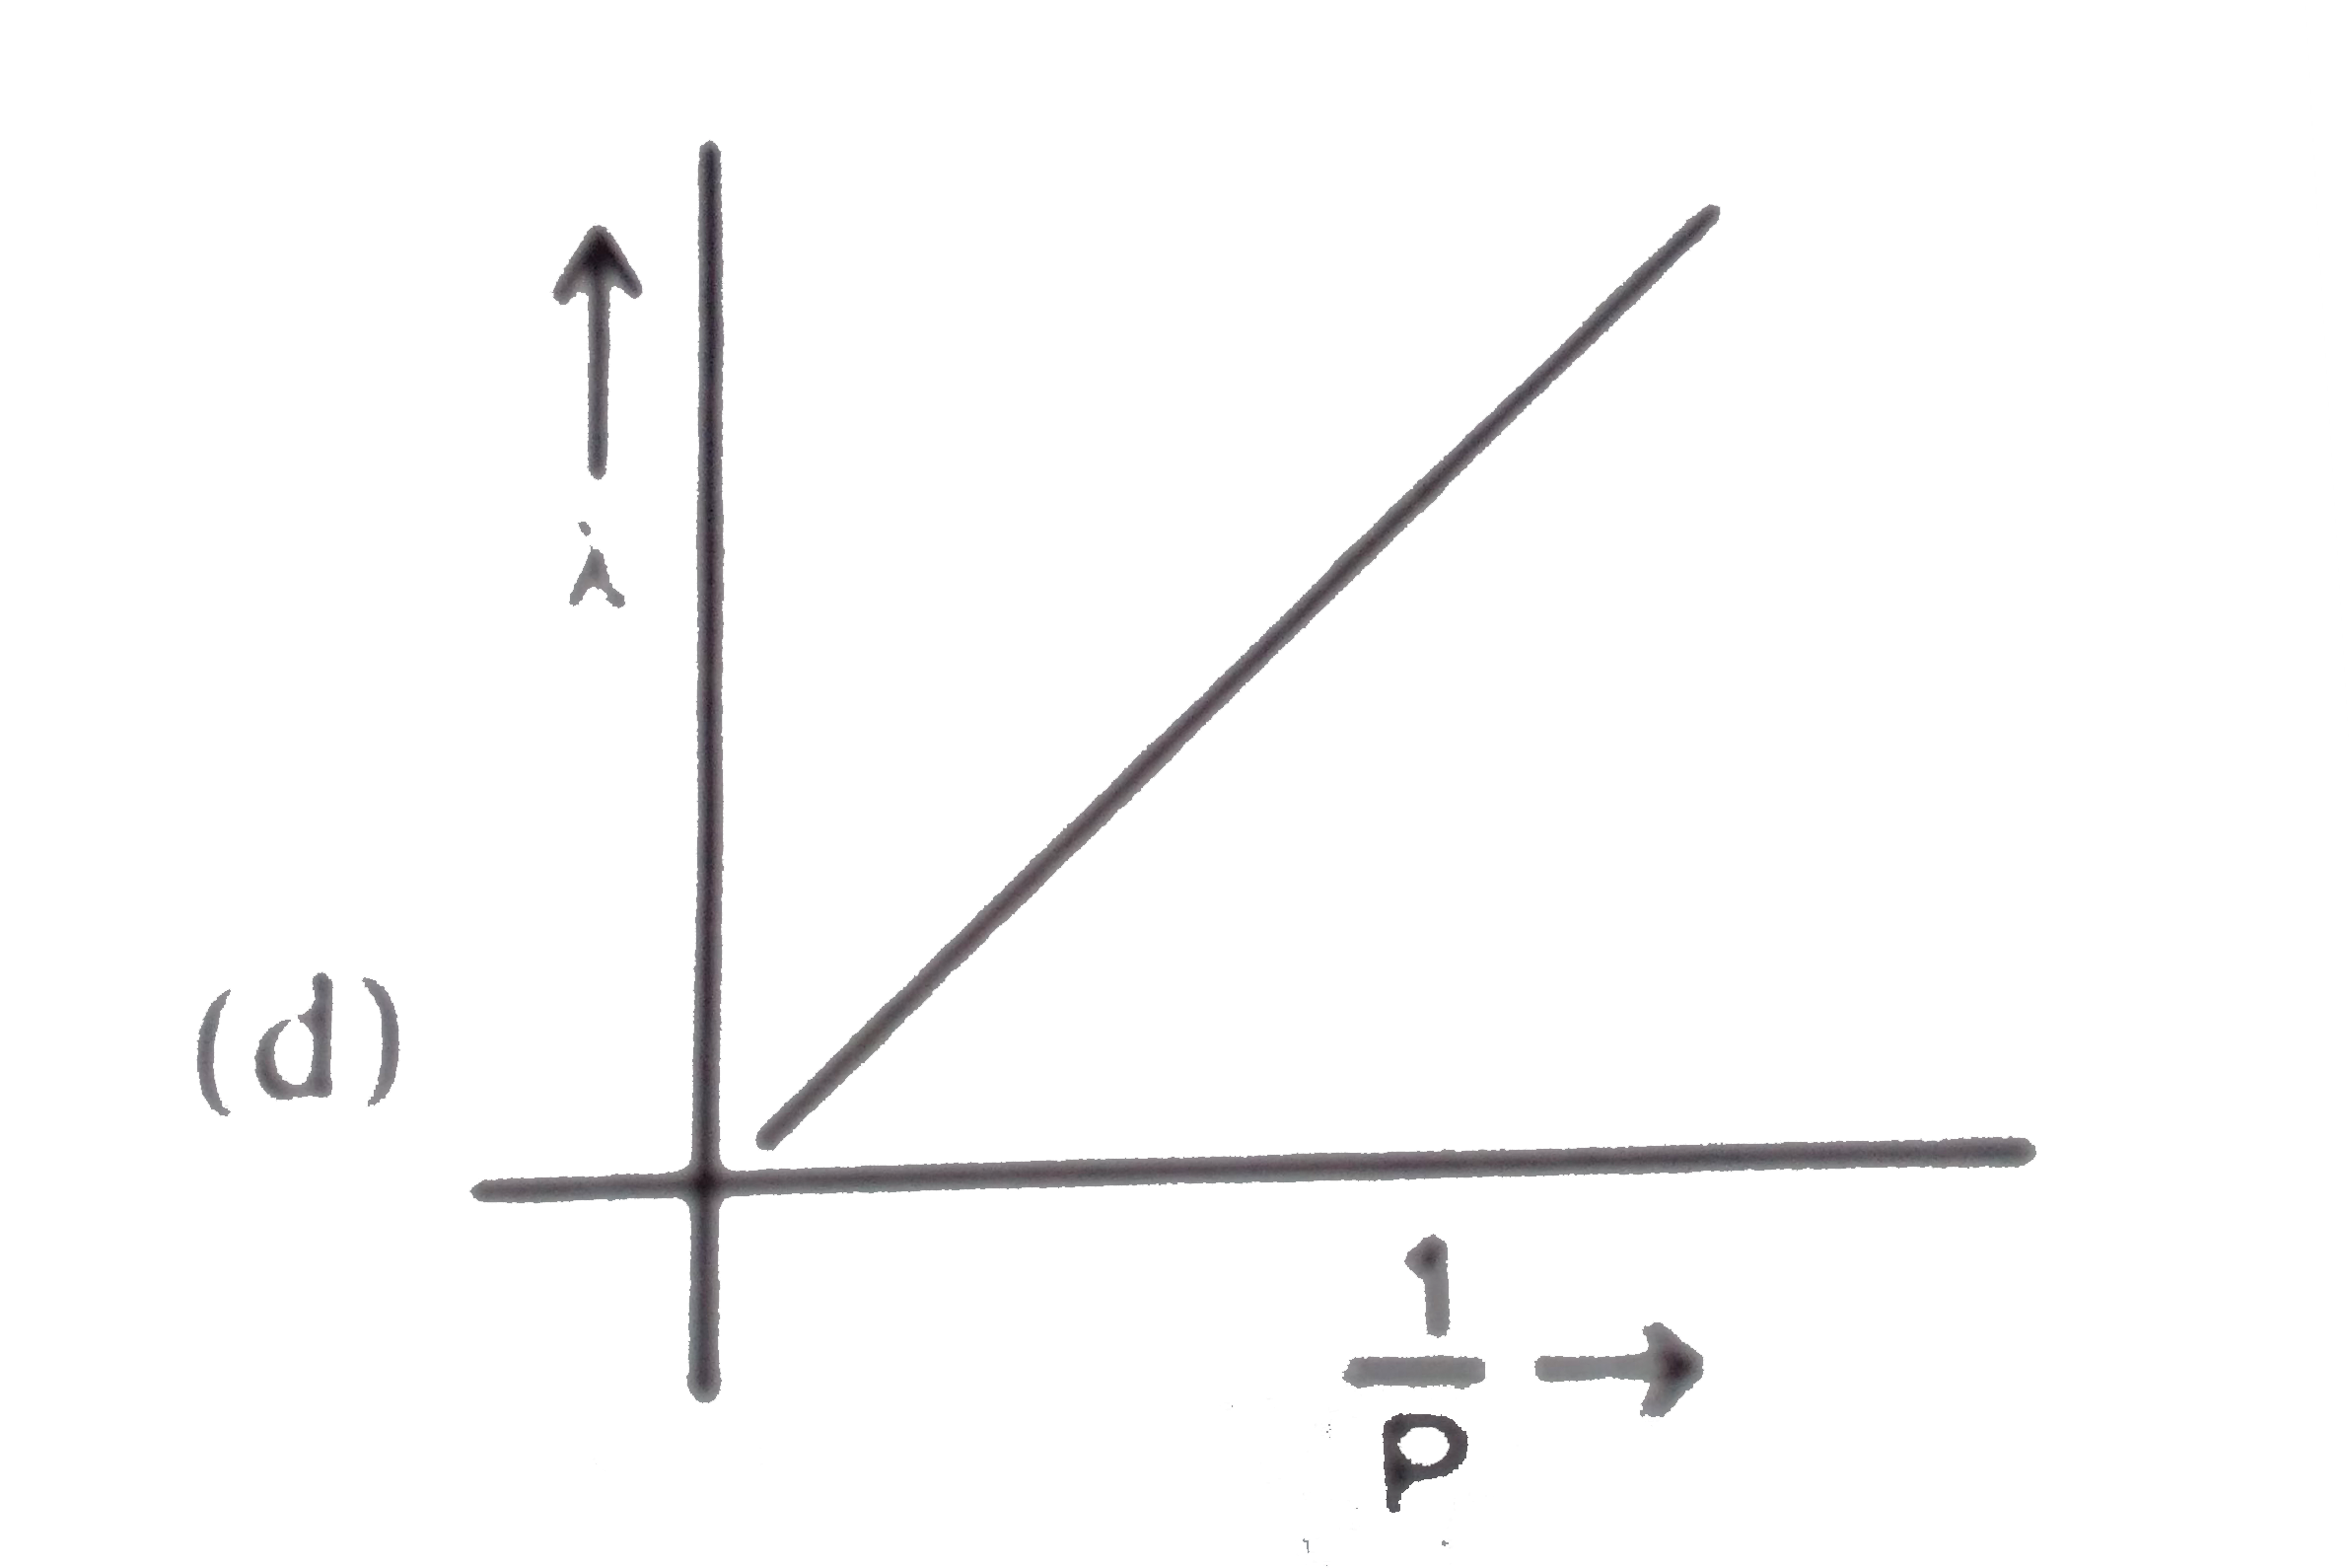
Which of following graphs correctly represents the variation of particle momentum with de-Broglie wavelength?Solution in Punjabi


Step by step video & image solution for Which of following graphs correctly represents the variation of particle momentum with de-Broglie wavelength? by Chemistry experts to help you in doubts & scoring excellent marks in Class 11 exams.
Updated on:21/07/2023Topper's Solved these Questions
Similar Questions
Which hybrid orbital is used by carbon atoms in the following molecules? CH3-CH3
View SolutionA small piece of mass m moves in such a way the P.E. =−12mkr2. Where k is a constant and r is the distance of the particle from origin. Assuming Bohr's model of quantization of angular momentum and circular orbit, r is directly proportional to :
View SolutionCalculate ΔrG for the reaction at 27∘C
H2(g)+2Ag+(aq)⇔2Ag(s)+2H+(aq)
Given : PH2=0.5 bar, [Ag+]=10−5M,
[H+]=10−3M,ΔrG∘[Ag+(aq)]=77.1kJ/mol
View SolutionWhich of the following graphs correctly represents the variation of particle momentum with associated de Broglie wavelength?
View SolutionWhich of the following figure represents the variation of particle momentum and the associated de - Broglie wavelength ?
View SolutionWhich of following graphs correctly represents the variation of particle momentum with de-Broglie wavelength?
View SolutionWhich of the following figures represent the variation of particle momentum and the associated de Broglie wavelength?
View SolutionRepresent graphically Variation of the de-Broglie wavelenght with linear momentum of a particle.
View SolutionThe graph showing the correct variation of linear momentum (p) of a charge particle with its de-Broglie wavelength (λ) is
View SolutionDraw a graph showing variation of de-Broglie wavelength with the momentum of an electron.
View SolutionWhich of the following graph represent the variation of particle momentum and associated de Broglie wavelength?
View SolutionWhich of following graphs correctly represents the variation of particle momentum with de-Broglie wavelength?
View SolutionWhich of the following figures represents the variation of particle momentum and associated de-Broglie wavelength
View SolutionWhich of the following figure represents the variation of particle momentum and the associated de - Broglie wavelength ?
View SolutionWhich of the following graph represent the variation of particle momentem and the associated de Broglie wavelength
View Solution
