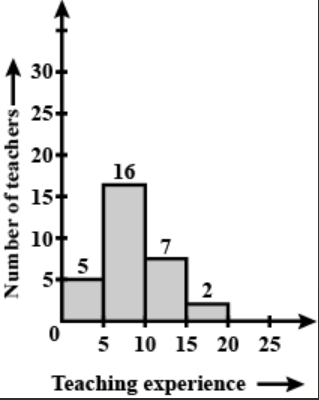
The following histogram shows the frequency distribution of teaching experiences of 30 teachers in various schools:
What is the class width?

Step by step video & image solution for The following histogram shows the frequency distribution of teaching experiences of 30 teachers in various schools: What is the class width? by Maths experts to help you in doubts & scoring excellent marks in Class 8 exams.
Updated on:21/07/2023Topper's Solved these Questions
- DATA HANDLINGBOOK - NCERT EXEMPLARCHAPTER - DATA HANDLINGEXERCISE - EXERCISE (True or False)
23 Videos
- COMPARING QUANTITIESBOOK - NCERT EXEMPLARCHAPTER - COMPARING QUANTITIESEXERCISE - Think and Discuss
2 Videos
- DIRECT AND INVERSE PROPORTIONS BOOK - NCERT EXEMPLARCHAPTER - DIRECT AND INVERSE PROPORTIONS EXERCISE - THINK AND DISCUSS
2 Videos
Similar Questions
The following histogram shows the frequency distribution of teaching experiences of 30 teachers in various schools:
How many teachers have teaching experience of 10 to 20 years?

View SolutionThe following histogram shows the frequency distribution of teaching experiences of 30 teachers in various schools:
How many teachers are having the maximum teaching experience and how many have the least teaching experience?

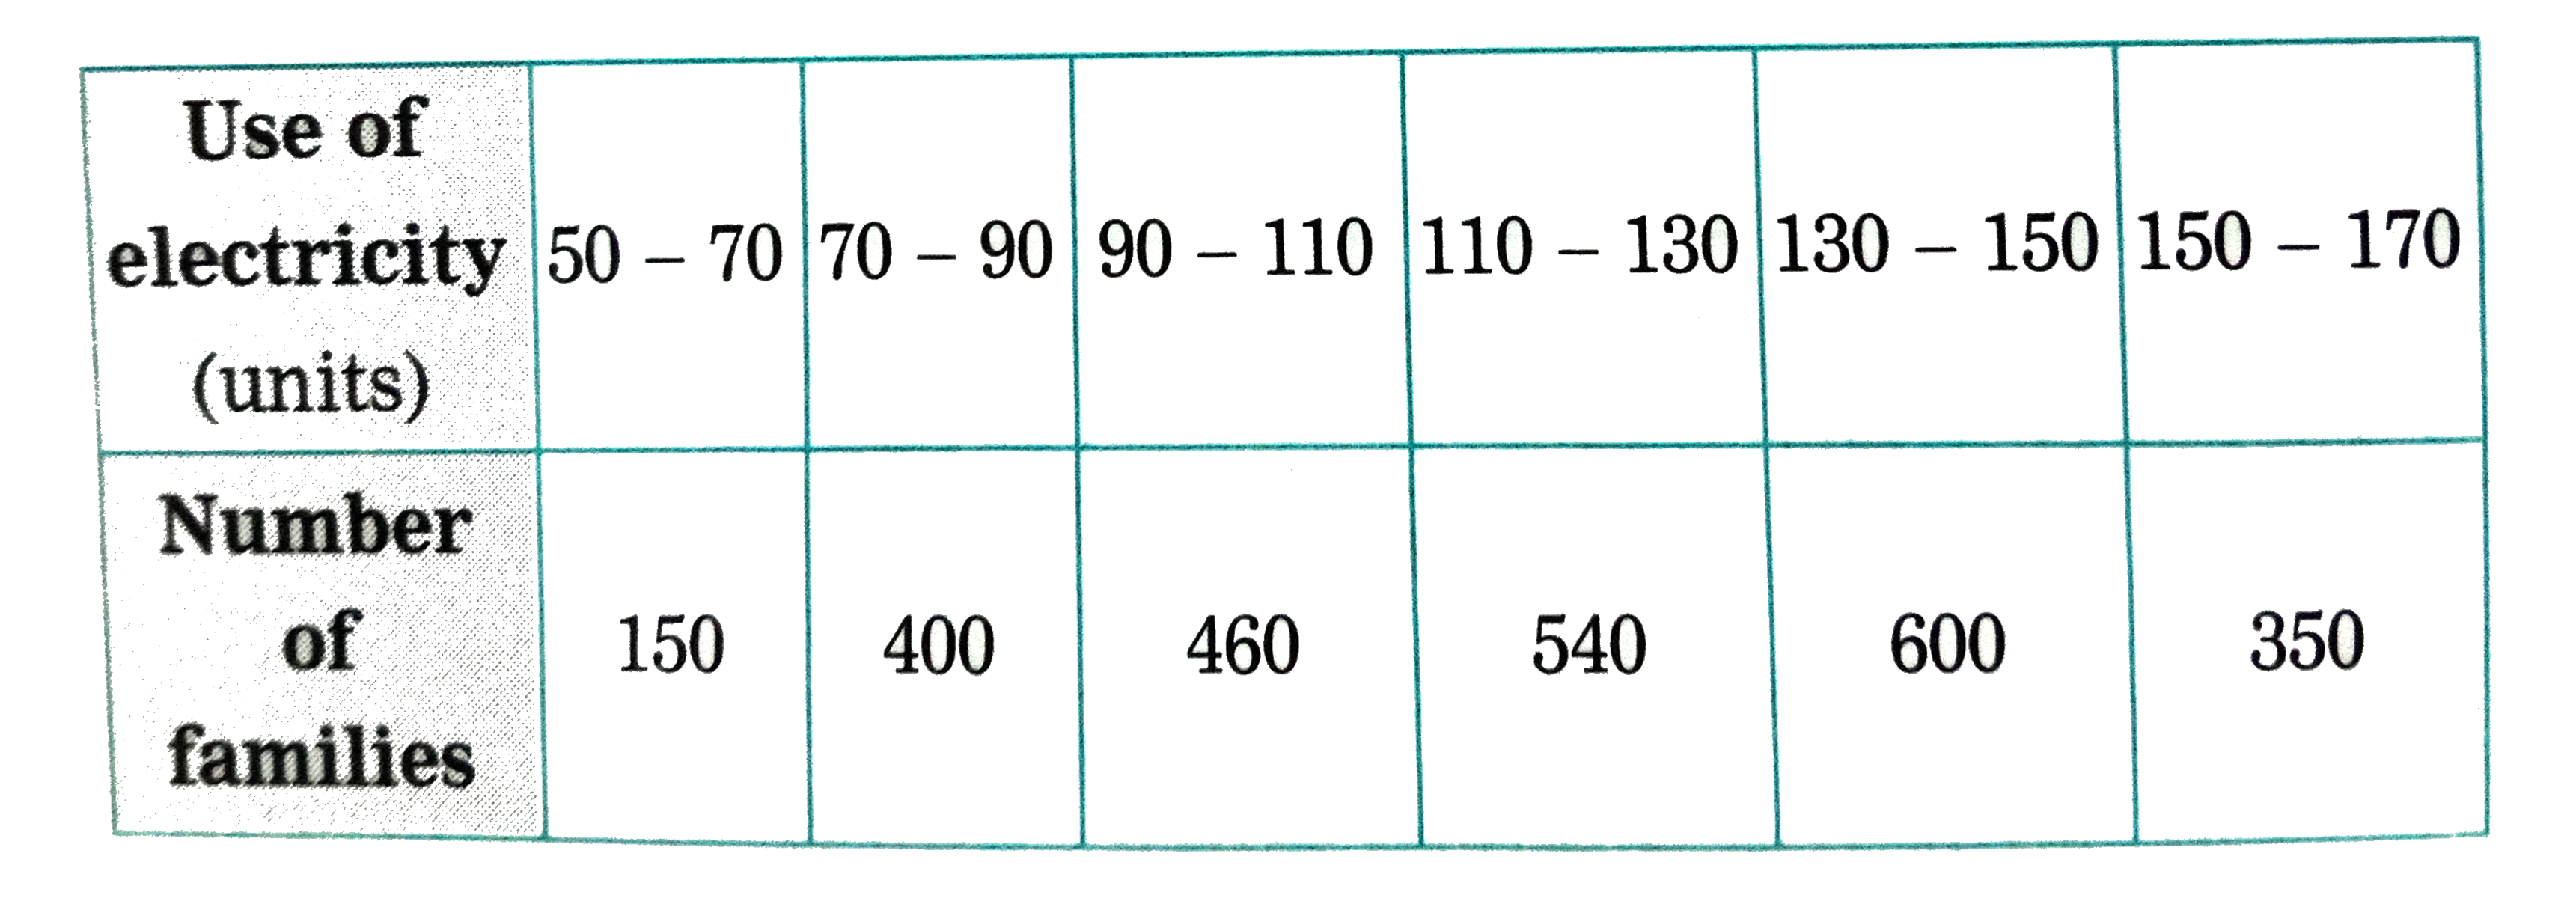
View SolutionDraw a histogram for the frequency distribution of the following data:

View SolutionDraw a histogram for the frequency distribution of the following data:

View SolutionDraw a histogram for the following frequency distribution.

View SolutionDraw the Histogram for the following frequency distribution.

View SolutionDraw the histogram for the following frequency distribution :

View SolutionConstruct a histogram for the following frequency distribution :

View SolutionDepict the following frequency distribution by a histogram.

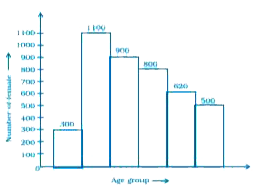
View SolutionThe below histogram shows the number of literate females in the age group of 10 to 40 years in a town.

What is the classes width?
View Solution
