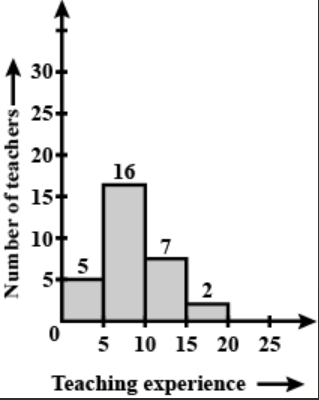
The following histogram shows the frequency distribution of teaching experiences of 30 teachers in various schools:
How many teachers are having the maximum teaching experience and how many have the least teaching experience?

Step by step video & image solution for The following histogram shows the frequency distribution of teaching experiences of 30 teachers in various schools: How many teachers are having the maximum teaching experience and how many have the least teaching experience? by Maths experts to help you in doubts & scoring excellent marks in Class 8 exams.
Updated on:21/07/2023Topper's Solved these Questions
- DATA HANDLINGBOOK - NCERT EXEMPLARCHAPTER - DATA HANDLINGEXERCISE - EXERCISE (True or False)
23 Videos
- COMPARING QUANTITIESBOOK - NCERT EXEMPLARCHAPTER - COMPARING QUANTITIESEXERCISE - Think and Discuss
2 Videos
- DIRECT AND INVERSE PROPORTIONS BOOK - NCERT EXEMPLARCHAPTER - DIRECT AND INVERSE PROPORTIONS EXERCISE - THINK AND DISCUSS
2 Videos
Similar Questions
The following histogram shows the frequency distribution of teaching experiences of 30 teachers in various schools:
How many teachers have teaching experience of 10 to 20 years?

View SolutionThe following histogram shows the frequency distribution of teaching experiences of 30 teachers in various schools:
What is the class width?

View Solution
Knowledge Check
How many phases are involved in the teaching of english
A2B3C4D5How many classes a frequency distribution should have?
ALarge numberBSmall numberCNeither very large nor very small numberDNot more than 10.Teaching science classified into how many types
A2B3C4D5
Teaching science classified into how many types
View SolutionThe rules for effective teaching made from experiences of teachers and thinkers are called
View SolutionHow can a teacher help students to generalise mathematical experiences ?
View SolutionIn a school, the distribution of teachers is as follows:

The total number of teaches of age less than 40 years is:
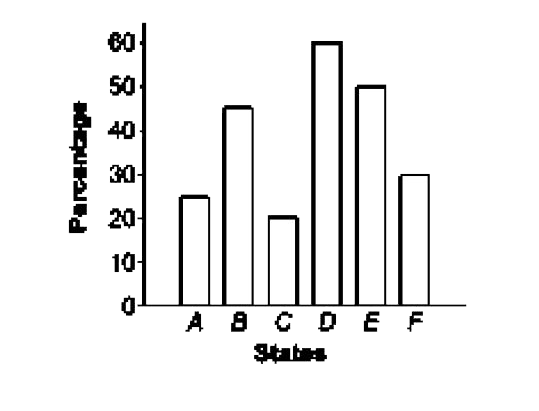
View SolutionHow many State have at least 50% electrified villages?

View Solution
