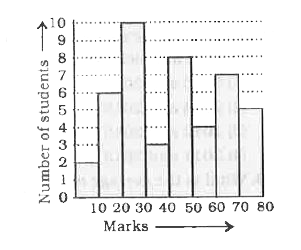
The following histogram shows the frequency distribution of teaching experiences of 30 teachers in various schools:
How many teachers have teaching experience of 10 to 20 years?
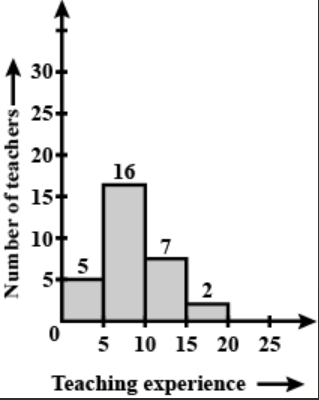
Step by step video & image solution for The following histogram shows the frequency distribution of teaching experiences of 30 teachers in various schools: How many teachers have teaching experience of 10 to 20 years? by Maths experts to help you in doubts & scoring excellent marks in Class 8 exams.
Updated on:21/07/2023Topper's Solved these Questions
- DATA HANDLINGBOOK - NCERT EXEMPLARCHAPTER - DATA HANDLINGEXERCISE - EXERCISE (True or False)
23 Videos
- COMPARING QUANTITIESBOOK - NCERT EXEMPLARCHAPTER - COMPARING QUANTITIESEXERCISE - Think and Discuss
2 Videos
- DIRECT AND INVERSE PROPORTIONS BOOK - NCERT EXEMPLARCHAPTER - DIRECT AND INVERSE PROPORTIONS EXERCISE - THINK AND DISCUSS
2 Videos
Similar Questions
The following histogram shows the frequency distribution of teaching experiences of 30 teachers in various schools:
How many teachers are having the maximum teaching experience and how many have the least teaching experience?

View SolutionThe following histogram shows the frequency distribution of teaching experiences of 30 teachers in various schools:
What is the class width?

View Solution
Knowledge Check
The rules for effective teaching made from experiences of teachers and thinkers are called
AMethod of teachingBMaxims of teachingCTechniques of teachingDTeaching strategiesThe following questions depends on the table given below-
Distribution of malnutrition in children in percentage in various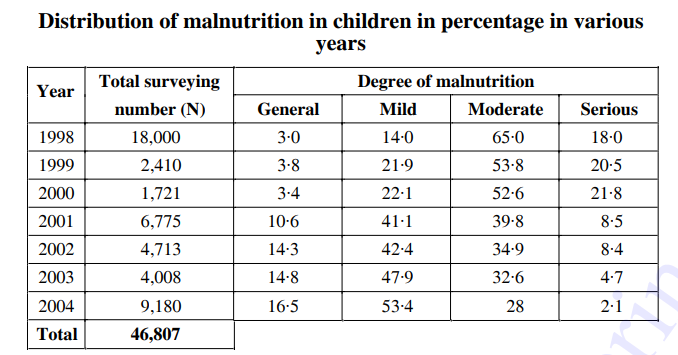
How many were normal in the number of the surveying in all the years?A4439B7723C2681D4192In a school, the distribution of teachers is as follows:

The total number of teaches of age less than 40 years is:A10B12C39D18
The given histogram represents the frequency distribution of average runs scored by 50 selected players from a district in a local cricket tournament
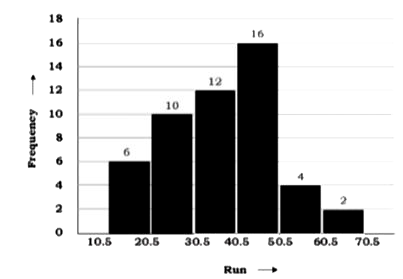
How many players scored more than 30.5 on average
View SolutionThe pie chart shows percentage wise distribution of teachers who teach six different subjects. Study the pie chart and answer the question.
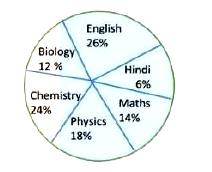
Total number of teachers = 1650
What is the difference between the total number of teachers who teach Physics and Maths and the total number of teachers who teach chemistry and biology?
View SolutionThe histogram shows the marks obtained by 45 students of a class. Look at the histogram and answer the questions.
How many students have obtained marks less than 10 ?
View SolutionThe following questions depends on the table given below-
Distribution of malnutrition in children in percentage in various
How many percent approximately was mild malnutrition in all the years together?
View SolutionIn how many ways 6 students and 4 teachers be arraged in a row so that no two teaches are together ?
View Solution
