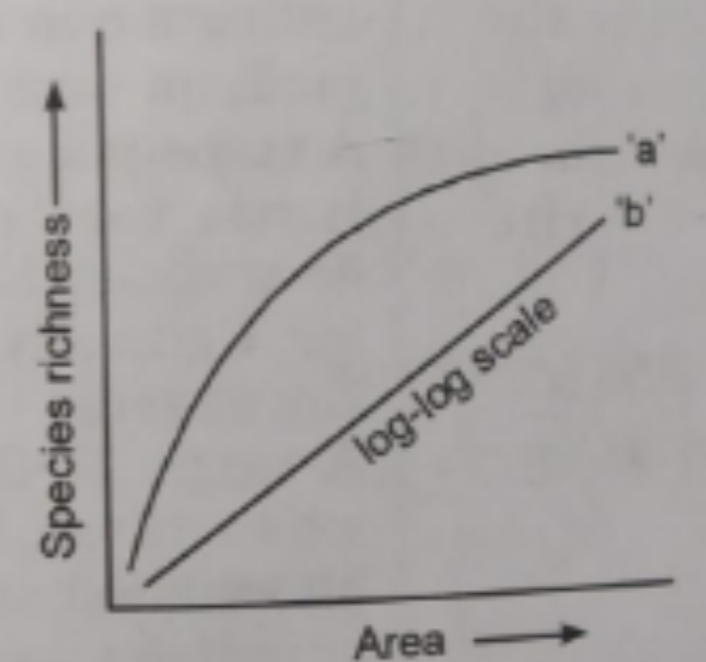
The following graph shows the species area relationship. Answer the following questions as directed.
When would the slpe of the line 'b' become steeper?
 Solution in Punjabi
Step by step video & image solution for The following graph shows the species area relationship. Answer the following questions as directed. When would the slpe of the line 'b' become steeper? by Biology experts to help you in doubts & scoring excellent marks in Class 12 exams.
Updated on:21/07/2023Topper's Solved these Questions
Similar Questions
What is common to the techniques (i) in-vitro fertilisation, (ii) Cryopreservation and (iii) tissue culture?
View SolutionADA is an enzyme which is deficient in a genetic disorder SCID. What is the full of ADA?
View SolutionA species area curve is drawn by plotting the number of species against the area. How is it that when a very large area is considered the slope is steeper than that for smaller areas ?
View SolutionThe following graph shows the species area relationship. Answers the Questions as directed. (a) Name the naturalist who studied the kind of relationship shown in the graph. Write the observations made by him. (b) Write the situations as discovered by the ecologists when the value of 'Z' (slope of the line) lies between (i) 0.1 and 0.2, (ii) 0.6 and 1.2 What does 'Z' stand for ? (c ) When would the slope of the line 'b' become steeper ?
View SolutionThe given graph shows species-area relationship. Write the equation of the curve 'a' and explain.
View SolutionThe above graph show Species-Area relationship. Write the equation of the curve a and explain.
View SolutionIf we analyse the species-area relationships among very large areas like the entire continents, then slope of line becomes much steeper in the range of
View SolutionA species area curve is drawn by plotting the number of species against the area. How is it that when a very large area is considered the slope is steeper than that for smaller areas ?
View SolutionThe following graph shows the species area relationship. Answers the Questions as directed.
(a) Name the naturalist who studied the kind of relationship shown in the graph.
Write the observations made by him.
(b) Write the situations as discovered by the ecologists when the value of 'Z' (slope of the line) lies between
(i) 0.1 and 0.2, (ii) 0.6 and 1.2
What does 'Z' stand for ?
(c ) When would the slope of the line 'b' become steeper ?
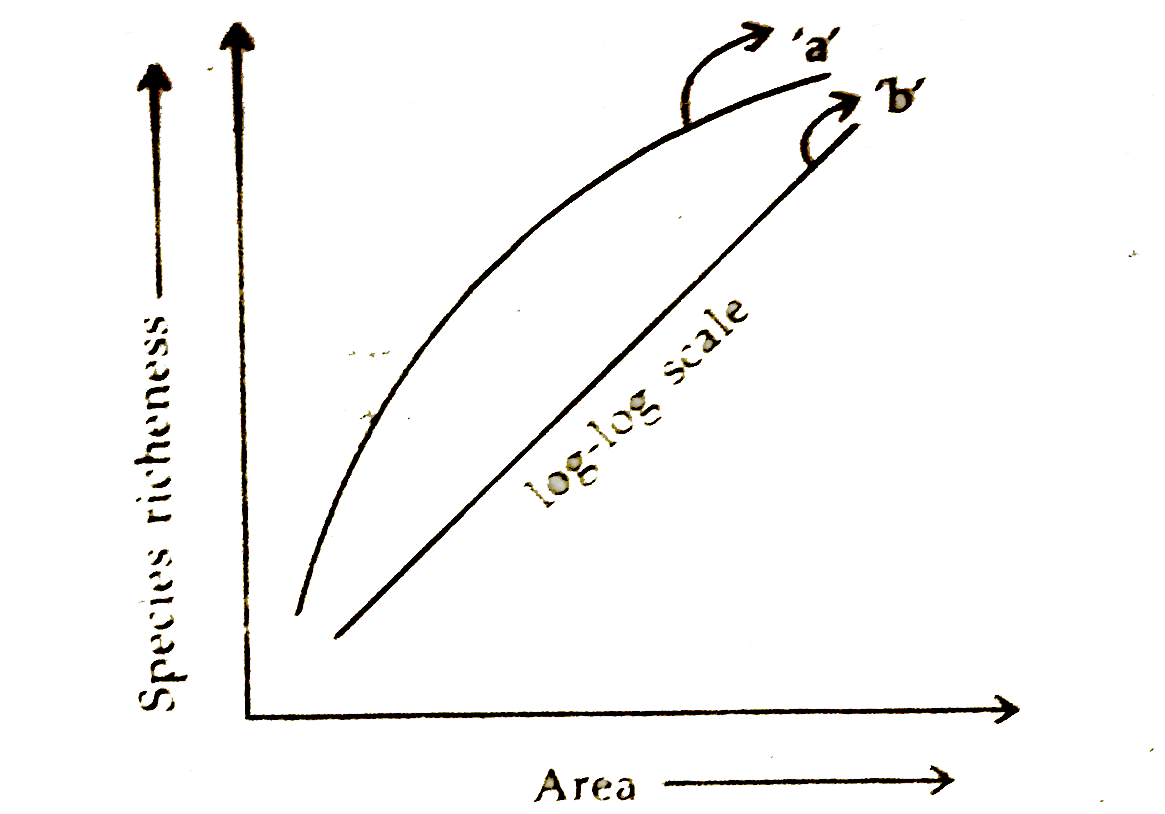

View SolutionThe above graph show Species-Area relationship. Write the equation of the curve a and explain.
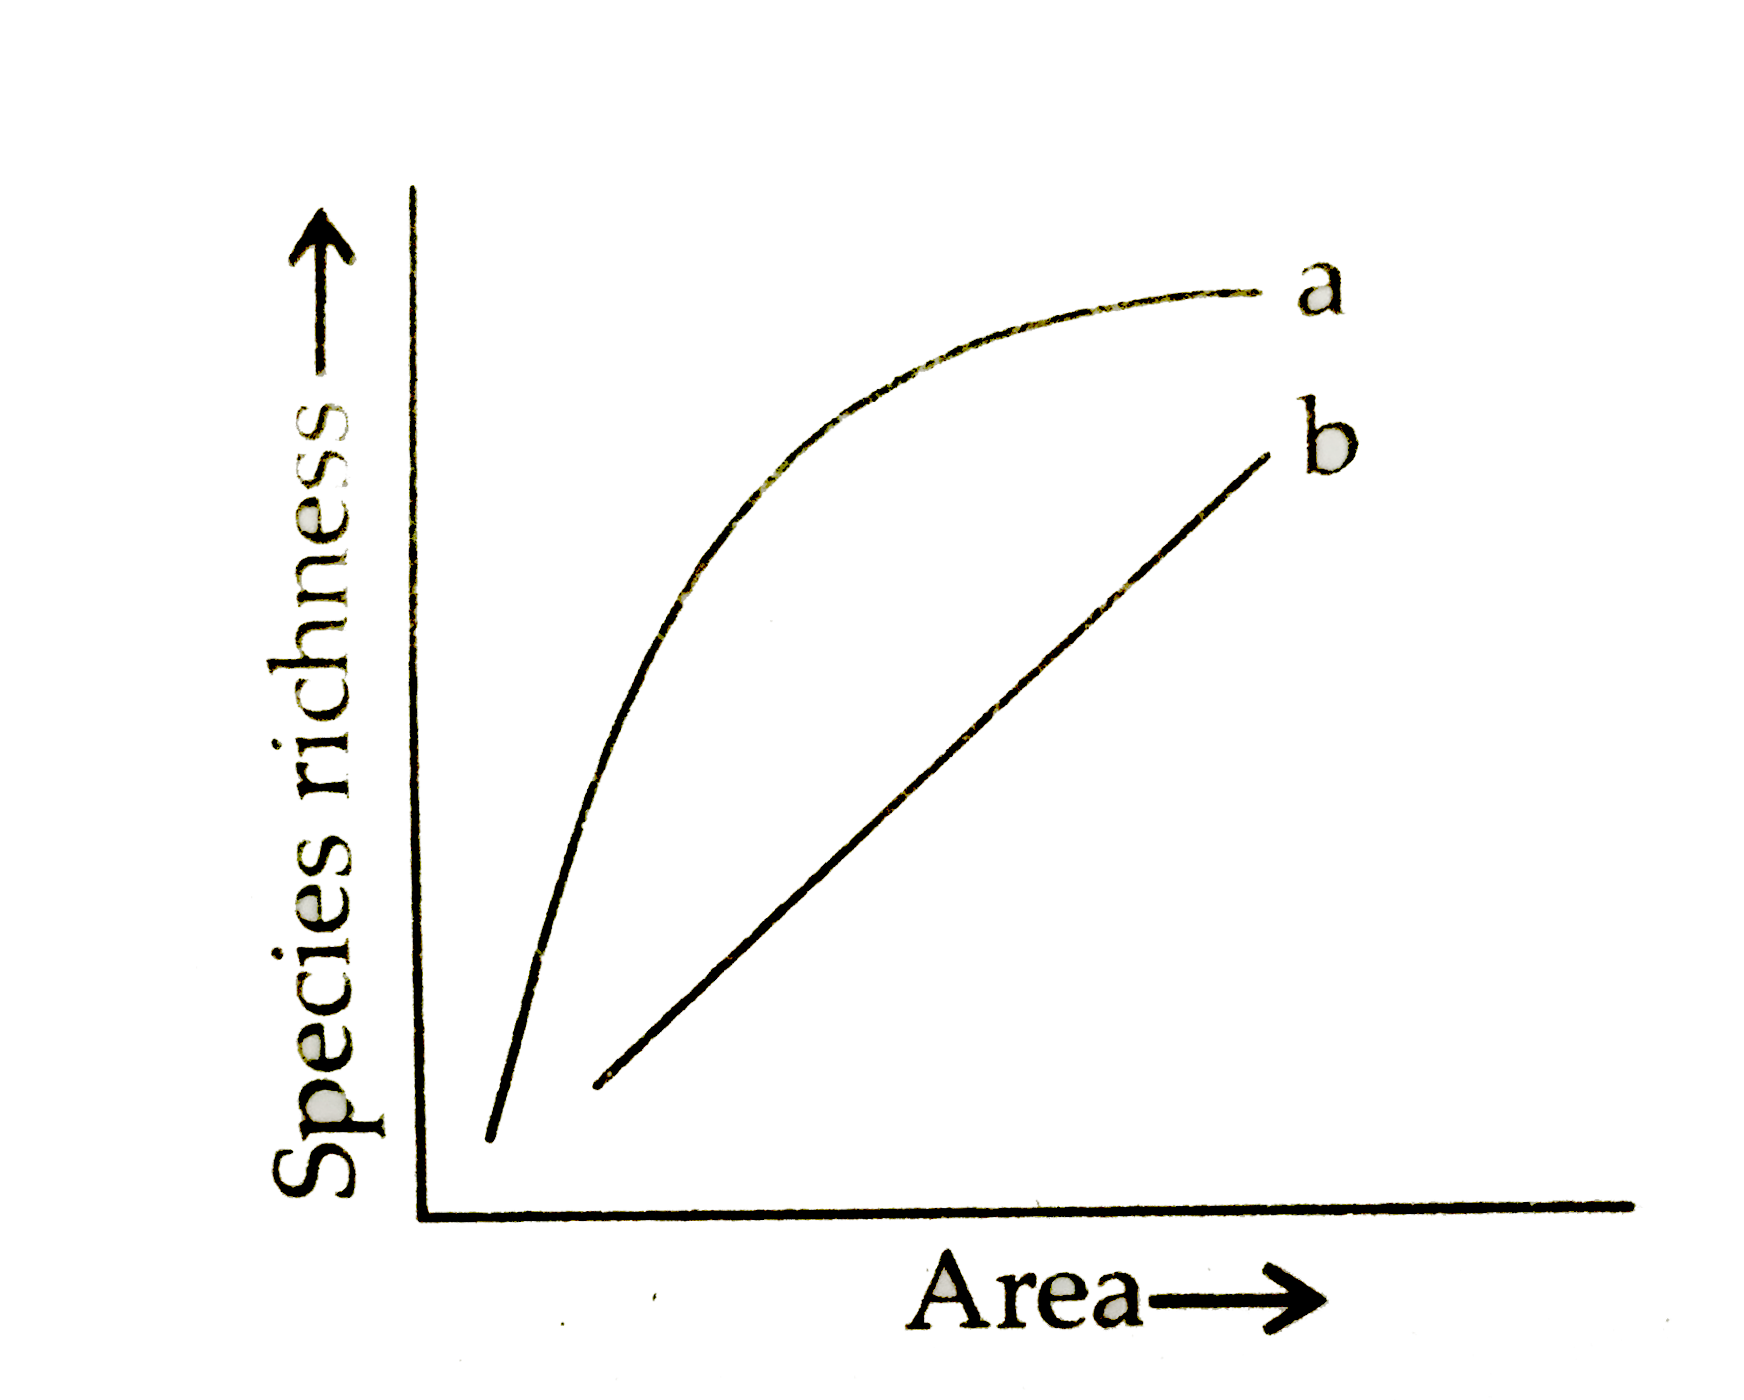
View SolutionA species-area curve is drawn by plotting the number of species against the area. How is it that when a very large area is considered the slope is steeper than that for smaller areas ?
View SolutionThe graph shows species area relationship. If b denotes the relationship on log scale. Describe a and b .
View SolutionThe graph shows species area relationship. If b denotes the relationship on log scale. How is slope represented?Give the normal range of slope.
View SolutionThe graph shows species area relationship.
If b denotes the relationship on log scale.
What kind of slope will be observed for frugivorous birds and mammals in a tropical forest?
View SolutionStudy the figures (A) and (B) given below and answer the questions that follow:
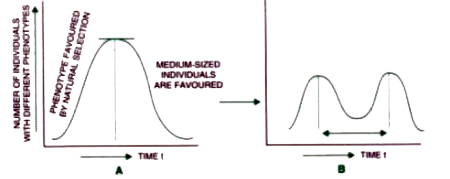
Under the influence of which type of Natural Selection would graph (A) become like graph (B)?
View Solution
