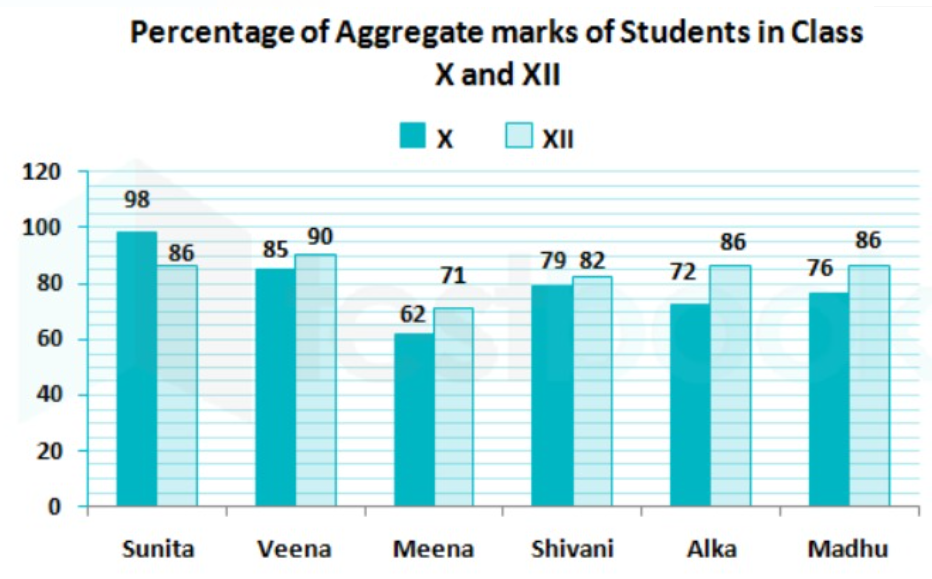
The following graph shows the performance in aggregate marks of 2 board examinations of a group of friends. On the basis of the graph, identify the girl who has shown the maximum improvement from class X to class XII.
निम्नलिखित आरेख मित्रों के एक समूह को दो बोर्ड परीक्षाओं में मिले कुल अंकों के प्रदर्शन को दर्शाता है। इस आरेख के आधार पर, उस लड़की की पहचान कीजिए, जिसने कक्षा X से XII में सबसे अधिक सुधार दर्ज की है ?

Madhu / मधु
Alka / अलका
Veena / वीणा
Meena/ मीना
Step by step video & image solution for The following graph shows the performance in aggregate marks of 2 board examinations of a group of friends. On the basis of the graph, identify the girl who has shown the maximum improvement from class X to class XII. निम्नलिखित आरेख मित्रों के एक समूह को दो बोर्ड परीक्षाओं में मिले कुल अंकों के प्रदर्शन को दर्शाता है। इस आरेख के आधार पर, उस लड़की की पहचान कीजिए, जिसने कक्षा X से XII में सबसे अधिक सुधार दर्ज की है ? by Maths experts to help you in doubts & scoring excellent marks in Class 14 exams.
Updated on:21/07/2023Topper's Solved these Questions
Similar Questions
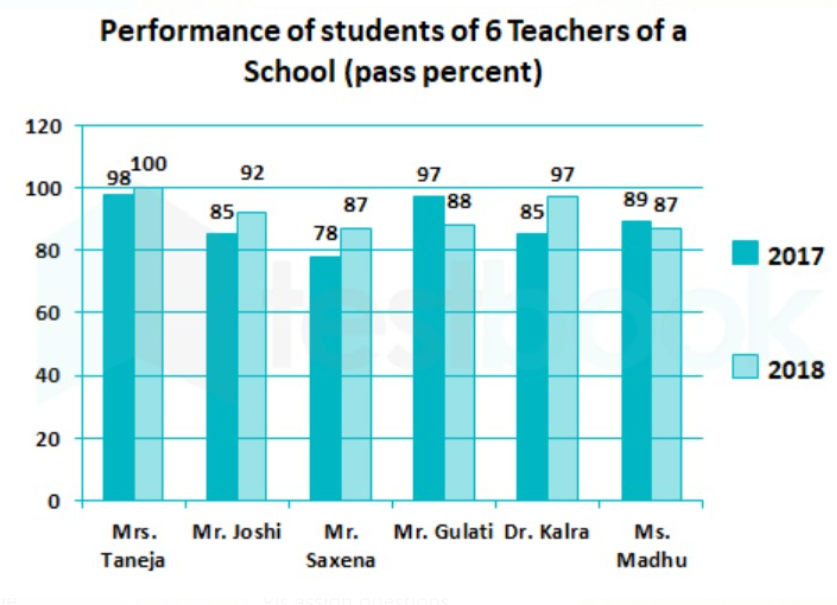
The given graph shows the pass percentage of students taught by six teachers of a school in the Senior Secondary Board exam. Identify the teacher whose students have shown the maximum improvement.
दिया गया आरेख छः शिक्षकों के द्वारा पढ़ाये गए छात्रों की उच्च माध्यमिक बोर्ड परीक्षा में उत्तीर्णता प्रतिशत को दर्शाता है।

उस शिक्षक की पहचान कीजिए, जिसके छात्रों में सर्वाधिक सुधार देखने को मिला है ?
View Solutionनिम्नलिखित प्रश्नों के उत्तर एक-दो पंक्तियों में दीजिए
जापान में चाय पीने की विधि को क्या कहते हैं?
View Solution
Knowledge Check
निम्नलिखित में से कौन सी नाम अभिक्रिया एक -COOH समूह को निरूपित करने के लिए उपयोग नहीं की जाती है?
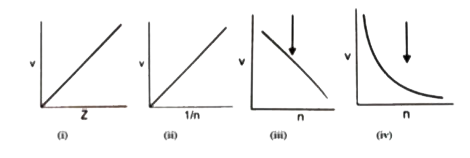
Aकैनिजारो अभिक्रियाBबेंजिलिक अम्ल पुनर्विन्यासCआयोडोफार्म अभिक्रियाDइनमें से कोई नहींनिम्नलिखित में से कौन सा आरेख एक कक्षा में e− के वेग के विरूद्ध Z,1n और n के लिए सही है?
 A(i), (ii)B(ii), (iv)C(i), (ii), (iii)D(i),(ii),(iv)
The following graph shows the sales of cars (in thousands) in four cities in 4 years. Study the graph and answer the questions.
निम्नलिखित आरेख 4 वर्षों में चार शहरों में कारों की बिक्री (हज़ार में) को दर्शाता है। इस आरेख का अध्ययन कीजिए तथा प्रश्नों के उत्तर दीजिए। Which city has the highest percentage of sales, and in which year?
किस शहर की बिक्री का प्रतिशत सबसे अधिक है तथा किस वर्ष में?
View SolutionThe following bar graph shows the number of deaths from road accident occurred during the rainy season in the year 1992. Study the graph carefully and answer the question that follows.
निम्नलिखित दंड आरेख वर्ष 1992 में बारिश के मौसम में हुई सड़क दुर्घटना से होने वाली मौतों की संख्या को दर्शाता है। आरेख का ध्यानपूर्वक अध्ययन करें और प्रश्न का उत्तर दें।
Between which two consecutive weeks was the fall in the number of deaths the greatest?
लगातार किन दो सप्ताहों के बीच मौत की संख्या में गिरावट सबसे बड़ी थी?
View Solutionपठित दोहों के आधार पर कबीर के विचारों को स्पष्ट कीजिए।
View SolutionThe following graph shows the sales of cars (in thousands) in four cities in 4 years. Study the graph and answer the questions.
निम्नलिखित आरेख 4 वर्षों में चार शहरों में कारों की बिक्री (हज़ार में) को दर्शाता है। इस आरेख का अध्ययन कीजिए तथा प्रश्नों के उत्तर दीजिए। Which city has the highest sales?
किस शहर की बिक्री सबसे अधिक है?
View SolutionThe following graph shows the sales of cars (in thousands) in four cities in 4 years. Study the graph and answer the questions.
निम्नलिखित आरेख 4 वर्षों में चार शहरों में कारों की बिक्री (हज़ार में) को दर्शाता है। इस आरेख का अध्ययन कीजिए तथा प्रश्नों के उत्तर दीजिए। In which year, the sales are highest?
किस वर्ष, बिक्री सबसे अधिक हुई है?
View SolutionThe Venn diagram given in the question represents the relationship between the items given in which of the following options.
प्रश्न में दिया गया वेन आरेख निम्नलिखित में से किस विकल्प में दी गई वस्तुओं के बीच के संबंध को दर्शाता है।
View Solution
