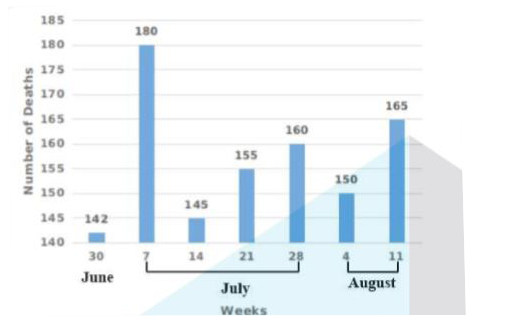
The following bar graph shows the number of deaths from road accident occurred during the rainy season in the year 1992. Study the graph carefully and answer the question that follows.
निम्नलिखित दंड आरेख वर्ष 1992 में बारिश के मौसम में हुई सड़क दुर्घटना से होने वाली मौतों की संख्या को दर्शाता है। आरेख का ध्यानपूर्वक अध्ययन करें और प्रश्न का उत्तर दें।

Between which two consecutive weeks was the fall in the number of deaths the greatest?
लगातार किन दो सप्ताहों के बीच मौत की संख्या में गिरावट सबसे बड़ी थी?
7 July to 14 July/ 7 जुलाई से 14 जुलाई
28 July to 4 August/ 28 जुलाई से 4 अगस्त
30 June to 7 July/ 30 जून से 7 जुलाई
21 July to 28 July/ 21 जुलाई से 28 जुलाई
Step by step video & image solution for The following bar graph shows the number of deaths from road accident occurred during the rainy season in the year 1992. Study the graph carefully and answer the question that follows. निम्नलिखित दंड आरेख वर्ष 1992 में बारिश के मौसम में हुई सड़क दुर्घटना से होने वाली मौतों की संख्या को दर्शाता है। आरेख का ध्यानपूर्वक अध्ययन करें और प्रश्न का उत्तर दें। Between which two consecutive weeks was the fall in the number of deaths the greatest? लगातार किन दो सप्ताहों के बीच मौत की संख्या में गिरावट सबसे बड़ी थी? by Maths experts to help you in doubts & scoring excellent marks in Class 14 exams.
Updated on:21/07/2023Topper's Solved these Questions
Similar Questions
The following bar graph shows the number of deaths from road accidents occurred during the rainy season in the year 1992. Study the graph carefully and answer the question.

Between which two consecutive weeks was the rise in the number of deaths the greatest?
View SolutionThe following bar graph shows the number of deaths from road accidents occurred during the rainy season in the year 1992. Study the graph carefully and answer the question.

Between which two consecutive weeks was the fall in the number of deaths the greatest?
View SolutionThe given graph represents the rainfall (in cm) in a city, over a period of six years. Study the graph and answer the question that follows.
दिया गया आरेख एक शहर में छह साल में हुई वर्षा (सेमी में) को प्रदर्शित करता है। आरेख का अध्ययन करें और उस प्रश्न का उत्तर दें, जो पूछा गया है। In which two consecutive years was the difference of the rainfall minimum?
कौन से लगातार दो वर्षों में वर्षा का अंतर न्यूनतम था?
View SolutionThe given bar graph represents the number of students who appeared in the board examination in session 2017-18 and 2018-19. Study the graph and answer the question that follows.
दिया गया दंड आरेख सत्र 2017-18 और 2018-19 सत्र में बोर्ड परीक्षा में उपस्थित होने वाले छात्रों की संख्या को दर्शाता है। आरेख का अध्ययन करें और प्रश्न का उत्तर दें। The difference between the average number of students of Science and Humanities stream in 2017-18 and that in Commerce and Vocational in 2018-19 is:
2017-18 में विज्ञान और मानविकी विषय के छात्रों की औसत संख्या और 2018-19 में वाणिज्य और व्यावसायिक में छात्रों की औसत संख्या के बीच अंतर ज्ञात करे।
View SolutionThe following graph shows the number of boys and girls in class V, class VI, class VII and class VIII. Study the graph and answer the question.
निम्नलिखित आरेख कक्षा V, कक्षा VI, कक्षा VII और कक्षा VIII में लड़कों और लड़कियों की संख्या दर्शाता है। आरेख का अध्ययन करें और प्रश्न का उत्तर दें। Which class has the maximum number of students?
किस कक्षा में छात्रों की अधिकतम संख्या है?
View SolutionThe following graph shows the number of boys and girls in class V, class VI, class VII and class VIII. Study the graph and answer the question.
निम्नलिखित आरेख कक्षा V, कक्षा VI, कक्षा VII और कक्षा VIII में लड़कों और लड़कियों की संख्या दर्शाता है। आरेख का अध्ययन करें और प्रश्न का उत्तर दें। In which class, the percentage increase in the number of boys as compared to its previous class is least?
किस कक्षा में लड़कों की संख्या में पिछले कक्षा की तुलना में प्रतिशत की वृद्धि सबसे कम है?
View SolutionThe following graph shows the number of books sold by a book-seller during five-months of 2019, April, May, June, July and August. Study the graph and answer the questions:
निम्नलिखित आरेख, 2019 के अप्रैल, मई, जून, जुलाई और अगस्त के पांच महीनों के दौरान एक पुस्तक-विक्रेता द्वारा बेची गई पुस्तकों की संख्या को दर्शाता है। आरेख का अध्ययन करें और प्रश्नों के उत्तर दें: The total number of books sold during these five month is:
इन पाँच महीनों के दौरान बेची गई पुस्तकों की कुल संख्या है:
View SolutionThe following graph given the annual percent profit earned by a company during the period 1996-2001. Study the graph carefully and answer the questions that follow. %profit=Income−ExpenditureExpenditure×100 निम्नलिखित आरेख 1996-2001 की अवधि के दौरान एक कंपनी के द्वारा अर्जित लाभ का वार्षिक प्रतिशत दर्शाता है। इस आरेख का ध्यानपूर्वक अध्ययन कीजिए और इसके बाद पूछे गए प्रश्नों का उत्तर दीजिए।
 The period in which the profit of the company has increased fastest is:
वह अवधि जिसमें कंपनी का लाभ सबसे तेज़ी से बढ़ा है:
View SolutionThe following graph shows the number of boys and girls in class V, class VI, class VII and class VIII. Study the graph and answer the question.
निम्नलिखित आरेख कक्षा V, कक्षा VI, कक्षा VII और कक्षा VIII में लड़कों और लड़कियों की संख्या दर्शाता है। आरेख का अध्ययन करें और प्रश्न का उत्तर दें। What is the average number of girls in all the classes?
सभी कक्षाओं में लड़कियों की औसत संख्या क्या है?
View SolutionThe following graph shows the sales of cars (in thousands) in four cities in 4 years. Study the graph and answer the questions.
निम्नलिखित आरेख 4 वर्षों में चार शहरों में कारों की बिक्री (हज़ार में) को दर्शाता है। इस आरेख का अध्ययन कीजिए तथा प्रश्नों के उत्तर दीजिए। In which year, the sales are highest?
किस वर्ष, बिक्री सबसे अधिक हुई है?
View Solution
