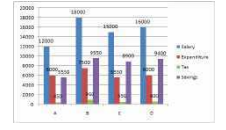
The graph represents the salary, expenditure, tax and savings (in rupees) per month of the persons A, B, C and D.
Study the graph and answer the question.
The expenditure as a percentage of salary is the least for:
उपरोक्त आरेख व्यक्ति A, B, C और D के प्रतिमाह वेतन, व्यय, कर तथा बचत ( रुपये में) को दर्शाता है। इस आरेख का अध्ययन करें तथा प्रश्न का उत्तर दें।
वेतन(Salary) के प्रतिशत के रूप में सबसे कम व्यय(Expenditure) किसका है?
C
A
B
D
Step by step video & image solution for The graph represents the salary, expenditure, tax and savings (in rupees) per month of the persons A, B, C and D. Study the graph and answer the question. The expenditure as a percentage of salary is the least for: उपरोक्त आरेख व्यक्ति A, B, C और D के प्रतिमाह वेतन, व्यय, कर तथा बचत ( रुपये में) को दर्शाता है। इस आरेख का अध्ययन करें तथा प्रश्न का उत्तर दें। वेतन(Salary) के प्रतिशत के रूप में सबसे कम व्यय(Expenditure) किसका है? by Maths experts to help you in doubts & scoring excellent marks in Class 14 exams.
Updated on:21/07/2023Topper's Solved these Questions
Similar Questions
The graphs of the equations 3x+y-5=0 and 2x-y-5=0 intersect at the point P(α,β). What is the value of (3α+β) ?
समीकरण 3x+y-5=0 तथा 2x-y-5=0 के आरेख एक बिंदु P(α,β) पर एक-दूसरे को काटते है (3α+β) का मान क्या है ?
View SolutionAfter giving two successive discounts, each of x%, on the marked price of an article, total discount is Rs. 259.20. If the marked price of the article is Rs. 720, then the value of x is :
View SolutionMatch the following Column A to Column B

View SolutionThe inequation represented by the graph given below is :
View SolutionThe inequation that best describes the graph given below is _________
View SolutionThe inequation that best describes the following graph is _________
View SolutionThe ratio of the sum of the salaries of A and B to the difference of their salaries is 11 : 1. The ratio of the sum of the salaries of B and C to the difference of their salaries is also 11 : 1. If A’s salary is the highest and C’s is the lowest then what is B’s salary (in Rs), given that the total of their salaries is Rs18,200?
A और B के वेतन के योग तथा उनके वेतन के अंतर में 11 : 1 का अनुपात है |B और C के वेतन के योग तथा उनके वेतन के अंतर में भी 11 : 1 का ही अनुपात है | यदि A का वेतन सर्वाधिक तथा C का वेतन सबसे कम है, तो B का वेतन ज्ञात करें जब यह दिया हुआ है कि उनके वेतनों का योग 18200 रुपये है |
View SolutionThe sum of the salaries of A and B together is Rs. 43000. A spends 95% of his salary and B spends 80% of his salary. If now their savings are the same, what is B’s salary (in Rs.) ?
A और B के वेतन का योग 43000 रुपये है | A अपनी आय का 95% तथा B अपनी आय का 80% भाग खर्च कर देता है | यदि उनकी बचत समान है, तो B का वेतन ज्ञात करें |
View SolutionThe sum of the salaries of A and B together is Rs. 45000. A spends 85% of his salary and B, 70% of his salary. If now their savings are the same, what is B’s salary (in Rs) ? /
A और B के वेतन का कुल योग 45000 रुपये है | A अपनी आय का 85% तथा B अपनी आय का 70% भाग खर्च करता है | यदि उनकी बचत समान है, तो B का वेतन (रुपये में ) ज्ञात करें |
View SolutionThe sum of the salaries of A and B is Rs. 42,000. A spends 75% of his salary and B spends 90% of his salary. Now their savings are the same. What is B’s salary (in Rs) ?
A और B के वेतन का योग 42000 रुपये है | A अपने वेतन का 75% तथा B अपने वेतन का 90% खर्च करता है | अब उनकी बचत समान है| B का वेतन ज्ञात करें |
View SolutionThe sum of the salaries of A and B is Rs. 42,000. A spends 75% of his salary and B spends 90% of his salary. Now their savings are the same. What is A’s salary (in Rs) ?
A और B के वेतन का योग 42,000 रुपये है | A अपनी आय का 75% तथा B अपनी आय का 90% खर्च कर देता है | उनकी बचत समान है | A का वेतन ( रुपये में ) ज्ञात करें |
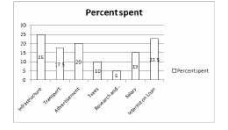
View SolutionThe given graph represents the percentage distribution of the total expenditure of a company. Study the graph and answer the question that follows.
दिया गया आरेख एक कंपनी के कुल व्यय के प्रतिशत वितरण को दर्शाता है। आरेख का अध्ययन कीजिए और फिर पूछे गए प्रश्न का उत्तर दीजिए। What is the ratio of the total expenditure on .Infrastructure. and .Transport. to the total expenditure on .Taxes. and .Interest on Loans.?
‘आधारभूत संरचना’(Infrastructure) तथा “परिवहन. (Transport) पर किये गए कुल व्यय और “करों (Taxes) तथा “ऋण पर ब्याज.(Interest on loans) पर किये गए कुल व्यय के बीच अनुपात ज्ञात कीजिए।
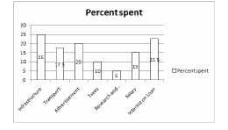
View SolutionThe given graph represents the percentage distribution of the total expenditure of a company. Study the graph and answer the question that follows.
दिया गया आरेख एक कंपनी के कुल व्यय के प्रतिशत वितरण को दर्शाता है। आरेख का अध्ययन कीजिए और फिर पूछे गए प्रश्न का उत्तर दीजिए। The total expenditure of the company is how many times the total expenditure on .Research
and Development. and .Salary.?
कंपनी का कुल व्यय .शोध तथा विकास (Reaserch and Development)’ और .वेतन.(Salary) पर किये गए कुल व्यय से कितना गुना है ?
View SolutionThe given graph represents the percentage distribution of the total expenditure of a company. Study the graph and answer the question that follows.
दिया गया आरेख एक कंपनी के कुल व्यय के प्रतिशत वितरण को दर्शाता है। आरेख का अध्ययन कीजिए और फिर पूछे गए प्रश्न का उत्तर दीजिए। The expenditure on .Interest on loans. is what percentage more than the expenditure on
.Transport.?
.ऋण पर ब्याज. (Interest on loans) में किया गया व्यय “परिवहन (Transport) पर किये गए व्यय से कितना प्रतिशत अधिक है ?
View Solution
The above graph represents the salary, expenditure, tax and savings (in rupees) per month of the persons A, B, C and D. Study the graph and answer the question. The expenditure as a percentage of salary is the least for:
उपरोक्त आरेख व्यक्ति A, B, C और D के प्रतिमाह वेतन, व्यय, कर तथा बचत ( रुपये में) को दर्शाता है। इस आरेख का अध्ययन करें तथा प्रश्न का उत्तर दें। वेतन(Salary) के प्रतिशत के रूप में सबसे कम कर(Tax) किसका है?
View Solution