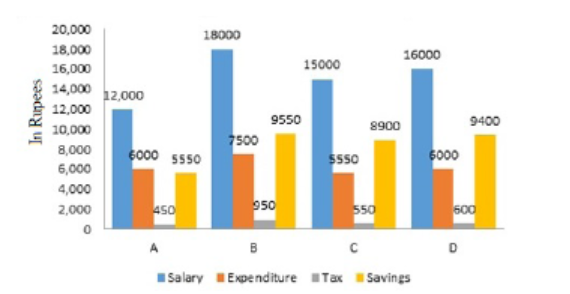
The graph represents the salary, expenditure, tax and savings (in rupees) per month of the persons A, B, C and D.
Study the graph and answer the question.
Savings as a percentage of salary is highest in case of:
उपरोक्त आरेख व्यक्ति A, B, C और D के प्रतिमाह वेतन, व्यय, कर तथा बचत ( रुपये में) को दर्शाता है। इस आरेख का अध्ययन करें तथा प्रश्न का उत्तर दें।
वेतन(Salary) के प्रतिशत के रूप में सबसे अधिक बचत(Saving) किसका है?
B
D
C
A
Step by step video & image solution for The graph represents the salary, expenditure, tax and savings (in rupees) per month of the persons A, B, C and D. Study the graph and answer the question. Savings as a percentage of salary is highest in case of: उपरोक्त आरेख व्यक्ति A, B, C और D के प्रतिमाह वेतन, व्यय, कर तथा बचत ( रुपये में) को दर्शाता है। इस आरेख का अध्ययन करें तथा प्रश्न का उत्तर दें। वेतन(Salary) के प्रतिशत के रूप में सबसे अधिक बचत(Saving) किसका है? by Maths experts to help you in doubts & scoring excellent marks in Class 14 exams.
Updated on:21/07/2023Topper's Solved these Questions
Similar Questions

The above graph represents the salary, expenditure, tax and savings (in rupees) per month of the persons A, B, C and D. Study the graph and answer the question.
Savings as a percentage of salary is highest in case of :
View Solution
The above graph represents the salary, expenditure, tax and savings (in rupees) per month of the persons A, B, C and D. Study the graph and answer the question. The expenditure as a percentage of salary is the least for:
उपरोक्त आरेख व्यक्ति A, B, C और D के प्रतिमाह वेतन, व्यय, कर तथा बचत ( रुपये में) को दर्शाता है। इस आरेख का अध्ययन करें तथा प्रश्न का उत्तर दें। वेतन(Salary) के प्रतिशत के रूप में सबसे कम कर(Tax) किसका है?
View Solution
The graph represents the salary, expenditure, tax and savings (in rupees) per month of the persons A, B, C and D. Study the graph and answer the question. The expenditure as a percentage of salary is the least for:
उपरोक्त आरेख व्यक्ति A, B, C और D के प्रतिमाह वेतन, व्यय, कर तथा बचत ( रुपये में) को दर्शाता है। इस आरेख का अध्ययन करें तथा प्रश्न का उत्तर दें। वेतन(Salary) के प्रतिशत के रूप में सबसे कम व्यय(Expenditure) किसका है?
View Solution

The above graph represents the salary, expenditure, tax and savings ( in rupees) details of the persons A, B, C and D per month.
Study the graph and answer the question.
The tax as a percentage of salary is highest in case of :
View Solution

The above grah represents the salary, expenditure, tax and savings (in rupees) details of the person A, B, C and D per month.
Study the graph and answer the question.
Tax is the percentage of salary is least in case of :
View Solution

The above graph represents the salary, expenditure, tax and savings (in rupees) per month of the presons A, B, C and D per month .
Study the graph and answer the question.
The expenditure as a percentage of salary is the least for :
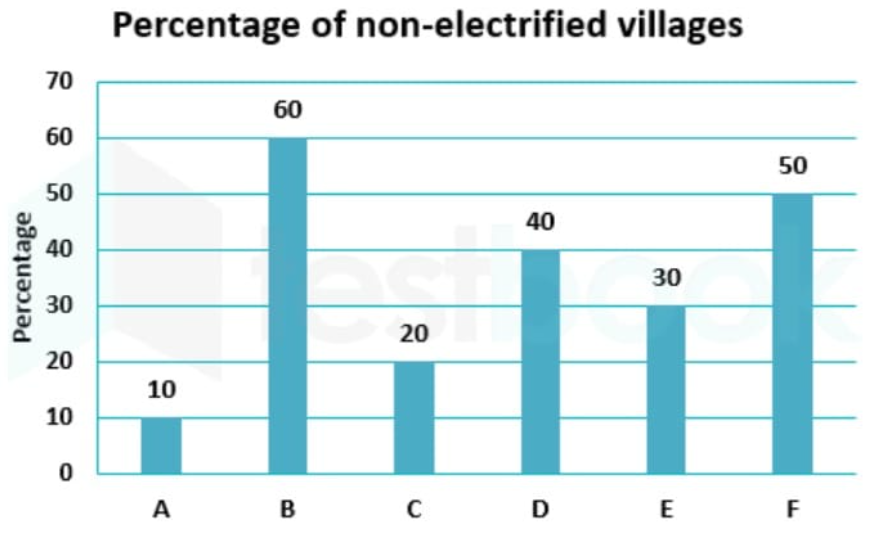
View SolutionThe given bar graph represents the percentage of non-electrified villages in 6 states A, B, C, D, E and F. Study the graph and answer the question that follows. How many states have at most 30% or less non-electrified villages?
दिया गया दंड आरेख 6 राज्यों A, B, C, D, E और F में गैर-विदयुतीकृत गांवों के प्रतिशत को दर्शाता है। आरेख का अध्ययन करें और इस प्रश्र का उत्तर दें।
कितने राज्यों में अधिकतम 30% या कम गैर-विदृयुतीकृत राज्य हैं?
View SolutionThe following graph shows the sales of cars (in thousands) in four cities in 4 years. Study the graph and answer the questions.
निम्नलिखित आरेख 4 वर्षों में चार शहरों में कारों की बिक्री (हज़ार में) को दर्शाता है। इस आरेख का अध्ययन कीजिए तथा प्रश्नों के उत्तर दीजिए। Which city has the highest sales?
किस शहर की बिक्री सबसे अधिक है?
View SolutionThe following graph shows the sales of cars (in thousands) in four cities in 4 years. Study the graph and answer the questions.
निम्नलिखित आरेख 4 वर्षों में चार शहरों में कारों की बिक्री (हज़ार में) को दर्शाता है। इस आरेख का अध्ययन कीजिए तथा प्रश्नों के उत्तर दीजिए। In which year, the sales are highest?
किस वर्ष, बिक्री सबसे अधिक हुई है?
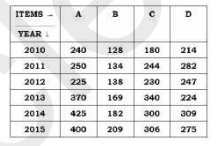
View SolutionThe given table represents the exports (in ₹ crores) of four items A,B, C and D over a period of six years. Study the table carefully and answer the questions that follows:
दी गयी तालिका छः वर्षों की अवधि के दौरान चार वस्तुओं A, B, C और D के निर्यात ( करोड़ रुपये में ) को दर्शाती है | इस तालिका का अध्ययन करें तथा फिर पूछे गए प्रश्नों के उत्तर दें | The total exports of item D in 2010, 2012 and 2014 is what percentage of the total exports of all the four items in 2011 and 2012?
2010, 2012 तथा 2014 में वस्तु D का कुल निर्यात 2011 तथा 2012 में सभी चार वस्तुओं के कुल निर्यात का कितना प्रतिशत है ?
View Solution