The given data shows the number of mobiles (in thousands) manufactured by companies C-1, C-2, C-3 and C-4 in 2017. 2018 and 2019.
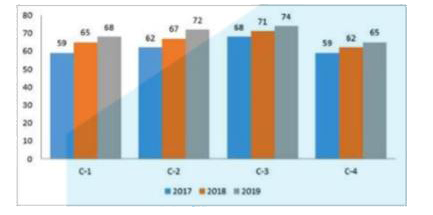
What is the ratio of total products manufactured by C-1 to that of C-4?
14:21
11:13
27:35
32:31
Step by step video & image solution for The given data shows the number of mobiles (in thousands) manufactured by companies C-1, C-2, C-3 and C-4 in 2017. 2018 and 2019. What is the ratio of total products manufactured by C-1 to that of C-4? by Maths experts to help you in doubts & scoring excellent marks in Class 14 exams.
Updated on:21/07/2023Topper's Solved these Questions
Similar Questions
The given data shows the number of mobiles (in thousands) manufactured by companies C -1, C - 2, C - 3 and C - 4 in 2017, 2018 and 2019.
दिए गए आंकड़े 2017, 2018 और 2019 में कंपनियों C - 1, C - 2, C - 3 और C - 4 द्वारा निर्मित मोबाइल (हजारों में) की संख्या को दर्शाते हैं।
Which company witnessed the highest increase in manufacturing from 2017 to 2018?
2017 से 2018 तक निर्माण में सबसे अधिक वृद्धि किस कंपनी की देखी गई?
View Solution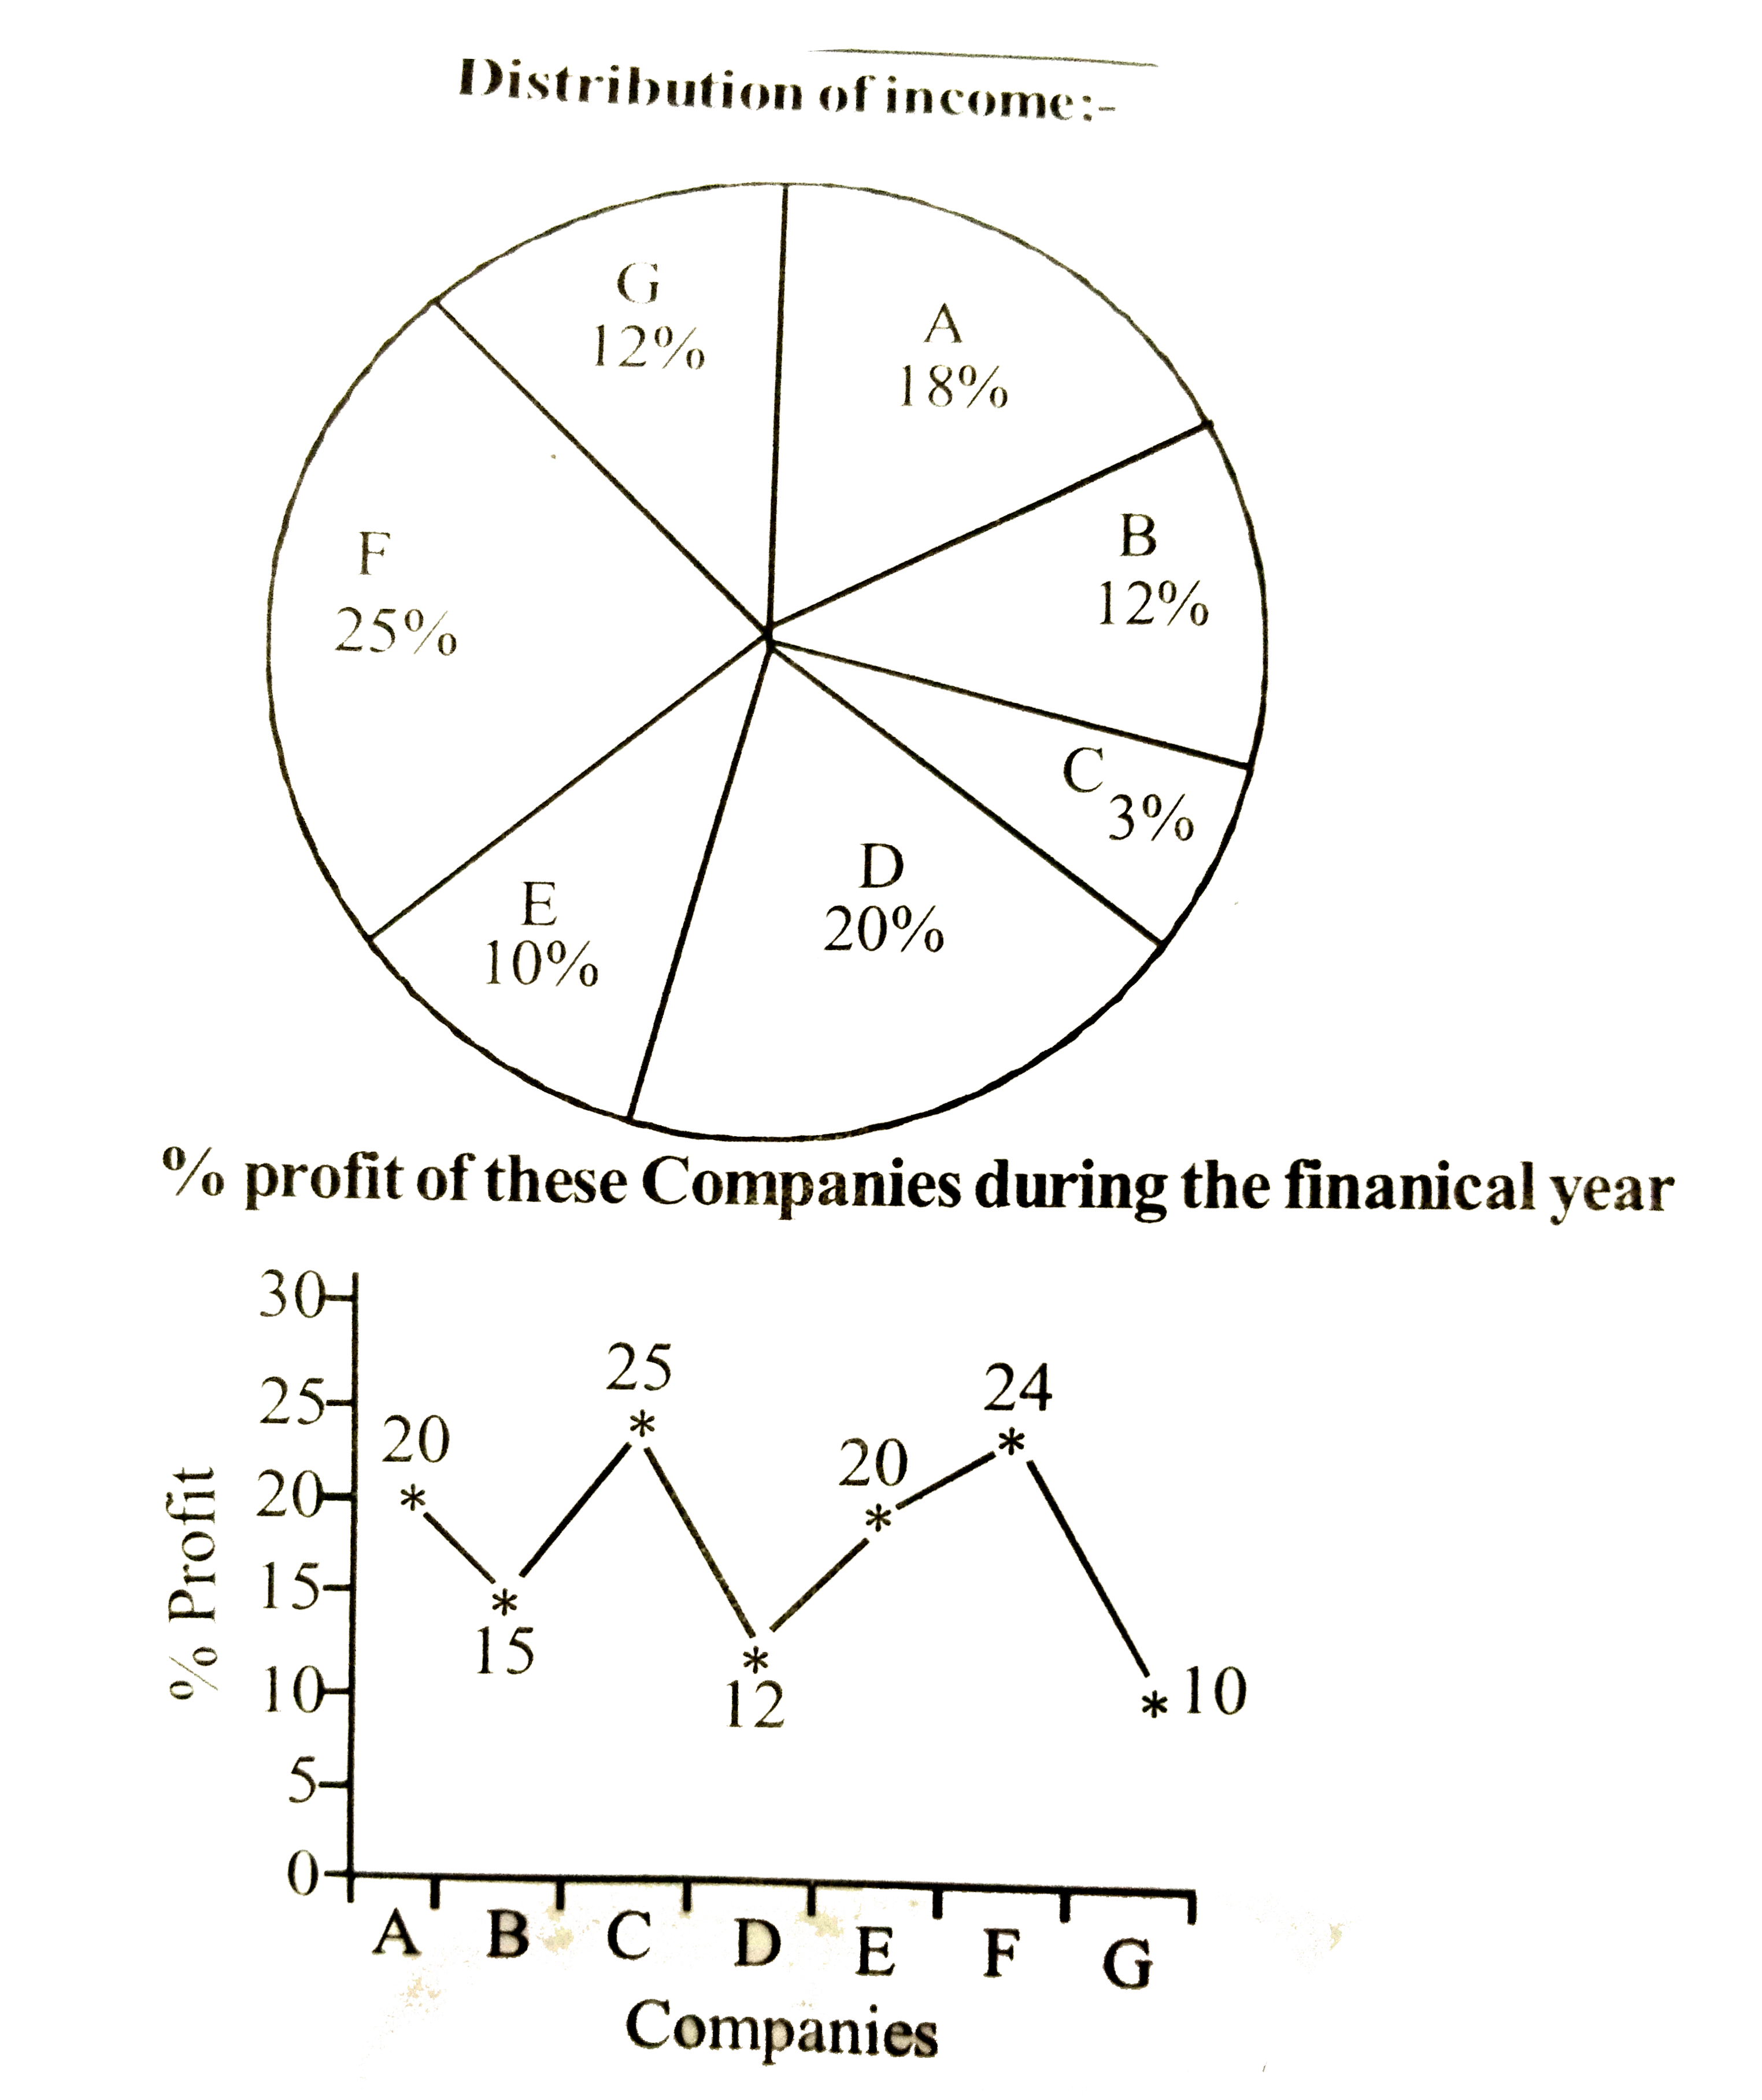
What was the ratio of the expenditure of company 'A' to that of company 'C' ?
View Solution
Knowledge Check
The given data shows the number of mobiles (in thousands) manufactured by companies C-1, C-2, C-3 and C-4 in 2017, 2018 and 2019.
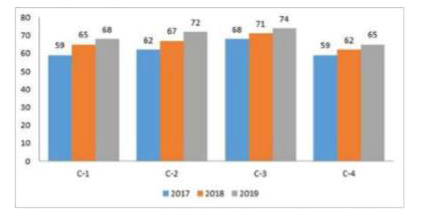
Which company manufactured the least number of mobiles across all the years?AC-1BC-4CC-3DC-2The given data shows the number of mobiles (in thousands) manufactured by companies C-1, C-2, C-3 and C-4 in 2017, 201S and 2019.
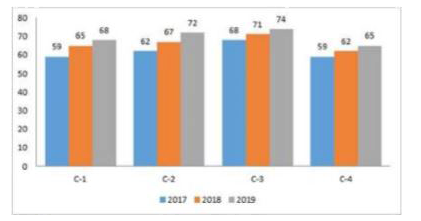
Which company manufactured the highest number of mobiles across all the years?AC-4BC-2CC-1DC-3The following bar staph shows the sales (in thousands) of motor bikes bv the factories, F1, F2, F3 and F4 in 2017, 2018 and 2019.
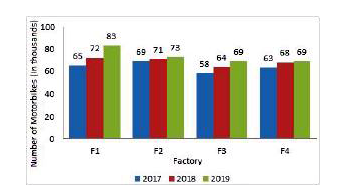
What is the ratio of total sales of Fl to that of F4 across all years?Aa)11:10Bb)10:9Cc)3:7Dd)9:11
Study the following table, (which shows the number of units of an item manufactured and sold by 5 companies) and answer the question
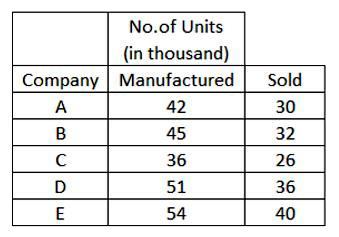
The ratio of the number of units manufactured by companies C and E together and the number of units sold by A and D together is?
View SolutionThe given bar graph presents the Imports and Exports of an Item (in tonnes) manufactured by a company for the five financial years, 2013-2014 to 2017-2018.

What is the ratio of total Exports to total Imports during the five financial years?
View SolutionFind out the total sales (in thousand) of company C1, C3 and C5 together in two years?
View SolutionThe following graph shows the production of cotton cloth (in lakh metres) by three companies A, B and C over the years.
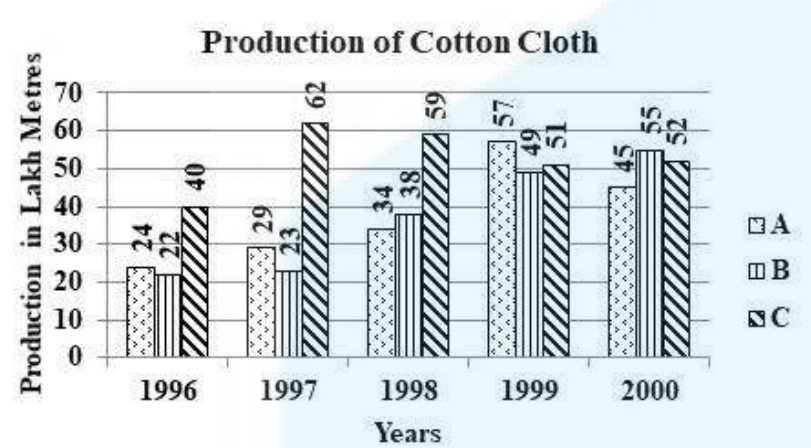
What is the ratio of the production of Company C in the years 1996 and 1997 to the production of Company B in the years 1999 and 2000?
View SolutionThe given table represents the sale (in thousands) of cars by four companies A, B, C and D in six years. Study the table and answer the question that follows.
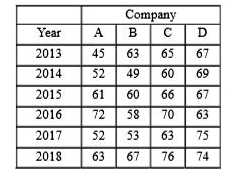
The total number of cars sold by company C in 2018 exceeds the average number of cars sold by company A during 2014 to 2018 by:
View Solution
